
|
|||||
|
 | |
| |
| |
| |
| |
| |
|
Gene: PON3 |
Gene summary for PON3 |
| Gene information | Species | Human | Gene symbol | PON3 | Gene ID | 5446 |
| Gene name | paraoxonase 3 | |
| Gene Alias | PON3 | |
| Cytomap | 7q21.3 | |
| Gene Type | protein-coding | GO ID | GO:0006082 | UniProtAcc | Q15166 |
Top |
Malignant transformation analysis |
| Identification of the aberrant gene expression in precancerous and cancerous lesions by comparing the gene expression of stem-like cells in diseased tissues with normal stem cells |
| Entrez ID | Symbol | Replicates | Species | Organ | Tissue | Adj P-value | Log2FC | Malignancy |
| 5446 | PON3 | LZE5T | Human | Esophagus | ESCC | 4.21e-02 | 3.27e-01 | 0.0514 |
| 5446 | PON3 | P2T-E | Human | Esophagus | ESCC | 4.52e-06 | 9.35e-02 | 0.1177 |
| 5446 | PON3 | P4T-E | Human | Esophagus | ESCC | 2.13e-03 | 1.48e-01 | 0.1323 |
| 5446 | PON3 | P8T-E | Human | Esophagus | ESCC | 1.38e-02 | 1.36e-01 | 0.0889 |
| 5446 | PON3 | P12T-E | Human | Esophagus | ESCC | 1.13e-02 | 1.13e-01 | 0.1122 |
| 5446 | PON3 | P16T-E | Human | Esophagus | ESCC | 3.90e-42 | 7.74e-01 | 0.1153 |
| 5446 | PON3 | P23T-E | Human | Esophagus | ESCC | 7.49e-03 | 1.48e-01 | 0.108 |
| 5446 | PON3 | P26T-E | Human | Esophagus | ESCC | 3.84e-25 | 5.38e-01 | 0.1276 |
| 5446 | PON3 | P27T-E | Human | Esophagus | ESCC | 3.75e-03 | 9.20e-02 | 0.1055 |
| 5446 | PON3 | P36T-E | Human | Esophagus | ESCC | 4.04e-03 | 3.20e-01 | 0.1187 |
| 5446 | PON3 | P37T-E | Human | Esophagus | ESCC | 1.50e-16 | 3.78e-01 | 0.1371 |
| 5446 | PON3 | P62T-E | Human | Esophagus | ESCC | 4.50e-04 | 1.91e-01 | 0.1302 |
| 5446 | PON3 | P74T-E | Human | Esophagus | ESCC | 4.35e-12 | 4.01e-01 | 0.1479 |
| 5446 | PON3 | P75T-E | Human | Esophagus | ESCC | 2.51e-09 | 2.59e-01 | 0.1125 |
| 5446 | PON3 | P76T-E | Human | Esophagus | ESCC | 5.71e-09 | 2.12e-01 | 0.1207 |
| 5446 | PON3 | P82T-E | Human | Esophagus | ESCC | 3.11e-04 | 4.12e-01 | 0.1072 |
| 5446 | PON3 | P83T-E | Human | Esophagus | ESCC | 2.58e-02 | 1.48e-01 | 0.1738 |
| 5446 | PON3 | P89T-E | Human | Esophagus | ESCC | 4.57e-02 | 2.65e-01 | 0.1752 |
| 5446 | PON3 | P130T-E | Human | Esophagus | ESCC | 3.37e-32 | 1.05e+00 | 0.1676 |
| 5446 | PON3 | NAFLD1 | Human | Liver | NAFLD | 4.76e-10 | 7.36e-01 | -0.04 |
| Page: 1 2 |
| Tissue | Expression Dynamics | Abbreviation |
| Esophagus |  | ESCC: Esophageal squamous cell carcinoma |
| HGIN: High-grade intraepithelial neoplasias | ||
| LGIN: Low-grade intraepithelial neoplasias | ||
| Liver | 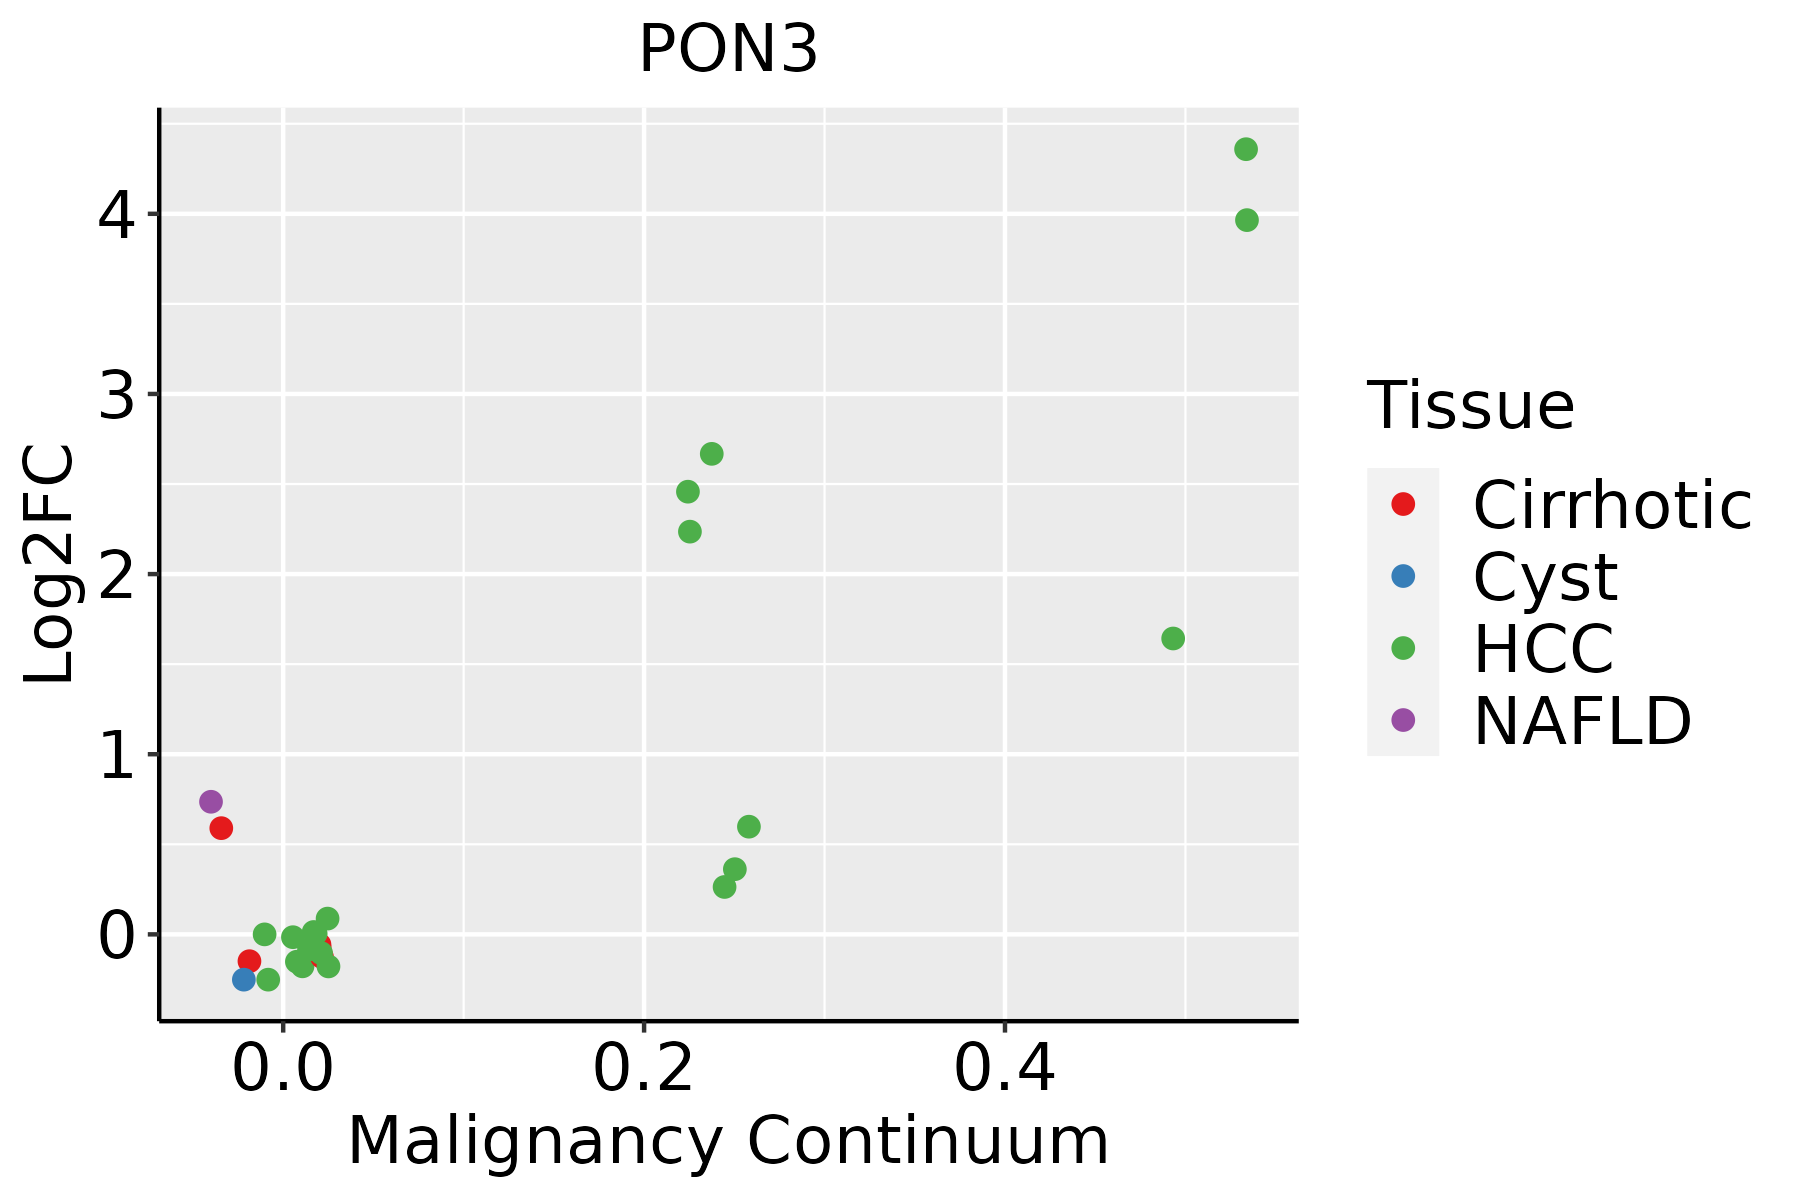 | HCC: Hepatocellular carcinoma |
| NAFLD: Non-alcoholic fatty liver disease | ||
| Oral Cavity | 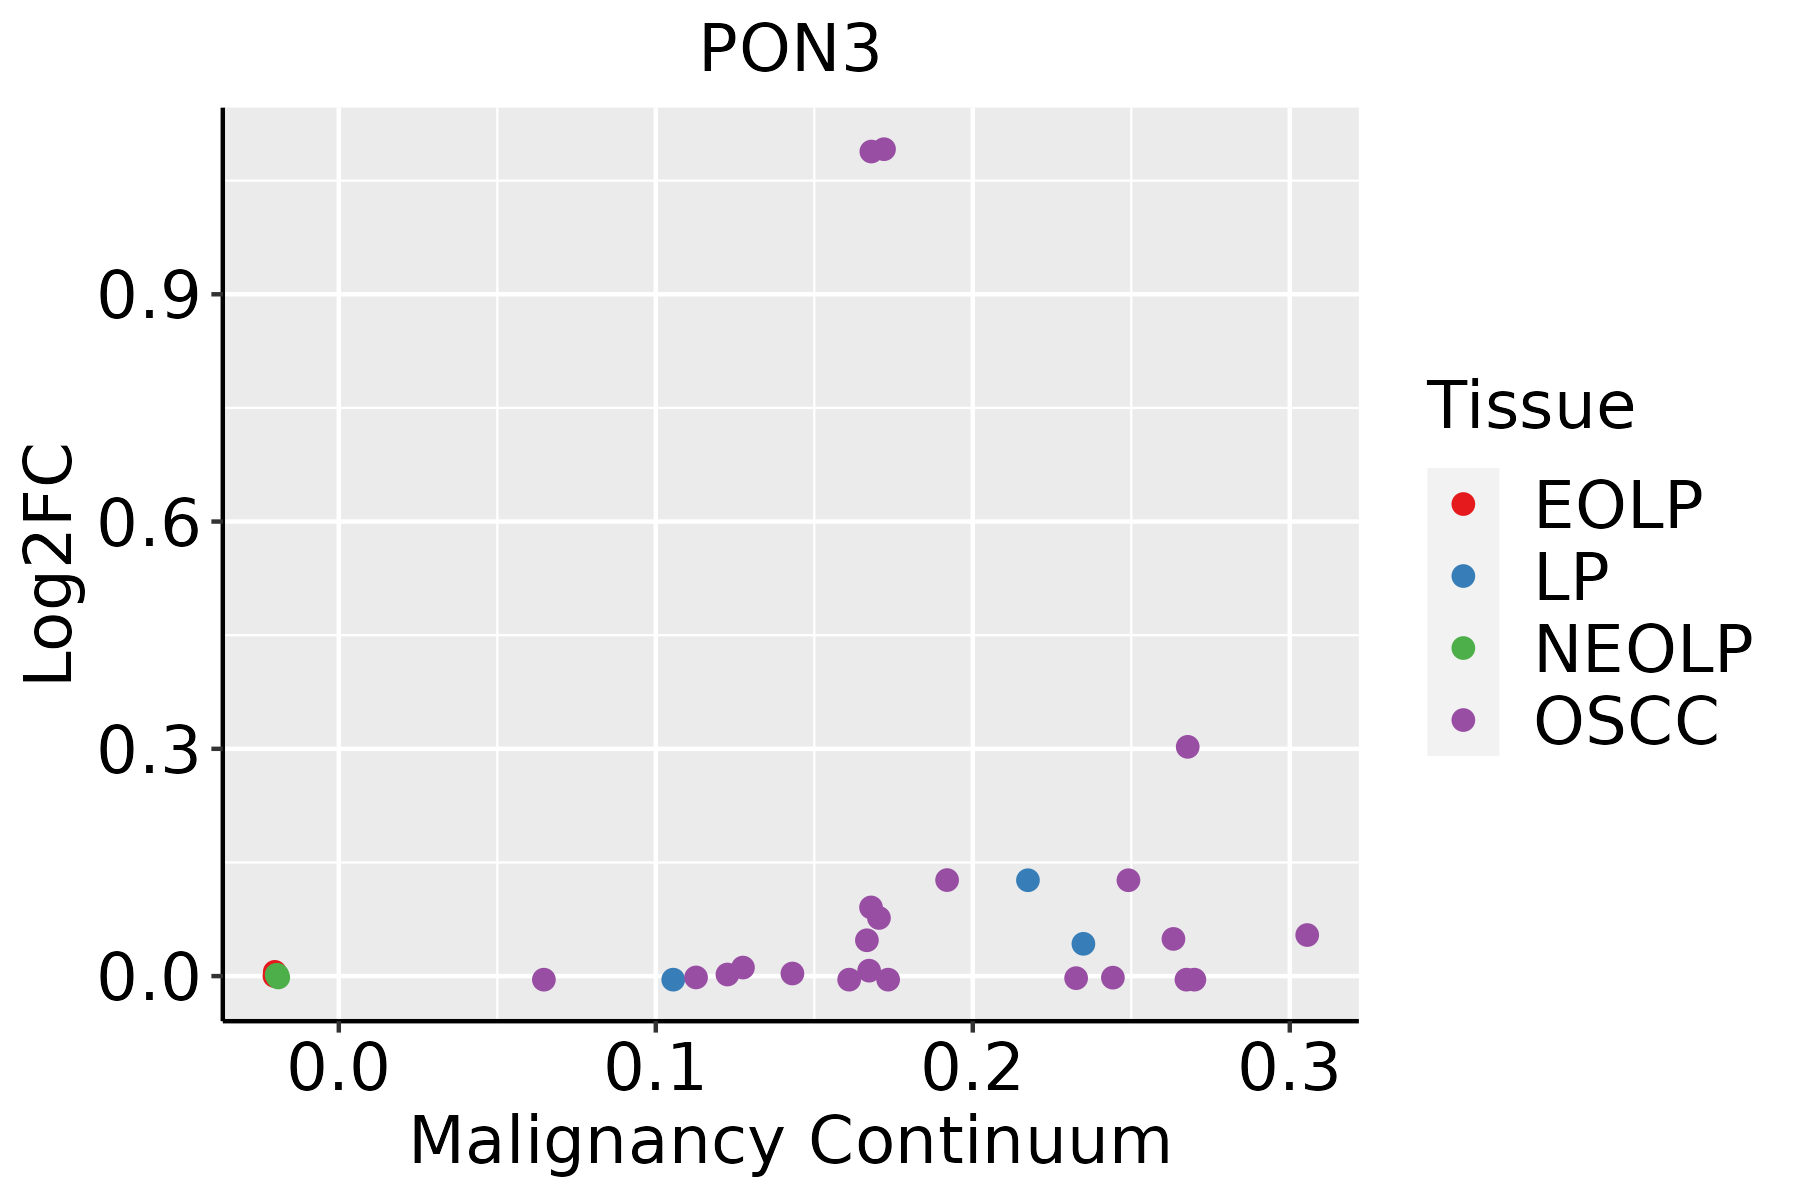 | EOLP: Erosive Oral lichen planus |
| LP: leukoplakia | ||
| NEOLP: Non-erosive oral lichen planus | ||
| OSCC: Oral squamous cell carcinoma |
| ∗log2FC in expression of this searched gene in stem-like cells from each diseased tissue sample relative to stem-like cells in normal samples in each tissue plotted against the malignancy continuum. Samples are colored based on if they are from different disease stage. |
Top |
Malignant transformation related pathway analysis |
| Find out the enriched GO biological processes and KEGG pathways involved in transition from healthy to precancer to cancer |
| Tissue | Disease Stage | Enriched GO biological Processes |
| Thyroid | PTC |  |
| Thyroid | goiters |  |
| Thyroid | ATC |  |
| ∗Top 15 enriched GO BP terms are showed in the bar plot of each disease state in each tissue. Each row represents a significant GO biological process which is colored according to the -log10(p.adjust). |
| Page: 1 2 3 4 5 6 7 8 9 |
| GO ID | Tissue | Disease Stage | Description | Gene Ratio | Bg Ratio | pvalue | p.adjust | Count |
| GO:004670018 | Esophagus | ESCC | heterocycle catabolic process | 286/8552 | 445/18723 | 1.12e-15 | 7.47e-14 | 286 |
| GO:001943918 | Esophagus | ESCC | aromatic compound catabolic process | 295/8552 | 467/18723 | 1.09e-14 | 5.98e-13 | 295 |
| GO:190136118 | Esophagus | ESCC | organic cyclic compound catabolic process | 307/8552 | 495/18723 | 9.99e-14 | 4.80e-12 | 307 |
| GO:001631110 | Esophagus | ESCC | dephosphorylation | 251/8552 | 417/18723 | 1.26e-09 | 2.99e-08 | 251 |
| GO:200037718 | Esophagus | ESCC | regulation of reactive oxygen species metabolic process | 100/8552 | 157/18723 | 3.87e-06 | 4.17e-05 | 100 |
| GO:000941020 | Esophagus | ESCC | response to xenobiotic stimulus | 253/8552 | 462/18723 | 4.55e-05 | 3.58e-04 | 253 |
| GO:000963620 | Esophagus | ESCC | response to toxic substance | 150/8552 | 262/18723 | 1.00e-04 | 7.12e-04 | 150 |
| GO:007259318 | Esophagus | ESCC | reactive oxygen species metabolic process | 137/8552 | 239/18723 | 1.82e-04 | 1.16e-03 | 137 |
| GO:00723297 | Esophagus | ESCC | monocarboxylic acid catabolic process | 74/8552 | 122/18723 | 6.03e-04 | 3.27e-03 | 74 |
| GO:00442827 | Esophagus | ESCC | small molecule catabolic process | 201/8552 | 376/18723 | 1.35e-03 | 6.41e-03 | 201 |
| GO:20003783 | Esophagus | ESCC | negative regulation of reactive oxygen species metabolic process | 34/8552 | 52/18723 | 3.26e-03 | 1.35e-02 | 34 |
| GO:00463953 | Liver | NAFLD | carboxylic acid catabolic process | 73/1882 | 236/18723 | 4.16e-19 | 1.22e-15 | 73 |
| GO:00160544 | Liver | NAFLD | organic acid catabolic process | 73/1882 | 240/18723 | 1.20e-18 | 2.34e-15 | 73 |
| GO:00442825 | Liver | NAFLD | small molecule catabolic process | 91/1882 | 376/18723 | 8.96e-16 | 1.31e-12 | 91 |
| GO:00194396 | Liver | NAFLD | aromatic compound catabolic process | 102/1882 | 467/18723 | 2.29e-14 | 1.91e-11 | 102 |
| GO:19013616 | Liver | NAFLD | organic cyclic compound catabolic process | 105/1882 | 495/18723 | 7.04e-14 | 5.15e-11 | 105 |
| GO:00467006 | Liver | NAFLD | heterocycle catabolic process | 92/1882 | 445/18723 | 1.16e-11 | 4.52e-09 | 92 |
| GO:00723295 | Liver | NAFLD | monocarboxylic acid catabolic process | 39/1882 | 122/18723 | 2.40e-11 | 8.77e-09 | 39 |
| GO:00094107 | Liver | NAFLD | response to xenobiotic stimulus | 88/1882 | 462/18723 | 2.53e-09 | 4.11e-07 | 88 |
| GO:00163115 | Liver | NAFLD | dephosphorylation | 69/1882 | 417/18723 | 2.27e-05 | 6.23e-04 | 69 |
| Page: 1 2 3 4 |
| Pathway ID | Tissue | Disease Stage | Description | Gene Ratio | Bg Ratio | pvalue | p.adjust | qvalue | Count |
| Page: 1 |
Top |
Cell-cell communication analysis |
| Identification of potential cell-cell interactions between two cell types and their ligand-receptor pairs for different disease states |
| Ligand | Receptor | LRpair | Pathway | Tissue | Disease Stage |
| Page: 1 |
Top |
Single-cell gene regulatory network inference analysis |
| Find out the significant the regulons (TFs) and the target genes of each regulon across cell types for different disease states |
| TF | Cell Type | Tissue | Disease Stage | Target Gene | RSS | Regulon Activity |
| ∗The dot plots of a searched regulon are shown for all cell subpopulations in each disease state of each tissue based on the regulon specific score inferred using pySCENIC and by calculating the average expression. |
| Page: 1 |
Top |
Somatic mutation of malignant transformation related genes |
| Annotation of somatic variants for genes involved in malignant transformation |
| Hugo Symbol | Variant Class | Variant Classification | dbSNP RS | HGVSc | HGVSp | HGVSp Short | SWISSPROT | BIOTYPE | SIFT | PolyPhen | Tumor Sample Barcode | Tissue | Histology | Sex | Age | Stage | Therapy Types | Drugs | Outcome |
| PON3 | SNV | Missense_Mutation | novel | c.929T>G | p.Leu310Trp | p.L310W | Q15166 | protein_coding | deleterious(0.01) | possibly_damaging(0.753) | TCGA-AC-A3W5-01 | Breast | breast invasive carcinoma | Female | >=65 | I/II | Chemotherapy | docetaxel | CR |
| PON3 | SNV | Missense_Mutation | c.683N>T | p.Ser228Leu | p.S228L | Q15166 | protein_coding | deleterious(0) | probably_damaging(0.999) | TCGA-AN-A0FJ-01 | Breast | breast invasive carcinoma | Female | <65 | III/IV | Unknown | Unknown | SD | |
| PON3 | SNV | Missense_Mutation | c.882N>G | p.Asn294Lys | p.N294K | Q15166 | protein_coding | deleterious(0) | possibly_damaging(0.652) | TCGA-PE-A5DC-01 | Breast | breast invasive carcinoma | Female | >=65 | III/IV | Unknown | Unknown | SD | |
| PON3 | SNV | Missense_Mutation | c.14N>C | p.Val5Ala | p.V5A | Q15166 | protein_coding | tolerated(0.21) | benign(0) | TCGA-C5-A7UC-01 | Cervix | cervical & endocervical cancer | Female | <65 | I/II | Unknown | Unknown | SD | |
| PON3 | SNV | Missense_Mutation | c.241N>A | p.Glu81Lys | p.E81K | Q15166 | protein_coding | tolerated(1) | benign(0) | TCGA-DS-A0VN-01 | Cervix | cervical & endocervical cancer | Female | <65 | I/II | Chemotherapy | cisplatin | SD | |
| PON3 | SNV | Missense_Mutation | c.712N>T | p.Asp238Tyr | p.D238Y | Q15166 | protein_coding | deleterious(0) | probably_damaging(0.961) | TCGA-A6-5659-01 | Colorectum | colon adenocarcinoma | Male | >=65 | I/II | Unknown | Unknown | SD | |
| PON3 | SNV | Missense_Mutation | rs749309125 | c.623N>A | p.Ser208Asn | p.S208N | Q15166 | protein_coding | tolerated(0.07) | benign(0.238) | TCGA-AA-3510-01 | Colorectum | colon adenocarcinoma | Male | >=65 | I/II | Unknown | Unknown | SD |
| PON3 | SNV | Missense_Mutation | c.218N>A | p.Gly73Asp | p.G73D | Q15166 | protein_coding | deleterious(0.01) | possibly_damaging(0.882) | TCGA-AA-3715-01 | Colorectum | colon adenocarcinoma | Male | >=65 | I/II | Unknown | Unknown | PD | |
| PON3 | SNV | Missense_Mutation | c.255N>G | p.Ile85Met | p.I85M | Q15166 | protein_coding | tolerated(0.06) | possibly_damaging(0.884) | TCGA-AA-3971-01 | Colorectum | colon adenocarcinoma | Male | <65 | III/IV | Chemotherapy | folinic | CR | |
| PON3 | SNV | Missense_Mutation | rs748765744 | c.817G>A | p.Asp273Asn | p.D273N | Q15166 | protein_coding | deleterious(0) | probably_damaging(0.977) | TCGA-CA-6717-01 | Colorectum | colon adenocarcinoma | Male | <65 | I/II | Chemotherapy | oxaliplatin | CR |
| Page: 1 2 3 4 5 6 |
Top |
Related drugs of malignant transformation related genes |
| Identification of chemicals and drugs interact with genes involved in malignant transfromation |
| (DGIdb 4.0) |
| Entrez ID | Symbol | Category | Interaction Types | Drug Claim Name | Drug Name | PMIDs |
| Page: 1 |

Copyright 2023-Present -The University of Texas Health Science Center at Houston |