
|
|||||
|
 | |
| |
| |
| |
| |
| |
|
Gene: PNPLA2 |
Gene summary for PNPLA2 |
| Gene information | Species | Human | Gene symbol | PNPLA2 | Gene ID | 57104 |
| Gene name | patatin like phospholipase domain containing 2 | |
| Gene Alias | 1110001C14Rik | |
| Cytomap | 11p15.5 | |
| Gene Type | protein-coding | GO ID | GO:0001523 | UniProtAcc | Q96AD5 |
Top |
Malignant transformation analysis |
| Identification of the aberrant gene expression in precancerous and cancerous lesions by comparing the gene expression of stem-like cells in diseased tissues with normal stem cells |
| Entrez ID | Symbol | Replicates | Species | Organ | Tissue | Adj P-value | Log2FC | Malignancy |
| 57104 | PNPLA2 | HTA11_3410_2000001011 | Human | Colorectum | AD | 3.10e-03 | 1.36e-01 | 0.0155 |
| 57104 | PNPLA2 | HTA11_2487_2000001011 | Human | Colorectum | SER | 9.32e-10 | 5.37e-01 | -0.1808 |
| 57104 | PNPLA2 | HTA11_1938_2000001011 | Human | Colorectum | AD | 9.03e-06 | 3.79e-01 | -0.0811 |
| 57104 | PNPLA2 | HTA11_347_2000001011 | Human | Colorectum | AD | 4.36e-07 | 2.66e-01 | -0.1954 |
| 57104 | PNPLA2 | HTA11_411_2000001011 | Human | Colorectum | SER | 4.13e-09 | 1.36e+00 | -0.2602 |
| 57104 | PNPLA2 | HTA11_2112_2000001011 | Human | Colorectum | SER | 8.47e-10 | 9.27e-01 | -0.2196 |
| 57104 | PNPLA2 | HTA11_3361_2000001011 | Human | Colorectum | AD | 5.36e-03 | 2.99e-01 | -0.1207 |
| 57104 | PNPLA2 | HTA11_696_2000001011 | Human | Colorectum | AD | 2.29e-09 | 2.68e-01 | -0.1464 |
| 57104 | PNPLA2 | HTA11_866_2000001011 | Human | Colorectum | AD | 2.58e-08 | 2.24e-01 | -0.1001 |
| 57104 | PNPLA2 | HTA11_1391_2000001011 | Human | Colorectum | AD | 1.62e-07 | 3.63e-01 | -0.059 |
| 57104 | PNPLA2 | HTA11_5212_2000001011 | Human | Colorectum | AD | 1.64e-02 | 3.49e-01 | -0.2061 |
| 57104 | PNPLA2 | HTA11_546_2000001011 | Human | Colorectum | AD | 1.32e-05 | 3.18e-01 | -0.0842 |
| 57104 | PNPLA2 | HTA11_9408_2000001011 | Human | Colorectum | AD | 2.21e-02 | 4.75e-01 | 0.0451 |
| 57104 | PNPLA2 | HTA11_7696_3000711011 | Human | Colorectum | AD | 6.87e-12 | 3.58e-01 | 0.0674 |
| 57104 | PNPLA2 | HTA11_6818_2000001011 | Human | Colorectum | AD | 4.04e-02 | 3.00e-01 | 0.0112 |
| 57104 | PNPLA2 | HTA11_99999965062_69753 | Human | Colorectum | MSI-H | 2.18e-03 | 7.77e-01 | 0.3487 |
| 57104 | PNPLA2 | HTA11_99999971662_82457 | Human | Colorectum | MSS | 6.43e-08 | 3.14e-01 | 0.3859 |
| 57104 | PNPLA2 | HTA11_99999974143_84620 | Human | Colorectum | MSS | 1.16e-03 | 1.79e-01 | 0.3005 |
| 57104 | PNPLA2 | LZE4T | Human | Esophagus | ESCC | 5.68e-06 | -9.44e-02 | 0.0811 |
| 57104 | PNPLA2 | LZE7T | Human | Esophagus | ESCC | 1.74e-04 | -7.16e-02 | 0.0667 |
| Page: 1 2 3 4 5 6 7 8 |
| Tissue | Expression Dynamics | Abbreviation |
| Colorectum (GSE201348) |  | FAP: Familial adenomatous polyposis |
| CRC: Colorectal cancer | ||
| Colorectum (HTA11) |  | AD: Adenomas |
| SER: Sessile serrated lesions | ||
| MSI-H: Microsatellite-high colorectal cancer | ||
| MSS: Microsatellite stable colorectal cancer | ||
| Esophagus |  | ESCC: Esophageal squamous cell carcinoma |
| HGIN: High-grade intraepithelial neoplasias | ||
| LGIN: Low-grade intraepithelial neoplasias | ||
| GC | 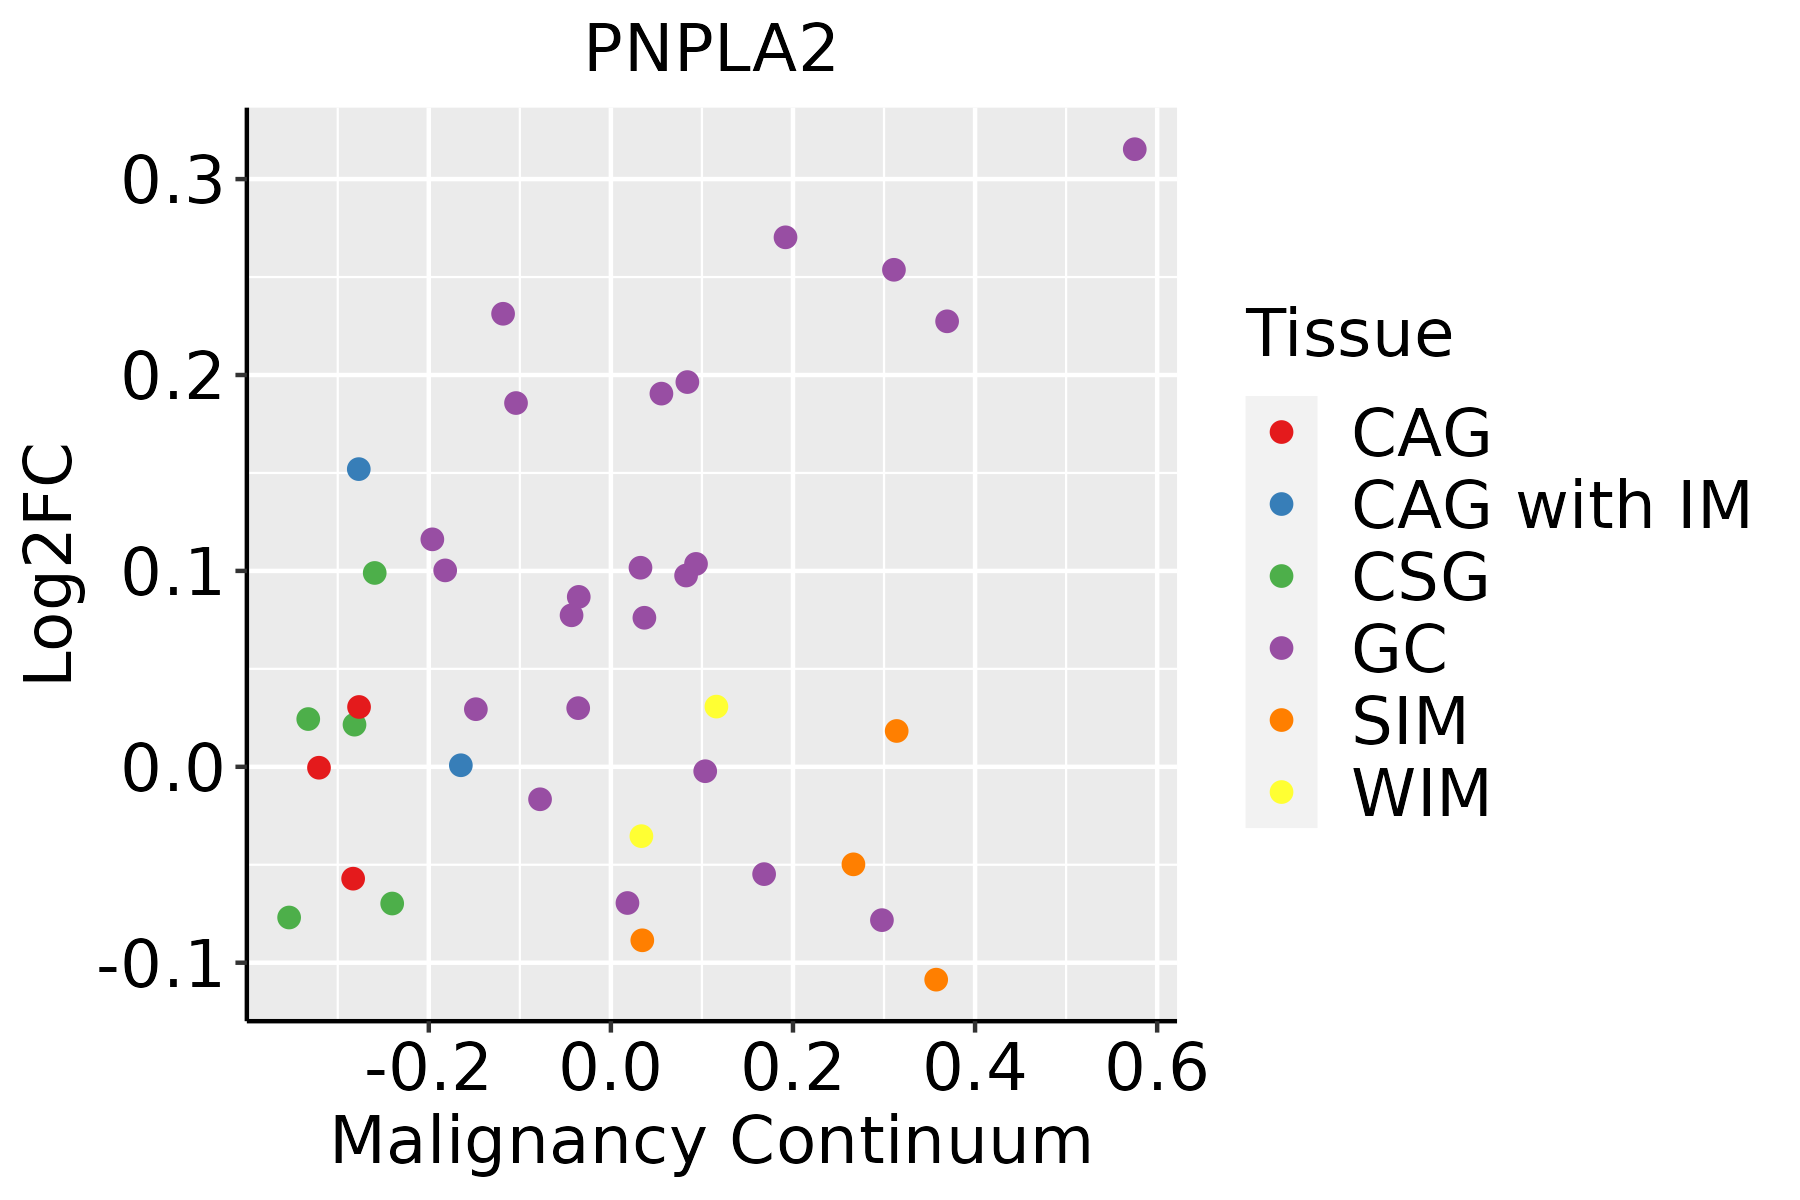 | CAG: Chronic atrophic gastritis |
| CAG with IM: Chronic atrophic gastritis with intestinal metaplasia | ||
| CSG: Chronic superficial gastritis | ||
| GC: Gastric cancer | ||
| SIM: Severe intestinal metaplasia | ||
| WIM: Wild intestinal metaplasia | ||
| Liver | 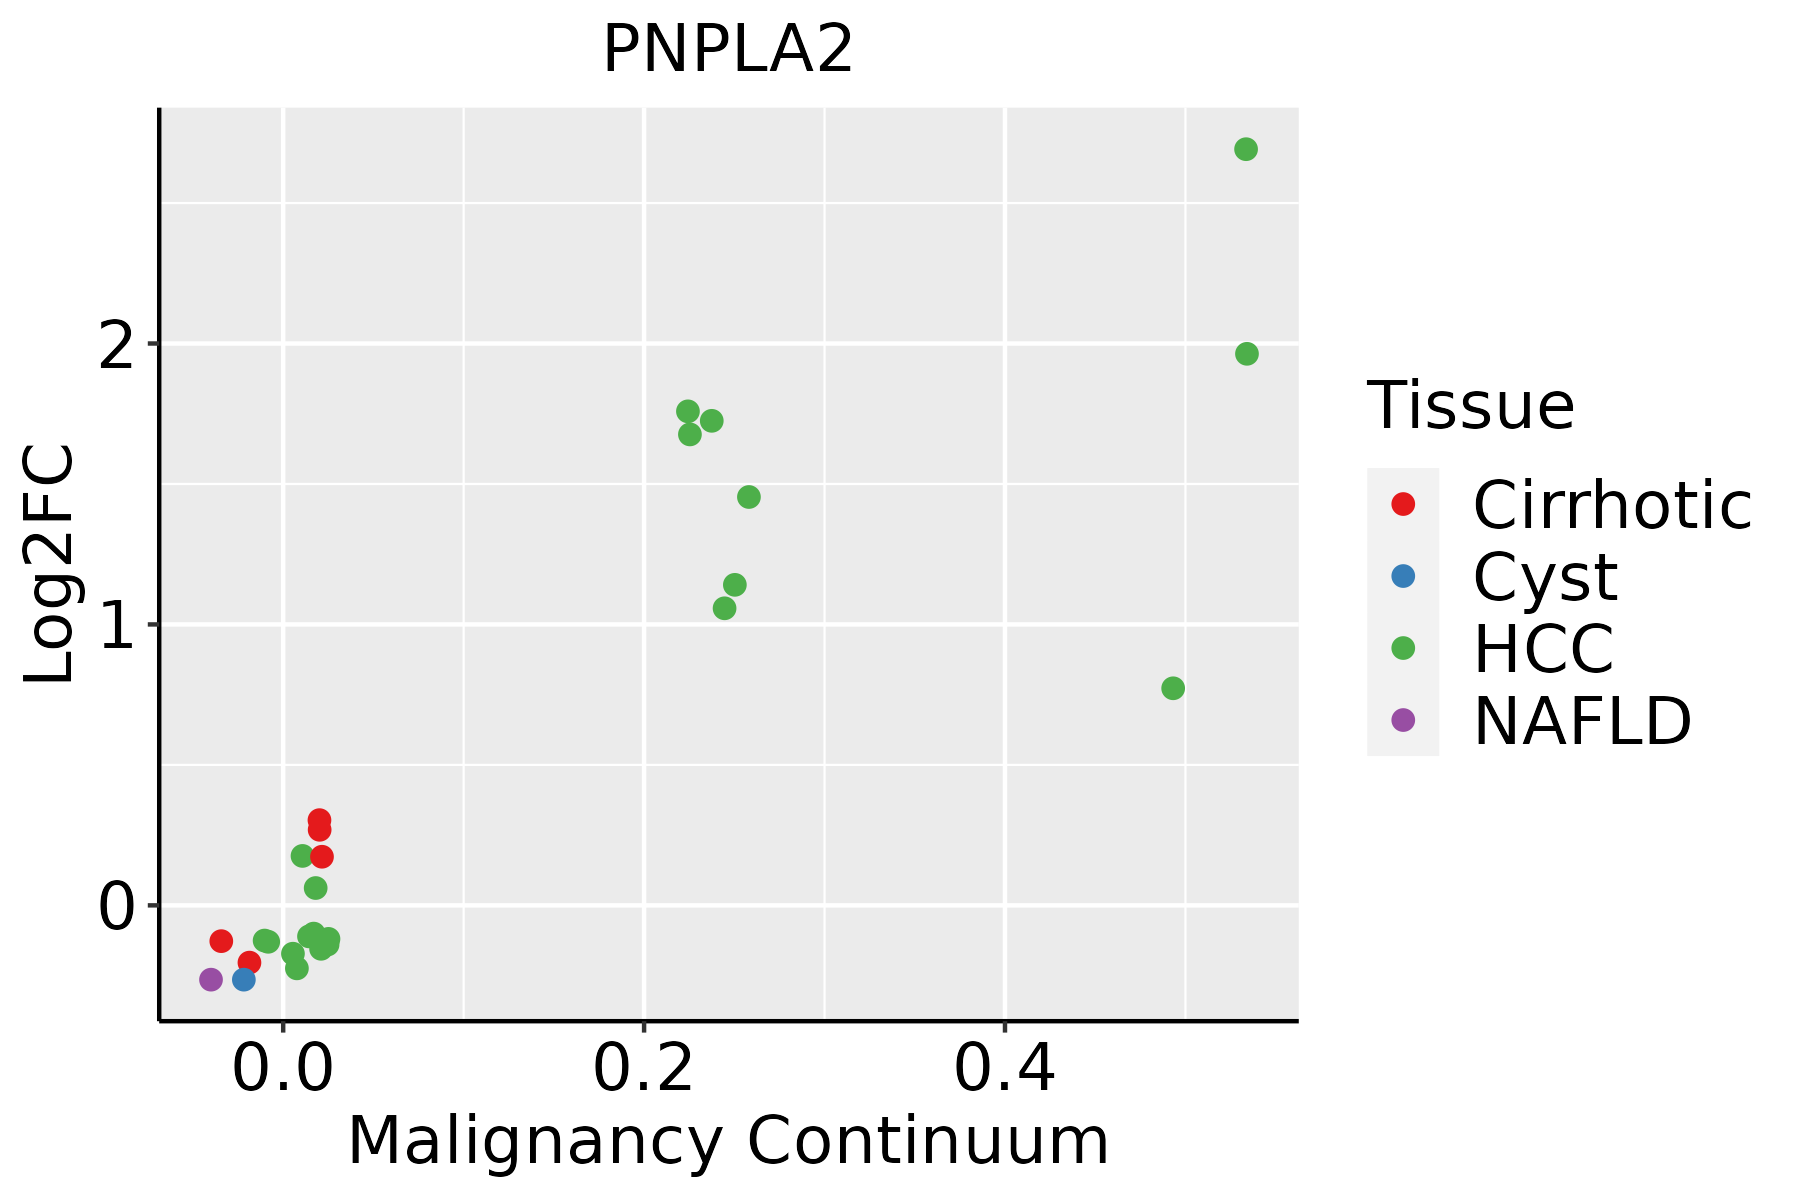 | HCC: Hepatocellular carcinoma |
| NAFLD: Non-alcoholic fatty liver disease | ||
| Oral Cavity | 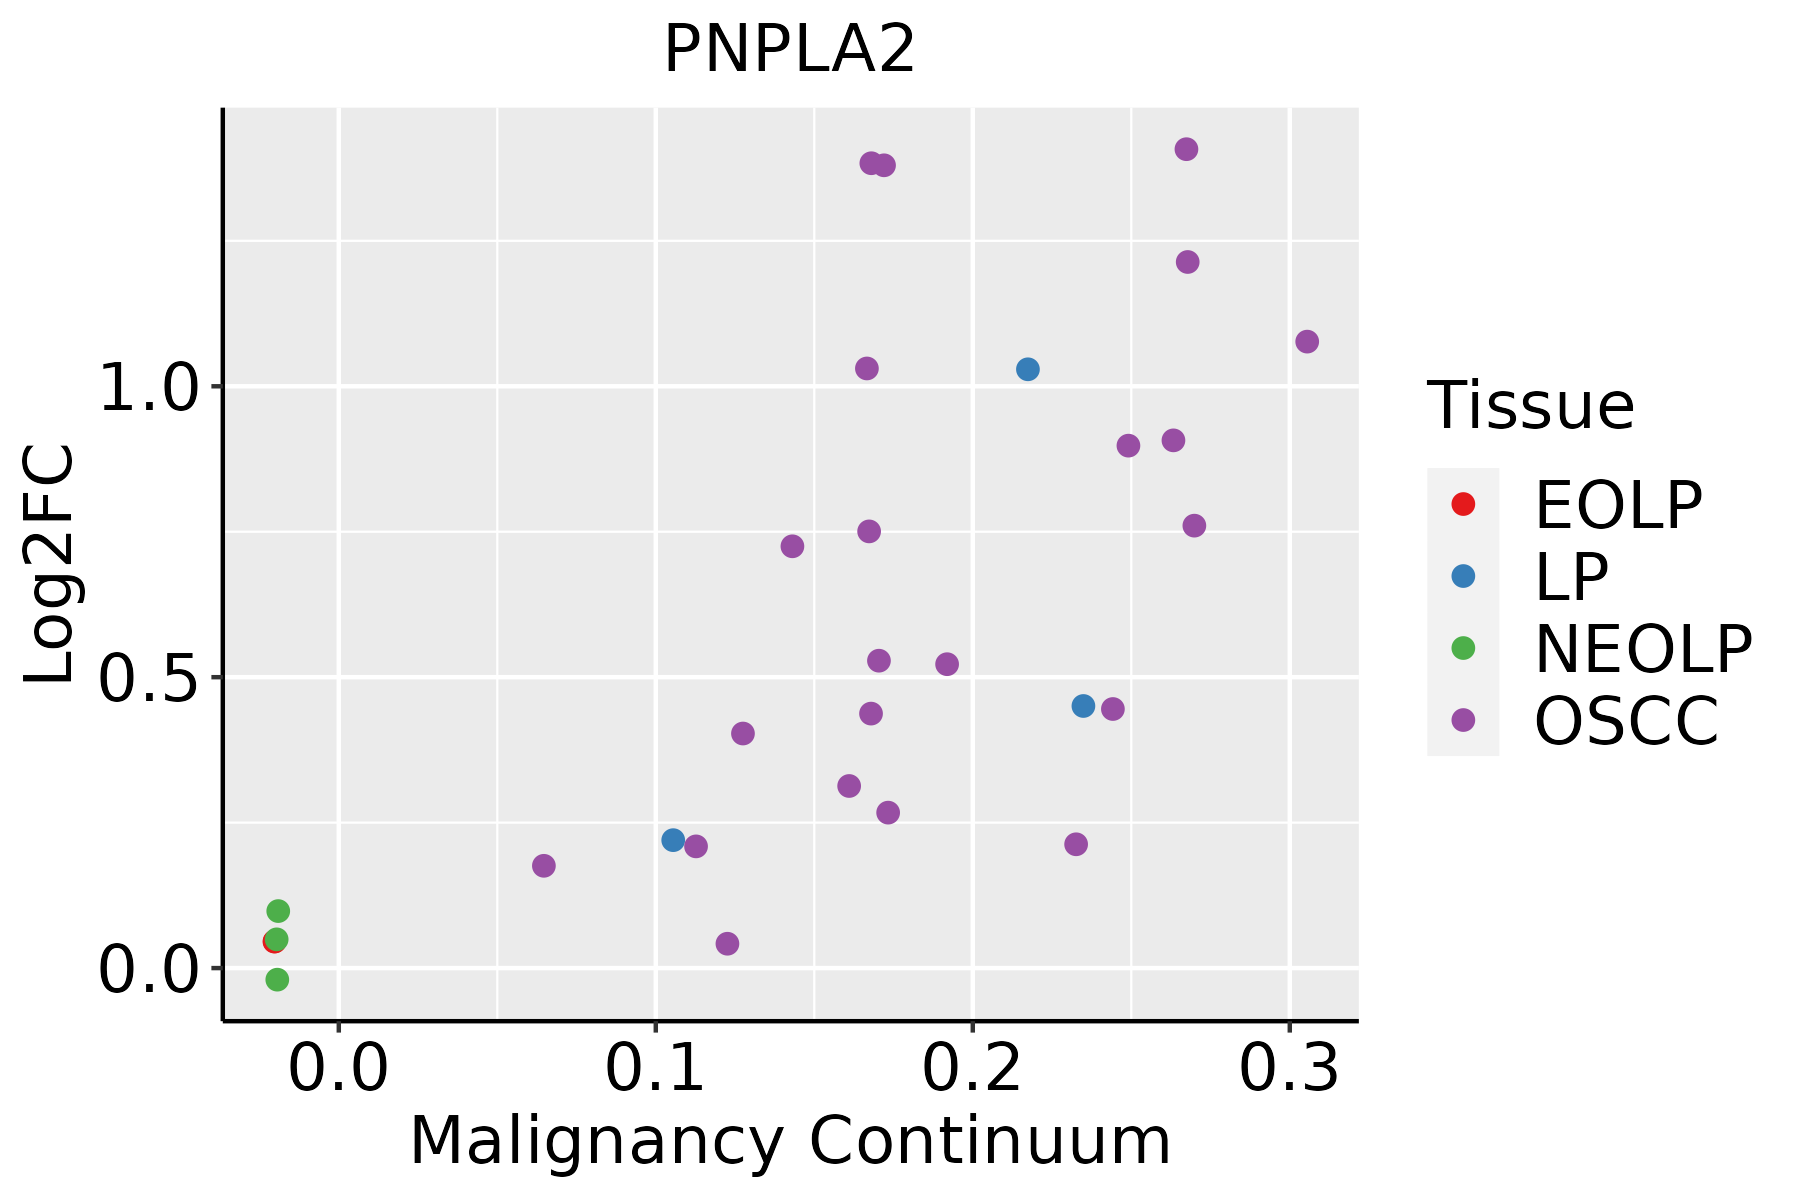 | EOLP: Erosive Oral lichen planus |
| LP: leukoplakia | ||
| NEOLP: Non-erosive oral lichen planus | ||
| OSCC: Oral squamous cell carcinoma | ||
| Prostate |  | BPH: Benign Prostatic Hyperplasia |
| Thyroid |  | ATC: Anaplastic thyroid cancer |
| HT: Hashimoto's thyroiditis | ||
| PTC: Papillary thyroid cancer |
| ∗log2FC in expression of this searched gene in stem-like cells from each diseased tissue sample relative to stem-like cells in normal samples in each tissue plotted against the malignancy continuum. Samples are colored based on if they are from different disease stage. |
Top |
Malignant transformation related pathway analysis |
| Find out the enriched GO biological processes and KEGG pathways involved in transition from healthy to precancer to cancer |
| Tissue | Disease Stage | Enriched GO biological Processes |
| Thyroid | PTC |  |
| Thyroid | goiters |  |
| Thyroid | ATC |  |
| ∗Top 15 enriched GO BP terms are showed in the bar plot of each disease state in each tissue. Each row represents a significant GO biological process which is colored according to the -log10(p.adjust). |
| Page: 1 2 3 4 5 6 7 8 9 |
| GO ID | Tissue | Disease Stage | Description | Gene Ratio | Bg Ratio | pvalue | p.adjust | Count |
| GO:0009896 | Colorectum | AD | positive regulation of catabolic process | 180/3918 | 492/18723 | 4.33e-16 | 1.94e-13 | 180 |
| GO:0031331 | Colorectum | AD | positive regulation of cellular catabolic process | 156/3918 | 427/18723 | 4.68e-14 | 1.05e-11 | 156 |
| GO:0006066 | Colorectum | AD | alcohol metabolic process | 106/3918 | 353/18723 | 3.02e-05 | 5.57e-04 | 106 |
| GO:0016042 | Colorectum | AD | lipid catabolic process | 97/3918 | 320/18723 | 4.31e-05 | 7.56e-04 | 97 |
| GO:0044242 | Colorectum | AD | cellular lipid catabolic process | 66/3918 | 214/18723 | 3.96e-04 | 4.50e-03 | 66 |
| GO:0034308 | Colorectum | AD | primary alcohol metabolic process | 35/3918 | 102/18723 | 1.16e-03 | 1.05e-02 | 35 |
| GO:0010876 | Colorectum | AD | lipid localization | 120/3918 | 448/18723 | 1.59e-03 | 1.33e-02 | 120 |
| GO:0045017 | Colorectum | AD | glycerolipid biosynthetic process | 69/3918 | 252/18723 | 8.33e-03 | 4.88e-02 | 69 |
| GO:00098961 | Colorectum | SER | positive regulation of catabolic process | 132/2897 | 492/18723 | 4.16e-11 | 6.72e-09 | 132 |
| GO:00313311 | Colorectum | SER | positive regulation of cellular catabolic process | 114/2897 | 427/18723 | 1.22e-09 | 1.27e-07 | 114 |
| GO:00160421 | Colorectum | SER | lipid catabolic process | 77/2897 | 320/18723 | 3.52e-05 | 9.18e-04 | 77 |
| GO:00060661 | Colorectum | SER | alcohol metabolic process | 79/2897 | 353/18723 | 3.50e-04 | 5.50e-03 | 79 |
| GO:00442421 | Colorectum | SER | cellular lipid catabolic process | 51/2897 | 214/18723 | 8.60e-04 | 1.05e-02 | 51 |
| GO:0046486 | Colorectum | SER | glycerolipid metabolic process | 82/2897 | 392/18723 | 2.26e-03 | 2.17e-02 | 82 |
| GO:00450171 | Colorectum | SER | glycerolipid biosynthetic process | 55/2897 | 252/18723 | 4.47e-03 | 3.56e-02 | 55 |
| GO:00343081 | Colorectum | SER | primary alcohol metabolic process | 26/2897 | 102/18723 | 5.87e-03 | 4.29e-02 | 26 |
| GO:00098962 | Colorectum | MSS | positive regulation of catabolic process | 163/3467 | 492/18723 | 3.10e-15 | 9.22e-13 | 163 |
| GO:00313312 | Colorectum | MSS | positive regulation of cellular catabolic process | 140/3467 | 427/18723 | 7.02e-13 | 1.33e-10 | 140 |
| GO:00060662 | Colorectum | MSS | alcohol metabolic process | 92/3467 | 353/18723 | 2.57e-04 | 3.46e-03 | 92 |
| GO:00108761 | Colorectum | MSS | lipid localization | 104/3467 | 448/18723 | 6.76e-03 | 4.38e-02 | 104 |
| Page: 1 2 3 4 5 6 7 8 |
| Pathway ID | Tissue | Disease Stage | Description | Gene Ratio | Bg Ratio | pvalue | p.adjust | qvalue | Count |
| hsa04714 | Colorectum | AD | Thermogenesis | 120/2092 | 232/8465 | 2.76e-19 | 1.16e-17 | 7.37e-18 | 120 |
| hsa00561 | Colorectum | AD | Glycerolipid metabolism | 24/2092 | 63/8465 | 1.25e-02 | 4.54e-02 | 2.90e-02 | 24 |
| hsa047141 | Colorectum | AD | Thermogenesis | 120/2092 | 232/8465 | 2.76e-19 | 1.16e-17 | 7.37e-18 | 120 |
| hsa005611 | Colorectum | AD | Glycerolipid metabolism | 24/2092 | 63/8465 | 1.25e-02 | 4.54e-02 | 2.90e-02 | 24 |
| hsa047142 | Colorectum | SER | Thermogenesis | 106/1580 | 232/8465 | 1.15e-21 | 6.34e-20 | 4.61e-20 | 106 |
| hsa047143 | Colorectum | SER | Thermogenesis | 106/1580 | 232/8465 | 1.15e-21 | 6.34e-20 | 4.61e-20 | 106 |
| hsa047144 | Colorectum | MSS | Thermogenesis | 113/1875 | 232/8465 | 1.52e-19 | 4.62e-18 | 2.83e-18 | 113 |
| hsa005612 | Colorectum | MSS | Glycerolipid metabolism | 23/1875 | 63/8465 | 6.55e-03 | 2.64e-02 | 1.62e-02 | 23 |
| hsa047145 | Colorectum | MSS | Thermogenesis | 113/1875 | 232/8465 | 1.52e-19 | 4.62e-18 | 2.83e-18 | 113 |
| hsa005613 | Colorectum | MSS | Glycerolipid metabolism | 23/1875 | 63/8465 | 6.55e-03 | 2.64e-02 | 1.62e-02 | 23 |
| hsa047146 | Colorectum | MSI-H | Thermogenesis | 56/797 | 232/8465 | 1.79e-11 | 4.14e-10 | 3.47e-10 | 56 |
| hsa047147 | Colorectum | MSI-H | Thermogenesis | 56/797 | 232/8465 | 1.79e-11 | 4.14e-10 | 3.47e-10 | 56 |
| hsa0471439 | Esophagus | HGIN | Thermogenesis | 91/1383 | 232/8465 | 1.97e-17 | 5.36e-16 | 4.25e-16 | 91 |
| hsa04714114 | Esophagus | HGIN | Thermogenesis | 91/1383 | 232/8465 | 1.97e-17 | 5.36e-16 | 4.25e-16 | 91 |
| hsa04714211 | Esophagus | ESCC | Thermogenesis | 163/4205 | 232/8465 | 9.22e-11 | 1.14e-09 | 5.86e-10 | 163 |
| hsa04714310 | Esophagus | ESCC | Thermogenesis | 163/4205 | 232/8465 | 9.22e-11 | 1.14e-09 | 5.86e-10 | 163 |
| hsa0471414 | Liver | Cirrhotic | Thermogenesis | 121/2530 | 232/8465 | 5.70e-13 | 1.36e-11 | 8.36e-12 | 121 |
| hsa0471415 | Liver | Cirrhotic | Thermogenesis | 121/2530 | 232/8465 | 5.70e-13 | 1.36e-11 | 8.36e-12 | 121 |
| hsa0471422 | Liver | HCC | Thermogenesis | 170/4020 | 232/8465 | 5.36e-16 | 2.25e-14 | 1.25e-14 | 170 |
| hsa005615 | Liver | HCC | Glycerolipid metabolism | 41/4020 | 63/8465 | 3.59e-03 | 1.12e-02 | 6.22e-03 | 41 |
| Page: 1 2 |
Top |
Cell-cell communication analysis |
| Identification of potential cell-cell interactions between two cell types and their ligand-receptor pairs for different disease states |
| Ligand | Receptor | LRpair | Pathway | Tissue | Disease Stage |
| Page: 1 |
Top |
Single-cell gene regulatory network inference analysis |
| Find out the significant the regulons (TFs) and the target genes of each regulon across cell types for different disease states |
| TF | Cell Type | Tissue | Disease Stage | Target Gene | RSS | Regulon Activity |
| ∗The dot plots of a searched regulon are shown for all cell subpopulations in each disease state of each tissue based on the regulon specific score inferred using pySCENIC and by calculating the average expression. |
| Page: 1 |
Top |
Somatic mutation of malignant transformation related genes |
| Annotation of somatic variants for genes involved in malignant transformation |
| Hugo Symbol | Variant Class | Variant Classification | dbSNP RS | HGVSc | HGVSp | HGVSp Short | SWISSPROT | BIOTYPE | SIFT | PolyPhen | Tumor Sample Barcode | Tissue | Histology | Sex | Age | Stage | Therapy Types | Drugs | Outcome |
| PNPLA2 | SNV | Missense_Mutation | novel | c.658N>A | p.Tyr220Asn | p.Y220N | Q96AD5 | protein_coding | deleterious(0) | probably_damaging(0.991) | TCGA-A8-A095-01 | Breast | breast invasive carcinoma | Female | <65 | I/II | Chemotherapy | 5-fluorouracil | CR |
| PNPLA2 | SNV | Missense_Mutation | novel | c.727N>T | p.Arg243Trp | p.R243W | Q96AD5 | protein_coding | deleterious(0.02) | possibly_damaging(0.821) | TCGA-LL-A5YL-01 | Breast | breast invasive carcinoma | Female | <65 | I/II | Chemotherapy | adriamycin | SD |
| PNPLA2 | SNV | Missense_Mutation | novel | c.266N>G | p.Asn89Ser | p.N89S | Q96AD5 | protein_coding | tolerated(0.06) | possibly_damaging(0.781) | TCGA-JW-A5VL-01 | Cervix | cervical & endocervical cancer | Female | <65 | I/II | Unknown | Unknown | SD |
| PNPLA2 | SNV | Missense_Mutation | novel | c.940N>C | p.Glu314Gln | p.E314Q | Q96AD5 | protein_coding | deleterious(0.02) | probably_damaging(0.98) | TCGA-VS-A9UU-01 | Cervix | cervical & endocervical cancer | Female | <65 | I/II | Chemotherapy | cisplatin | CR |
| PNPLA2 | SNV | Missense_Mutation | rs145699347 | c.616N>T | p.Arg206Trp | p.R206W | Q96AD5 | protein_coding | deleterious(0) | probably_damaging(0.987) | TCGA-A6-6653-01 | Colorectum | colon adenocarcinoma | Male | >=65 | I/II | Unknown | Unknown | SD |
| PNPLA2 | SNV | Missense_Mutation | rs758738508 | c.425N>G | p.Asn142Ser | p.N142S | Q96AD5 | protein_coding | tolerated(0.42) | benign(0.348) | TCGA-CA-6716-01 | Colorectum | colon adenocarcinoma | Male | >=65 | I/II | Chemotherapy | oxaliplatin | CR |
| PNPLA2 | SNV | Missense_Mutation | rs746987189 | c.488G>A | p.Arg163His | p.R163H | Q96AD5 | protein_coding | tolerated(0.06) | possibly_damaging(0.642) | TCGA-CM-4746-01 | Colorectum | colon adenocarcinoma | Male | <65 | I/II | Unknown | Unknown | SD |
| PNPLA2 | SNV | Missense_Mutation | novel | c.907N>T | p.Arg303Trp | p.R303W | Q96AD5 | protein_coding | deleterious(0) | possibly_damaging(0.776) | TCGA-CM-6166-01 | Colorectum | colon adenocarcinoma | Female | <65 | I/II | Unknown | Unknown | SD |
| PNPLA2 | SNV | Missense_Mutation | c.194C>A | p.Ala65Asp | p.A65D | Q96AD5 | protein_coding | deleterious(0) | possibly_damaging(0.756) | TCGA-A5-A0G1-01 | Endometrium | uterine corpus endometrioid carcinoma | Female | >=65 | I/II | Unknown | Unknown | SD | |
| PNPLA2 | SNV | Missense_Mutation | novel | c.364T>C | p.Ser122Pro | p.S122P | Q96AD5 | protein_coding | tolerated(0.09) | possibly_damaging(0.599) | TCGA-A5-A0G1-01 | Endometrium | uterine corpus endometrioid carcinoma | Female | >=65 | I/II | Unknown | Unknown | SD |
| Page: 1 2 3 |
Top |
Related drugs of malignant transformation related genes |
| Identification of chemicals and drugs interact with genes involved in malignant transfromation |
| (DGIdb 4.0) |
| Entrez ID | Symbol | Category | Interaction Types | Drug Claim Name | Drug Name | PMIDs |
| Page: 1 |

Copyright 2023-Present -The University of Texas Health Science Center at Houston |