
|
|||||
|
 | |
| |
| |
| |
| |
| |
|
Gene: PLCB4 |
Gene summary for PLCB4 |
| Gene information | Species | Human | Gene symbol | PLCB4 | Gene ID | 5332 |
| Gene name | phospholipase C beta 4 | |
| Gene Alias | ARCND2 | |
| Cytomap | 20p12.3-p12.2 | |
| Gene Type | protein-coding | GO ID | GO:0006629 | UniProtAcc | Q15147 |
Top |
Malignant transformation analysis |
| Identification of the aberrant gene expression in precancerous and cancerous lesions by comparing the gene expression of stem-like cells in diseased tissues with normal stem cells |
| Entrez ID | Symbol | Replicates | Species | Organ | Tissue | Adj P-value | Log2FC | Malignancy |
| 5332 | PLCB4 | HTA11_1938_2000001011 | Human | Colorectum | AD | 3.84e-10 | 8.63e-01 | -0.0811 |
| 5332 | PLCB4 | HTA11_78_2000001011 | Human | Colorectum | AD | 2.21e-03 | 8.74e-01 | -0.1088 |
| 5332 | PLCB4 | HTA11_347_2000001011 | Human | Colorectum | AD | 7.46e-16 | 9.22e-01 | -0.1954 |
| 5332 | PLCB4 | HTA11_866_2000001011 | Human | Colorectum | AD | 6.51e-04 | 4.29e-01 | -0.1001 |
| 5332 | PLCB4 | HTA11_1391_2000001011 | Human | Colorectum | AD | 1.01e-06 | 7.33e-01 | -0.059 |
| 5332 | PLCB4 | HTA11_5212_2000001011 | Human | Colorectum | AD | 1.17e-04 | -7.52e-01 | -0.2061 |
| 5332 | PLCB4 | HTA11_546_2000001011 | Human | Colorectum | AD | 3.71e-06 | 6.28e-01 | -0.0842 |
| 5332 | PLCB4 | HTA11_6801_2000001011 | Human | Colorectum | SER | 6.49e-07 | -9.55e-01 | 0.0171 |
| 5332 | PLCB4 | HTA11_6818_2000001011 | Human | Colorectum | AD | 2.28e-07 | 7.58e-01 | 0.0112 |
| 5332 | PLCB4 | HTA11_6818_2000001021 | Human | Colorectum | AD | 1.01e-17 | 1.22e+00 | 0.0588 |
| 5332 | PLCB4 | HTA11_99999970781_79442 | Human | Colorectum | MSS | 7.31e-03 | 5.03e-01 | 0.294 |
| 5332 | PLCB4 | HTA11_99999965104_69814 | Human | Colorectum | MSS | 4.91e-17 | 1.18e+00 | 0.281 |
| 5332 | PLCB4 | F007 | Human | Colorectum | FAP | 4.32e-18 | 4.95e-01 | 0.1176 |
| 5332 | PLCB4 | A002-C-010 | Human | Colorectum | FAP | 1.07e-27 | 4.49e-01 | 0.242 |
| 5332 | PLCB4 | A001-C-207 | Human | Colorectum | FAP | 2.20e-11 | 3.12e-01 | 0.1278 |
| 5332 | PLCB4 | A015-C-203 | Human | Colorectum | FAP | 4.20e-30 | -1.51e-01 | -0.1294 |
| 5332 | PLCB4 | A015-C-204 | Human | Colorectum | FAP | 5.55e-06 | 1.09e-01 | -0.0228 |
| 5332 | PLCB4 | A014-C-040 | Human | Colorectum | FAP | 1.20e-05 | 2.33e-01 | -0.1184 |
| 5332 | PLCB4 | A002-C-201 | Human | Colorectum | FAP | 2.87e-15 | 3.12e-02 | 0.0324 |
| 5332 | PLCB4 | A002-C-203 | Human | Colorectum | FAP | 1.93e-12 | 3.01e-01 | 0.2786 |
| Page: 1 2 3 4 5 |
| Tissue | Expression Dynamics | Abbreviation |
| Colorectum (GSE201348) |  | FAP: Familial adenomatous polyposis |
| CRC: Colorectal cancer | ||
| Colorectum (HTA11) |  | AD: Adenomas |
| SER: Sessile serrated lesions | ||
| MSI-H: Microsatellite-high colorectal cancer | ||
| MSS: Microsatellite stable colorectal cancer | ||
| Endometrium |  | AEH: Atypical endometrial hyperplasia |
| EEC: Endometrioid Cancer | ||
| Esophagus |  | ESCC: Esophageal squamous cell carcinoma |
| HGIN: High-grade intraepithelial neoplasias | ||
| LGIN: Low-grade intraepithelial neoplasias | ||
| Liver | 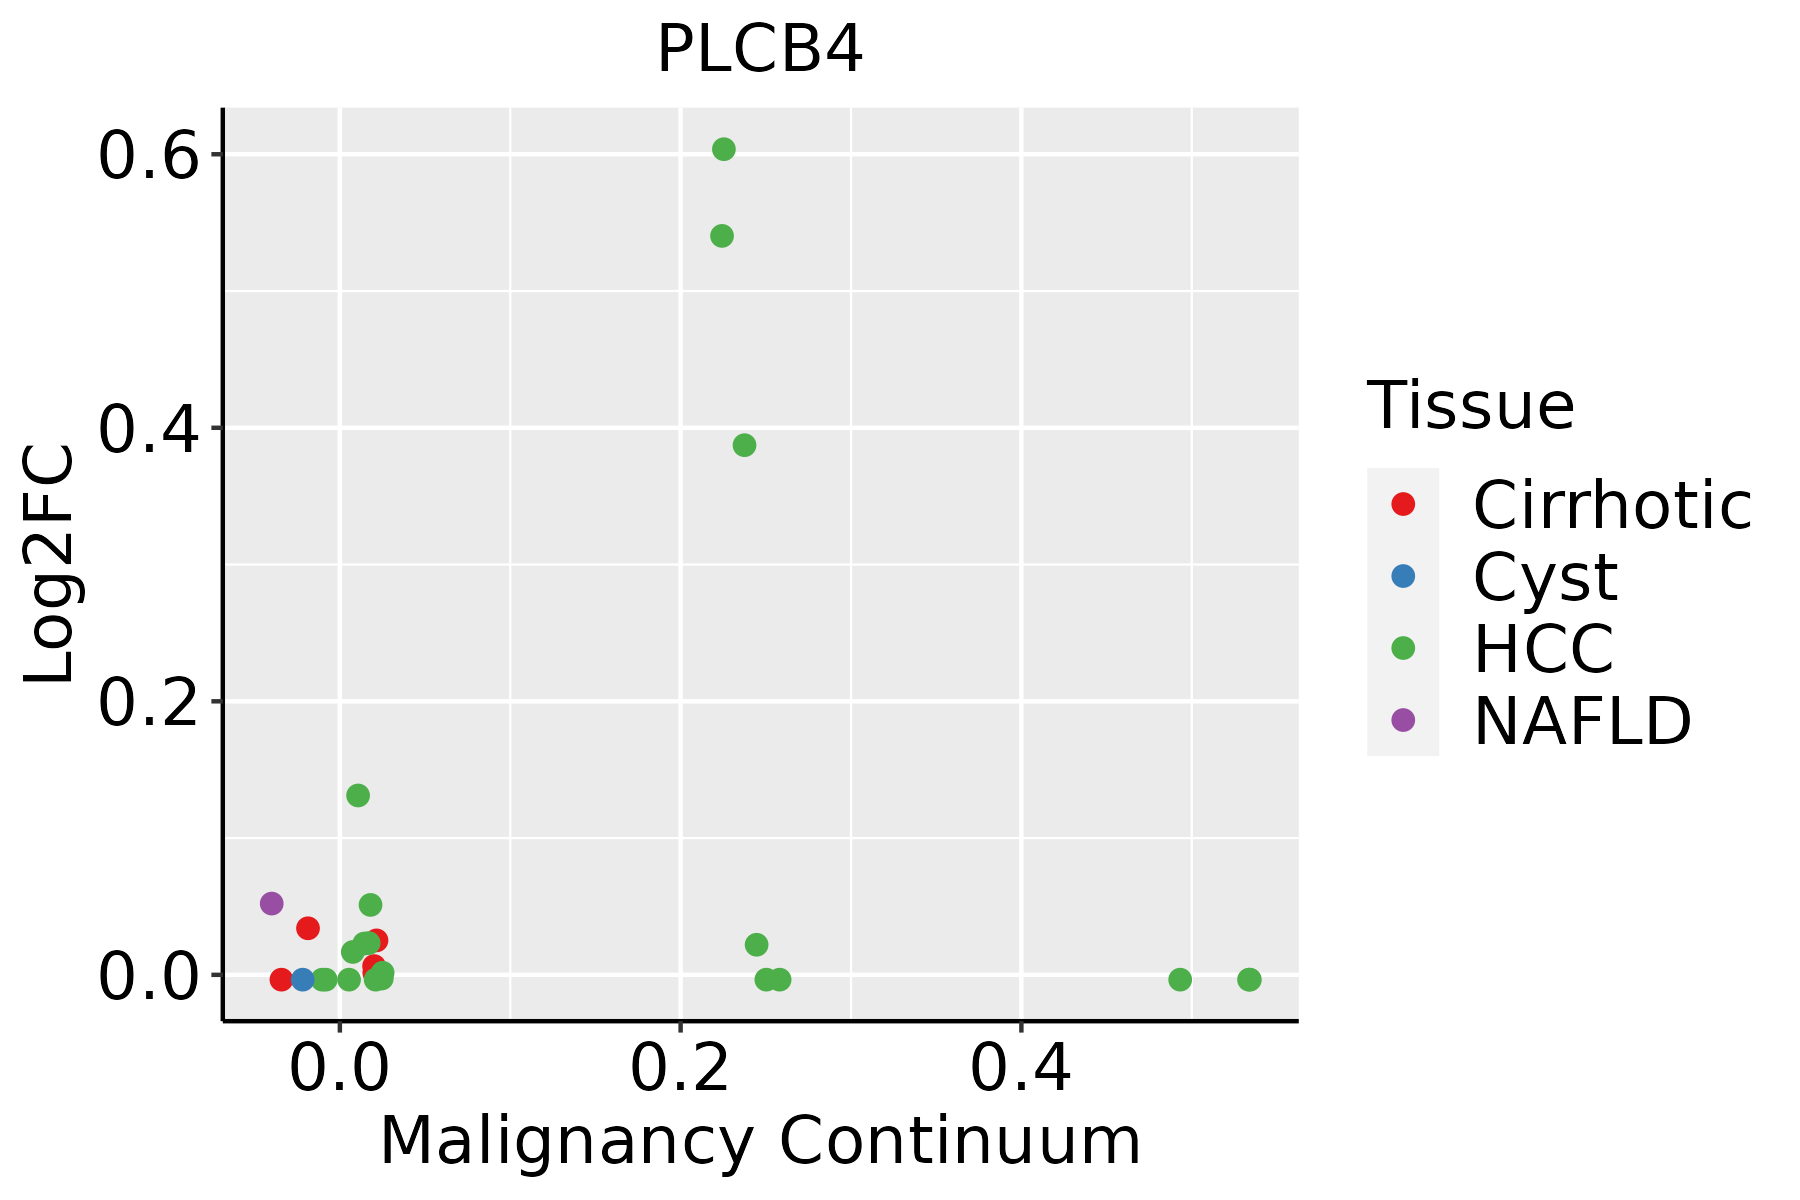 | HCC: Hepatocellular carcinoma |
| NAFLD: Non-alcoholic fatty liver disease | ||
| Thyroid |  | ATC: Anaplastic thyroid cancer |
| HT: Hashimoto's thyroiditis | ||
| PTC: Papillary thyroid cancer |
| ∗log2FC in expression of this searched gene in stem-like cells from each diseased tissue sample relative to stem-like cells in normal samples in each tissue plotted against the malignancy continuum. Samples are colored based on if they are from different disease stage. |
Top |
Malignant transformation related pathway analysis |
| Find out the enriched GO biological processes and KEGG pathways involved in transition from healthy to precancer to cancer |
| Tissue | Disease Stage | Enriched GO biological Processes |
| Thyroid | PTC |  |
| Thyroid | goiters |  |
| Thyroid | ATC |  |
| ∗Top 15 enriched GO BP terms are showed in the bar plot of each disease state in each tissue. Each row represents a significant GO biological process which is colored according to the -log10(p.adjust). |
| Page: 1 2 3 4 5 6 7 8 9 |
| GO ID | Tissue | Disease Stage | Description | Gene Ratio | Bg Ratio | pvalue | p.adjust | Count |
| GO:0016042 | Colorectum | AD | lipid catabolic process | 97/3918 | 320/18723 | 4.31e-05 | 7.56e-04 | 97 |
| GO:0048017 | Colorectum | AD | inositol lipid-mediated signaling | 53/3918 | 182/18723 | 5.35e-03 | 3.52e-02 | 53 |
| GO:0048015 | Colorectum | AD | phosphatidylinositol-mediated signaling | 52/3918 | 178/18723 | 5.37e-03 | 3.54e-02 | 52 |
| GO:00160421 | Colorectum | SER | lipid catabolic process | 77/2897 | 320/18723 | 3.52e-05 | 9.18e-04 | 77 |
| GO:00480171 | Colorectum | SER | inositol lipid-mediated signaling | 42/2897 | 182/18723 | 4.36e-03 | 3.49e-02 | 42 |
| GO:00480151 | Colorectum | SER | phosphatidylinositol-mediated signaling | 41/2897 | 178/18723 | 4.97e-03 | 3.86e-02 | 41 |
| GO:00160422 | Colorectum | MSS | lipid catabolic process | 77/3467 | 320/18723 | 7.43e-03 | 4.71e-02 | 77 |
| GO:00160423 | Colorectum | FAP | lipid catabolic process | 65/2622 | 320/18723 | 1.13e-03 | 1.08e-02 | 65 |
| GO:0050804 | Colorectum | CRC | modulation of chemical synaptic transmission | 70/2078 | 439/18723 | 1.15e-03 | 1.33e-02 | 70 |
| GO:0099177 | Colorectum | CRC | regulation of trans-synaptic signaling | 70/2078 | 440/18723 | 1.23e-03 | 1.38e-02 | 70 |
| GO:00160424 | Colorectum | CRC | lipid catabolic process | 53/2078 | 320/18723 | 1.89e-03 | 1.93e-02 | 53 |
| GO:00160427 | Esophagus | ESCC | lipid catabolic process | 168/8552 | 320/18723 | 7.97e-03 | 2.84e-02 | 168 |
| GO:001604221 | Liver | HCC | lipid catabolic process | 175/7958 | 320/18723 | 6.50e-06 | 7.88e-05 | 175 |
| Page: 1 |
| Pathway ID | Tissue | Disease Stage | Description | Gene Ratio | Bg Ratio | pvalue | p.adjust | qvalue | Count |
| hsa05415 | Colorectum | AD | Diabetic cardiomyopathy | 114/2092 | 203/8465 | 3.65e-22 | 3.06e-20 | 1.95e-20 | 114 |
| hsa05010 | Colorectum | AD | Alzheimer disease | 174/2092 | 384/8465 | 1.82e-19 | 9.26e-18 | 5.91e-18 | 174 |
| hsa05016 | Colorectum | AD | Huntington disease | 147/2092 | 306/8465 | 1.93e-19 | 9.26e-18 | 5.91e-18 | 147 |
| hsa05022 | Colorectum | AD | Pathways of neurodegeneration - multiple diseases | 201/2092 | 476/8465 | 4.54e-18 | 1.27e-16 | 8.09e-17 | 201 |
| hsa05131 | Colorectum | AD | Shigellosis | 109/2092 | 247/8465 | 1.09e-11 | 2.44e-10 | 1.55e-10 | 109 |
| hsa05017 | Colorectum | AD | Spinocerebellar ataxia | 60/2092 | 143/8465 | 3.78e-06 | 4.35e-05 | 2.78e-05 | 60 |
| hsa04919 | Colorectum | AD | Thyroid hormone signaling pathway | 51/2092 | 121/8465 | 1.71e-05 | 1.73e-04 | 1.10e-04 | 51 |
| hsa04723 | Colorectum | AD | Retrograde endocannabinoid signaling | 59/2092 | 148/8465 | 2.94e-05 | 2.73e-04 | 1.74e-04 | 59 |
| hsa04961 | Colorectum | AD | Endocrine and other factor-regulated calcium reabsorption | 24/2092 | 53/8465 | 8.49e-04 | 5.93e-03 | 3.78e-03 | 24 |
| hsa04922 | Colorectum | AD | Glucagon signaling pathway | 41/2092 | 107/8465 | 1.18e-03 | 7.75e-03 | 4.94e-03 | 41 |
| hsa05417 | Colorectum | AD | Lipid and atherosclerosis | 73/2092 | 215/8465 | 1.31e-03 | 8.27e-03 | 5.27e-03 | 73 |
| hsa04015 | Colorectum | AD | Rap1 signaling pathway | 71/2092 | 210/8465 | 1.72e-03 | 9.68e-03 | 6.18e-03 | 71 |
| hsa05163 | Colorectum | AD | Human cytomegalovirus infection | 75/2092 | 225/8465 | 2.00e-03 | 1.10e-02 | 7.01e-03 | 75 |
| hsa04912 | Colorectum | AD | GnRH signaling pathway | 35/2092 | 93/8465 | 3.69e-03 | 1.90e-02 | 1.21e-02 | 35 |
| hsa04071 | Colorectum | AD | Sphingolipid signaling pathway | 43/2092 | 121/8465 | 4.83e-03 | 2.28e-02 | 1.45e-02 | 43 |
| hsa04728 | Colorectum | AD | Dopaminergic synapse | 46/2092 | 132/8465 | 5.55e-03 | 2.48e-02 | 1.58e-02 | 46 |
| hsa04971 | Colorectum | AD | Gastric acid secretion | 29/2092 | 76/8465 | 6.25e-03 | 2.68e-02 | 1.71e-02 | 29 |
| hsa04928 | Colorectum | AD | Parathyroid hormone synthesis, secretion and action | 38/2092 | 106/8465 | 6.60e-03 | 2.77e-02 | 1.76e-02 | 38 |
| hsa04720 | Colorectum | AD | Long-term potentiation | 26/2092 | 67/8465 | 7.26e-03 | 2.97e-02 | 1.89e-02 | 26 |
| hsa04310 | Colorectum | AD | Wnt signaling pathway | 56/2092 | 171/8465 | 1.03e-02 | 3.93e-02 | 2.51e-02 | 56 |
| Page: 1 2 3 4 5 6 7 8 9 10 11 12 13 14 15 16 17 |
Top |
Cell-cell communication analysis |
| Identification of potential cell-cell interactions between two cell types and their ligand-receptor pairs for different disease states |
| Ligand | Receptor | LRpair | Pathway | Tissue | Disease Stage |
| Page: 1 |
Top |
Single-cell gene regulatory network inference analysis |
| Find out the significant the regulons (TFs) and the target genes of each regulon across cell types for different disease states |
| TF | Cell Type | Tissue | Disease Stage | Target Gene | RSS | Regulon Activity |
| ∗The dot plots of a searched regulon are shown for all cell subpopulations in each disease state of each tissue based on the regulon specific score inferred using pySCENIC and by calculating the average expression. |
| Page: 1 |
Top |
Somatic mutation of malignant transformation related genes |
| Annotation of somatic variants for genes involved in malignant transformation |
| Hugo Symbol | Variant Class | Variant Classification | dbSNP RS | HGVSc | HGVSp | HGVSp Short | SWISSPROT | BIOTYPE | SIFT | PolyPhen | Tumor Sample Barcode | Tissue | Histology | Sex | Age | Stage | Therapy Types | Drugs | Outcome |
| PLCB4 | SNV | Missense_Mutation | rs772944610 | c.2164N>A | p.Val722Ile | p.V722I | Q15147 | protein_coding | deleterious(0) | possibly_damaging(0.893) | TCGA-A2-A0EM-01 | Breast | breast invasive carcinoma | Female | >=65 | I/II | Hormone Therapy | tamoxiphen | SD |
| PLCB4 | SNV | Missense_Mutation | c.1216N>G | p.Leu406Val | p.L406V | Q15147 | protein_coding | deleterious(0) | probably_damaging(1) | TCGA-A2-A0YK-01 | Breast | breast invasive carcinoma | Female | <65 | I/II | Chemotherapy | cytoxan | SD | |
| PLCB4 | SNV | Missense_Mutation | c.1579N>G | p.His527Asp | p.H527D | Q15147 | protein_coding | tolerated(0.62) | benign(0) | TCGA-A8-A06T-01 | Breast | breast invasive carcinoma | Female | >=65 | III/IV | Hormone Therapy | anastrozole | SD | |
| PLCB4 | SNV | Missense_Mutation | c.3251N>T | p.Ser1084Phe | p.S1084F | Q15147 | protein_coding | deleterious(0) | probably_damaging(0.987) | TCGA-A8-A08L-01 | Breast | breast invasive carcinoma | Female | >=65 | III/IV | Unknown | Unknown | SD | |
| PLCB4 | SNV | Missense_Mutation | rs760551309 | c.3470N>A | p.Ser1157Tyr | p.S1157Y | Q15147 | protein_coding | deleterious(0.04) | possibly_damaging(0.628) | TCGA-A8-A09Z-01 | Breast | breast invasive carcinoma | Female | >=65 | I/II | Unknown | Unknown | SD |
| PLCB4 | SNV | Missense_Mutation | c.627C>G | p.Phe209Leu | p.F209L | Q15147 | protein_coding | deleterious(0) | probably_damaging(0.992) | TCGA-AC-A23H-01 | Breast | breast invasive carcinoma | Female | >=65 | I/II | Unknown | Unknown | PD | |
| PLCB4 | SNV | Missense_Mutation | c.2032G>C | p.Asp678His | p.D678H | Q15147 | protein_coding | deleterious(0) | probably_damaging(0.996) | TCGA-AC-A23H-01 | Breast | breast invasive carcinoma | Female | >=65 | I/II | Unknown | Unknown | PD | |
| PLCB4 | SNV | Missense_Mutation | c.2174N>G | p.Asp725Gly | p.D725G | Q15147 | protein_coding | deleterious(0) | probably_damaging(0.997) | TCGA-AN-A0AK-01 | Breast | breast invasive carcinoma | Female | >=65 | I/II | Unknown | Unknown | SD | |
| PLCB4 | SNV | Missense_Mutation | c.3155A>G | p.Lys1052Arg | p.K1052R | Q15147 | protein_coding | tolerated(0.12) | benign(0.073) | TCGA-AR-A1AY-01 | Breast | breast invasive carcinoma | Female | >=65 | I/II | Unspecific | Doxorubicin | SD | |
| PLCB4 | SNV | Missense_Mutation | c.2669G>T | p.Ser890Ile | p.S890I | Q15147 | protein_coding | tolerated(0.05) | benign(0.009) | TCGA-BH-A0DE-01 | Breast | breast invasive carcinoma | Female | <65 | I/II | Unknown | Unknown | SD |
| Page: 1 2 3 4 5 6 7 8 9 10 11 12 13 14 15 16 17 18 19 20 |
Top |
Related drugs of malignant transformation related genes |
| Identification of chemicals and drugs interact with genes involved in malignant transfromation |
| (DGIdb 4.0) |
| Entrez ID | Symbol | Category | Interaction Types | Drug Claim Name | Drug Name | PMIDs |
| Page: 1 |

Copyright 2023-Present -The University of Texas Health Science Center at Houston |