
|
|||||
|
 | |
| |
| |
| |
| |
| |
|
Gene: PGAM5 |
Gene summary for PGAM5 |
| Gene information | Species | Human | Gene symbol | PGAM5 | Gene ID | 192111 |
| Gene name | PGAM family member 5, mitochondrial serine/threonine protein phosphatase | |
| Gene Alias | BXLBV68 | |
| Cytomap | 12q24.33 | |
| Gene Type | protein-coding | GO ID | GO:0000266 | UniProtAcc | Q96HS1 |
Top |
Malignant transformation analysis |
| Identification of the aberrant gene expression in precancerous and cancerous lesions by comparing the gene expression of stem-like cells in diseased tissues with normal stem cells |
| Entrez ID | Symbol | Replicates | Species | Organ | Tissue | Adj P-value | Log2FC | Malignancy |
| 192111 | PGAM5 | HTA11_3410_2000001011 | Human | Colorectum | AD | 1.51e-03 | 9.94e-02 | 0.0155 |
| 192111 | PGAM5 | HTA11_2487_2000001011 | Human | Colorectum | SER | 8.42e-05 | 2.02e-01 | -0.1808 |
| 192111 | PGAM5 | HTA11_1938_2000001011 | Human | Colorectum | AD | 1.73e-09 | 2.84e-01 | -0.0811 |
| 192111 | PGAM5 | HTA11_78_2000001011 | Human | Colorectum | AD | 2.20e-05 | 1.47e-01 | -0.1088 |
| 192111 | PGAM5 | HTA11_347_2000001011 | Human | Colorectum | AD | 2.18e-10 | 2.13e-01 | -0.1954 |
| 192111 | PGAM5 | HTA11_83_2000001011 | Human | Colorectum | SER | 8.73e-04 | 1.63e-01 | -0.1526 |
| 192111 | PGAM5 | HTA11_696_2000001011 | Human | Colorectum | AD | 9.98e-08 | 1.96e-01 | -0.1464 |
| 192111 | PGAM5 | HTA11_866_2000001011 | Human | Colorectum | AD | 4.17e-07 | 1.34e-01 | -0.1001 |
| 192111 | PGAM5 | HTA11_1391_2000001011 | Human | Colorectum | AD | 4.60e-11 | 2.78e-01 | -0.059 |
| 192111 | PGAM5 | HTA11_5216_2000001011 | Human | Colorectum | SER | 3.40e-02 | 2.09e-01 | -0.1462 |
| 192111 | PGAM5 | HTA11_546_2000001011 | Human | Colorectum | AD | 1.44e-03 | 1.54e-01 | -0.0842 |
| 192111 | PGAM5 | HTA11_7862_2000001011 | Human | Colorectum | AD | 3.08e-04 | 2.21e-01 | -0.0179 |
| 192111 | PGAM5 | HTA11_866_3004761011 | Human | Colorectum | AD | 6.58e-14 | 2.74e-01 | 0.096 |
| 192111 | PGAM5 | HTA11_4255_2000001011 | Human | Colorectum | SER | 3.22e-05 | 3.22e-01 | 0.0446 |
| 192111 | PGAM5 | HTA11_8622_2000001021 | Human | Colorectum | SER | 4.45e-03 | 1.91e-01 | 0.0528 |
| 192111 | PGAM5 | HTA11_10623_2000001011 | Human | Colorectum | AD | 6.46e-07 | 2.50e-01 | -0.0177 |
| 192111 | PGAM5 | HTA11_6801_2000001011 | Human | Colorectum | SER | 1.19e-07 | 4.56e-01 | 0.0171 |
| 192111 | PGAM5 | HTA11_10711_2000001011 | Human | Colorectum | AD | 1.67e-03 | 1.60e-01 | 0.0338 |
| 192111 | PGAM5 | HTA11_7696_3000711011 | Human | Colorectum | AD | 4.77e-12 | 2.28e-01 | 0.0674 |
| 192111 | PGAM5 | HTA11_6818_2000001011 | Human | Colorectum | AD | 1.11e-02 | 1.68e-01 | 0.0112 |
| Page: 1 2 3 |
| Tissue | Expression Dynamics | Abbreviation |
| Colorectum (GSE201348) |  | FAP: Familial adenomatous polyposis |
| CRC: Colorectal cancer | ||
| Colorectum (HTA11) |  | AD: Adenomas |
| SER: Sessile serrated lesions | ||
| MSI-H: Microsatellite-high colorectal cancer | ||
| MSS: Microsatellite stable colorectal cancer | ||
| Liver | 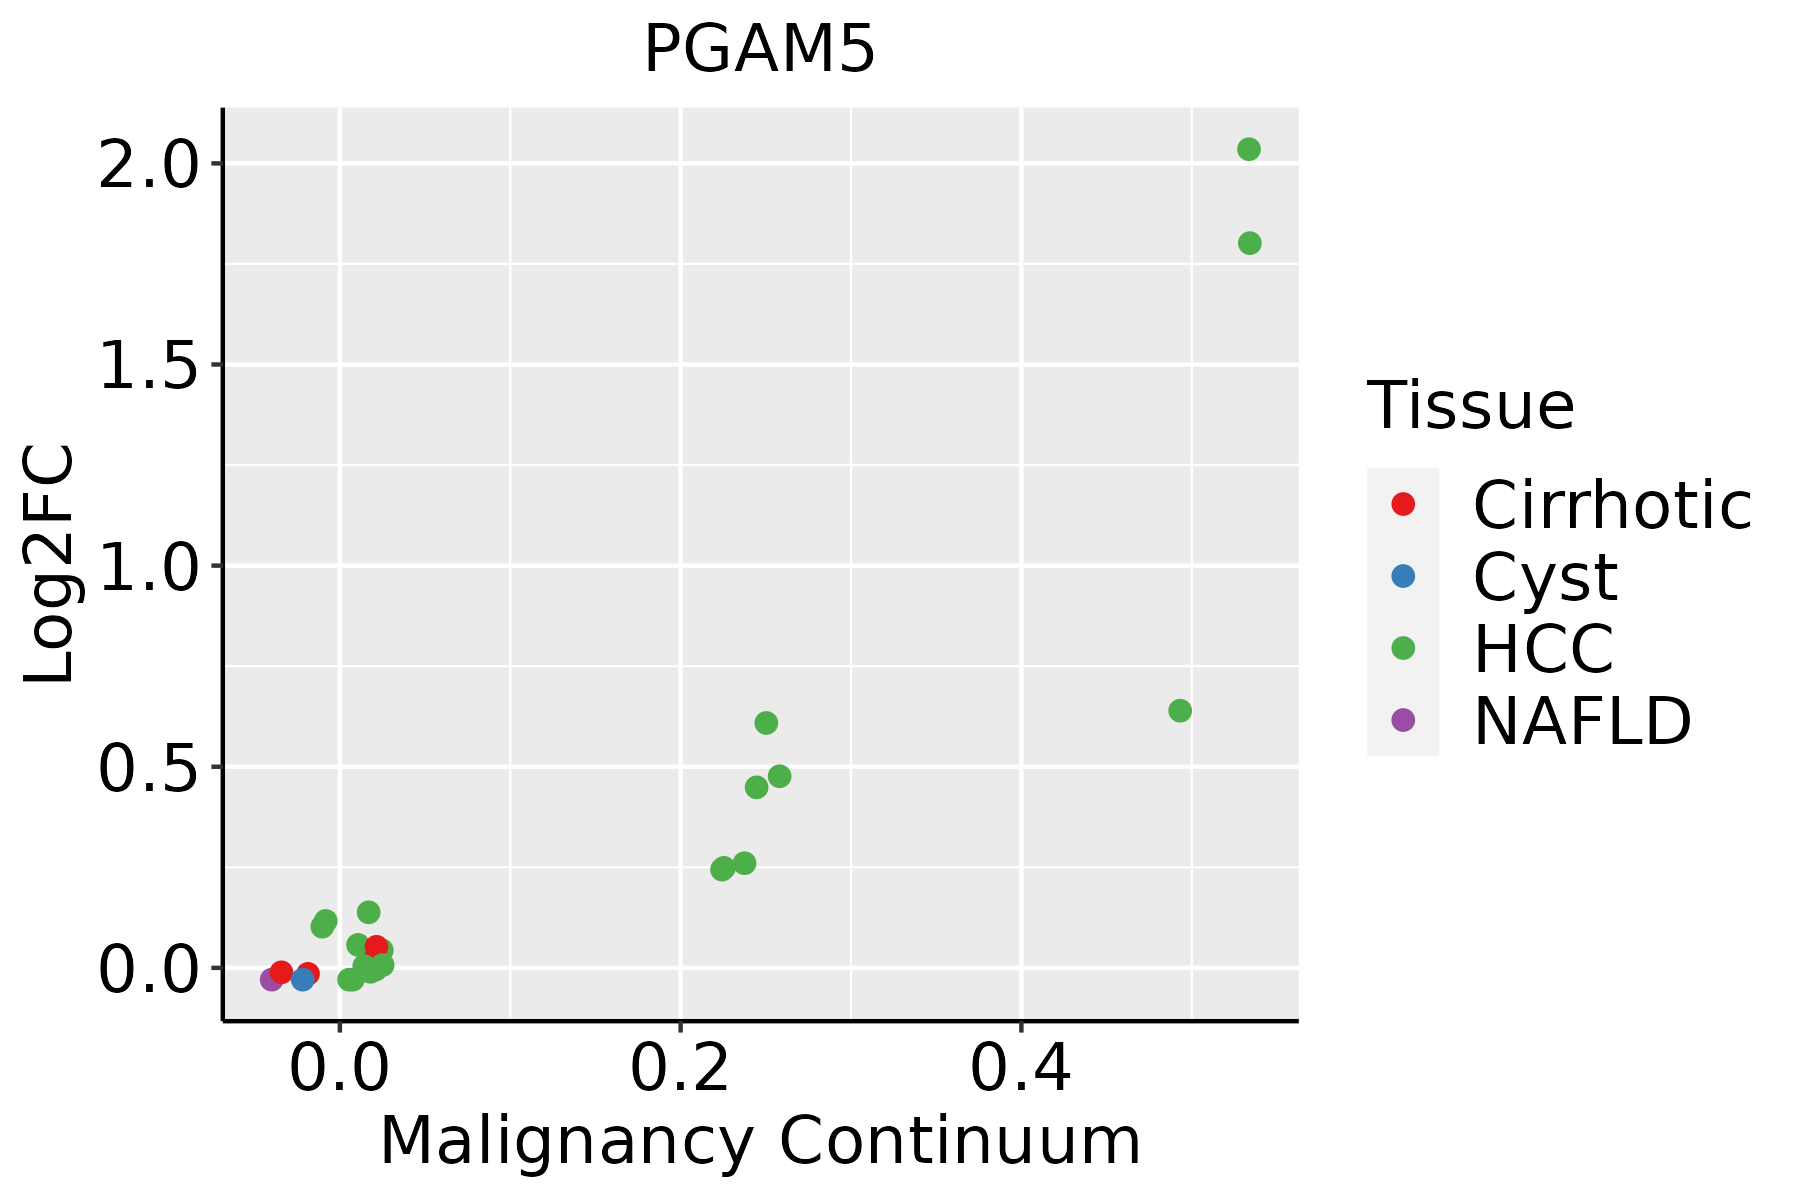 | HCC: Hepatocellular carcinoma |
| NAFLD: Non-alcoholic fatty liver disease | ||
| Oral Cavity |  | EOLP: Erosive Oral lichen planus |
| LP: leukoplakia | ||
| NEOLP: Non-erosive oral lichen planus | ||
| OSCC: Oral squamous cell carcinoma |
| ∗log2FC in expression of this searched gene in stem-like cells from each diseased tissue sample relative to stem-like cells in normal samples in each tissue plotted against the malignancy continuum. Samples are colored based on if they are from different disease stage. |
Top |
Malignant transformation related pathway analysis |
| Find out the enriched GO biological processes and KEGG pathways involved in transition from healthy to precancer to cancer |
| Tissue | Disease Stage | Enriched GO biological Processes |
| Thyroid | PTC |  |
| Thyroid | goiters |  |
| Thyroid | ATC |  |
| ∗Top 15 enriched GO BP terms are showed in the bar plot of each disease state in each tissue. Each row represents a significant GO biological process which is colored according to the -log10(p.adjust). |
| Page: 1 2 3 4 5 6 7 8 9 |
| GO ID | Tissue | Disease Stage | Description | Gene Ratio | Bg Ratio | pvalue | p.adjust | Count |
| GO:0016236 | Colorectum | AD | macroautophagy | 103/3918 | 291/18723 | 6.76e-09 | 4.15e-07 | 103 |
| GO:0010821 | Colorectum | AD | regulation of mitochondrion organization | 57/3918 | 144/18723 | 2.43e-07 | 9.92e-06 | 57 |
| GO:0010822 | Colorectum | AD | positive regulation of mitochondrion organization | 32/3918 | 74/18723 | 1.22e-05 | 2.68e-04 | 32 |
| GO:0016311 | Colorectum | AD | dephosphorylation | 123/3918 | 417/18723 | 1.84e-05 | 3.82e-04 | 123 |
| GO:0006470 | Colorectum | AD | protein dephosphorylation | 88/3918 | 281/18723 | 2.56e-05 | 4.89e-04 | 88 |
| GO:0106106 | Colorectum | AD | cold-induced thermogenesis | 43/3918 | 144/18723 | 7.05e-03 | 4.31e-02 | 43 |
| GO:0120161 | Colorectum | AD | regulation of cold-induced thermogenesis | 43/3918 | 144/18723 | 7.05e-03 | 4.31e-02 | 43 |
| GO:1990845 | Colorectum | AD | adaptive thermogenesis | 46/3918 | 157/18723 | 7.97e-03 | 4.73e-02 | 46 |
| GO:00108211 | Colorectum | SER | regulation of mitochondrion organization | 48/2897 | 144/18723 | 7.51e-08 | 4.70e-06 | 48 |
| GO:00162361 | Colorectum | SER | macroautophagy | 79/2897 | 291/18723 | 1.97e-07 | 1.10e-05 | 79 |
| GO:00108221 | Colorectum | SER | positive regulation of mitochondrion organization | 27/2897 | 74/18723 | 7.79e-06 | 2.67e-04 | 27 |
| GO:00064701 | Colorectum | SER | protein dephosphorylation | 65/2897 | 281/18723 | 4.44e-04 | 6.51e-03 | 65 |
| GO:00163111 | Colorectum | SER | dephosphorylation | 86/2897 | 417/18723 | 2.73e-03 | 2.46e-02 | 86 |
| GO:00162362 | Colorectum | MSS | macroautophagy | 93/3467 | 291/18723 | 2.08e-08 | 1.17e-06 | 93 |
| GO:00108212 | Colorectum | MSS | regulation of mitochondrion organization | 53/3467 | 144/18723 | 1.67e-07 | 7.55e-06 | 53 |
| GO:00108222 | Colorectum | MSS | positive regulation of mitochondrion organization | 30/3467 | 74/18723 | 8.51e-06 | 2.11e-04 | 30 |
| GO:00064702 | Colorectum | MSS | protein dephosphorylation | 73/3467 | 281/18723 | 1.15e-03 | 1.12e-02 | 73 |
| GO:00163112 | Colorectum | MSS | dephosphorylation | 101/3467 | 417/18723 | 1.98e-03 | 1.70e-02 | 101 |
| GO:00064703 | Colorectum | MSI-H | protein dephosphorylation | 34/1319 | 281/18723 | 1.43e-03 | 2.22e-02 | 34 |
| GO:001623621 | Liver | HCC | macroautophagy | 204/7958 | 291/18723 | 8.66e-22 | 1.41e-19 | 204 |
| Page: 1 2 3 |
| Pathway ID | Tissue | Disease Stage | Description | Gene Ratio | Bg Ratio | pvalue | p.adjust | qvalue | Count |
| hsa04137 | Colorectum | AD | Mitophagy - animal | 29/2092 | 72/8465 | 2.49e-03 | 1.35e-02 | 8.59e-03 | 29 |
| hsa041371 | Colorectum | AD | Mitophagy - animal | 29/2092 | 72/8465 | 2.49e-03 | 1.35e-02 | 8.59e-03 | 29 |
| hsa04217 | Colorectum | SER | Necroptosis | 47/1580 | 159/8465 | 5.21e-04 | 4.44e-03 | 3.22e-03 | 47 |
| hsa041372 | Colorectum | SER | Mitophagy - animal | 22/1580 | 72/8465 | 9.93e-03 | 4.78e-02 | 3.47e-02 | 22 |
| hsa042171 | Colorectum | SER | Necroptosis | 47/1580 | 159/8465 | 5.21e-04 | 4.44e-03 | 3.22e-03 | 47 |
| hsa041373 | Colorectum | SER | Mitophagy - animal | 22/1580 | 72/8465 | 9.93e-03 | 4.78e-02 | 3.47e-02 | 22 |
| hsa041374 | Colorectum | MSS | Mitophagy - animal | 27/1875 | 72/8465 | 2.17e-03 | 1.10e-02 | 6.76e-03 | 27 |
| hsa041375 | Colorectum | MSS | Mitophagy - animal | 27/1875 | 72/8465 | 2.17e-03 | 1.10e-02 | 6.76e-03 | 27 |
| hsa041376 | Colorectum | MSI-H | Mitophagy - animal | 16/797 | 72/8465 | 8.73e-04 | 1.01e-02 | 8.48e-03 | 16 |
| hsa041377 | Colorectum | MSI-H | Mitophagy - animal | 16/797 | 72/8465 | 8.73e-04 | 1.01e-02 | 8.48e-03 | 16 |
| hsa0413741 | Liver | HCC | Mitophagy - animal | 53/4020 | 72/8465 | 5.49e-06 | 4.59e-05 | 2.56e-05 | 53 |
| hsa046684 | Liver | HCC | TNF signaling pathway | 73/4020 | 114/8465 | 2.53e-04 | 1.19e-03 | 6.63e-04 | 73 |
| hsa0413751 | Liver | HCC | Mitophagy - animal | 53/4020 | 72/8465 | 5.49e-06 | 4.59e-05 | 2.56e-05 | 53 |
| hsa0466811 | Liver | HCC | TNF signaling pathway | 73/4020 | 114/8465 | 2.53e-04 | 1.19e-03 | 6.63e-04 | 73 |
| hsa0413728 | Oral cavity | OSCC | Mitophagy - animal | 58/3704 | 72/8465 | 1.48e-10 | 2.07e-09 | 1.05e-09 | 58 |
| hsa046689 | Oral cavity | OSCC | TNF signaling pathway | 82/3704 | 114/8465 | 8.30e-10 | 9.59e-09 | 4.88e-09 | 82 |
| hsa04137112 | Oral cavity | OSCC | Mitophagy - animal | 58/3704 | 72/8465 | 1.48e-10 | 2.07e-09 | 1.05e-09 | 58 |
| hsa0466816 | Oral cavity | OSCC | TNF signaling pathway | 82/3704 | 114/8465 | 8.30e-10 | 9.59e-09 | 4.88e-09 | 82 |
| Page: 1 |
Top |
Cell-cell communication analysis |
| Identification of potential cell-cell interactions between two cell types and their ligand-receptor pairs for different disease states |
| Ligand | Receptor | LRpair | Pathway | Tissue | Disease Stage |
| Page: 1 |
Top |
Single-cell gene regulatory network inference analysis |
| Find out the significant the regulons (TFs) and the target genes of each regulon across cell types for different disease states |
| TF | Cell Type | Tissue | Disease Stage | Target Gene | RSS | Regulon Activity |
| ∗The dot plots of a searched regulon are shown for all cell subpopulations in each disease state of each tissue based on the regulon specific score inferred using pySCENIC and by calculating the average expression. |
| Page: 1 |
Top |
Somatic mutation of malignant transformation related genes |
| Annotation of somatic variants for genes involved in malignant transformation |
| Hugo Symbol | Variant Class | Variant Classification | dbSNP RS | HGVSc | HGVSp | HGVSp Short | SWISSPROT | BIOTYPE | SIFT | PolyPhen | Tumor Sample Barcode | Tissue | Histology | Sex | Age | Stage | Therapy Types | Drugs | Outcome |
| PGAM5 | SNV | Missense_Mutation | c.259T>G | p.Ser87Ala | p.S87A | Q96HS1 | protein_coding | tolerated(0.32) | benign(0.003) | TCGA-D8-A1XQ-01 | Breast | breast invasive carcinoma | Female | >=65 | I/II | Unknown | Unknown | SD | |
| PGAM5 | SNV | Missense_Mutation | novel | c.309N>G | p.Ile103Met | p.I103M | Q96HS1 | protein_coding | deleterious(0) | probably_damaging(0.976) | TCGA-E2-A14Y-01 | Breast | breast invasive carcinoma | Female | <65 | I/II | Chemotherapy | carboplatin | SD |
| PGAM5 | SNV | Missense_Mutation | c.575N>T | p.Pro192Leu | p.P192L | Q96HS1 | protein_coding | deleterious(0) | benign(0.433) | TCGA-A6-2686-01 | Colorectum | colon adenocarcinoma | Female | >=65 | I/II | Unknown | Unknown | SD | |
| PGAM5 | SNV | Missense_Mutation | c.512G>A | p.Ser171Asn | p.S171N | Q96HS1 | protein_coding | tolerated(0.22) | benign(0.003) | TCGA-AD-6964-01 | Colorectum | colon adenocarcinoma | Male | <65 | III/IV | Chemotherapy | folfox | PD | |
| PGAM5 | SNV | Missense_Mutation | c.554C>T | p.Pro185Leu | p.P185L | Q96HS1 | protein_coding | deleterious(0) | probably_damaging(1) | TCGA-NH-A5IV-01 | Colorectum | colon adenocarcinoma | Female | >=65 | I/II | Unknown | Unknown | SD | |
| PGAM5 | SNV | Missense_Mutation | c.287C>A | p.Ala96Asp | p.A96D | Q96HS1 | protein_coding | deleterious(0) | probably_damaging(0.949) | TCGA-AG-A02N-01 | Colorectum | rectum adenocarcinoma | Male | >=65 | I/II | Chemotherapy | folinic | CR | |
| PGAM5 | SNV | Missense_Mutation | novel | c.712N>A | p.Val238Met | p.V238M | Q96HS1 | protein_coding | deleterious(0.02) | probably_damaging(0.986) | TCGA-EI-6882-01 | Colorectum | rectum adenocarcinoma | Male | <65 | I/II | Unknown | Unknown | SD |
| PGAM5 | SNV | Missense_Mutation | novel | c.401G>A | p.Arg134His | p.R134H | Q96HS1 | protein_coding | deleterious(0) | probably_damaging(0.996) | TCGA-A5-A1OF-01 | Endometrium | uterine corpus endometrioid carcinoma | Female | <65 | I/II | Unknown | Unknown | SD |
| PGAM5 | SNV | Missense_Mutation | novel | c.649G>A | p.Ala217Thr | p.A217T | Q96HS1 | protein_coding | tolerated(0.08) | benign(0.001) | TCGA-A5-A1OF-01 | Endometrium | uterine corpus endometrioid carcinoma | Female | <65 | I/II | Unknown | Unknown | SD |
| PGAM5 | SNV | Missense_Mutation | rs200488875 | c.452N>T | p.Thr151Met | p.T151M | Q96HS1 | protein_coding | deleterious(0.02) | possibly_damaging(0.849) | TCGA-AJ-A3OJ-01 | Endometrium | uterine corpus endometrioid carcinoma | Female | <65 | I/II | Chemotherapy | carboplatin | CR |
| Page: 1 2 3 |
Top |
Related drugs of malignant transformation related genes |
| Identification of chemicals and drugs interact with genes involved in malignant transfromation |
| (DGIdb 4.0) |
| Entrez ID | Symbol | Category | Interaction Types | Drug Claim Name | Drug Name | PMIDs |
| Page: 1 |

Copyright 2023-Present -The University of Texas Health Science Center at Houston |