
|
|||||
|
 | |
| |
| |
| |
| |
| |
|
Gene: MTREX |
Gene summary for MTREX |
| Gene information | Species | Human | Gene symbol | MTREX | Gene ID | 23517 |
| Gene name | Mtr4 exosome RNA helicase | |
| Gene Alias | Dob1 | |
| Cytomap | 5q11.2 | |
| Gene Type | protein-coding | GO ID | GO:0000375 | UniProtAcc | P42285 |
Top |
Malignant transformation analysis |
| Identification of the aberrant gene expression in precancerous and cancerous lesions by comparing the gene expression of stem-like cells in diseased tissues with normal stem cells |
| Entrez ID | Symbol | Replicates | Species | Organ | Tissue | Adj P-value | Log2FC | Malignancy |
| 23517 | MTREX | HTA11_3410_2000001011 | Human | Colorectum | AD | 1.68e-07 | -4.34e-01 | 0.0155 |
| 23517 | MTREX | HTA11_99999970781_79442 | Human | Colorectum | MSS | 3.49e-32 | -5.42e-01 | 0.294 |
| 23517 | MTREX | HTA11_99999965104_69814 | Human | Colorectum | MSS | 4.11e-10 | -5.42e-01 | 0.281 |
| 23517 | MTREX | HTA11_99999971662_82457 | Human | Colorectum | MSS | 2.12e-29 | -5.42e-01 | 0.3859 |
| 23517 | MTREX | HTA11_99999973899_84307 | Human | Colorectum | MSS | 1.59e-07 | -5.42e-01 | 0.2585 |
| 23517 | MTREX | HTA11_99999974143_84620 | Human | Colorectum | MSS | 5.54e-31 | -5.42e-01 | 0.3005 |
| 23517 | MTREX | A001-C-207 | Human | Colorectum | FAP | 1.18e-03 | -2.86e-01 | 0.1278 |
| 23517 | MTREX | A015-C-203 | Human | Colorectum | FAP | 8.61e-21 | -3.16e-01 | -0.1294 |
| 23517 | MTREX | A015-C-204 | Human | Colorectum | FAP | 2.66e-04 | -3.10e-01 | -0.0228 |
| 23517 | MTREX | A002-C-201 | Human | Colorectum | FAP | 2.55e-09 | -1.96e-01 | 0.0324 |
| 23517 | MTREX | A002-C-203 | Human | Colorectum | FAP | 2.38e-04 | -9.89e-02 | 0.2786 |
| 23517 | MTREX | A001-C-119 | Human | Colorectum | FAP | 1.02e-04 | -3.23e-01 | -0.1557 |
| 23517 | MTREX | A001-C-108 | Human | Colorectum | FAP | 1.26e-10 | -1.79e-01 | -0.0272 |
| 23517 | MTREX | A002-C-205 | Human | Colorectum | FAP | 3.32e-13 | -2.42e-01 | -0.1236 |
| 23517 | MTREX | A015-C-006 | Human | Colorectum | FAP | 4.80e-08 | -3.18e-01 | -0.0994 |
| 23517 | MTREX | A015-C-106 | Human | Colorectum | FAP | 1.28e-06 | -2.33e-01 | -0.0511 |
| 23517 | MTREX | A002-C-114 | Human | Colorectum | FAP | 1.31e-12 | -3.79e-01 | -0.1561 |
| 23517 | MTREX | A015-C-104 | Human | Colorectum | FAP | 1.53e-19 | -2.29e-01 | -0.1899 |
| 23517 | MTREX | A001-C-014 | Human | Colorectum | FAP | 1.21e-10 | -2.04e-01 | 0.0135 |
| 23517 | MTREX | A002-C-016 | Human | Colorectum | FAP | 1.16e-12 | -2.50e-01 | 0.0521 |
| Page: 1 2 3 4 |
| Tissue | Expression Dynamics | Abbreviation |
| Colorectum (GSE201348) |  | FAP: Familial adenomatous polyposis |
| CRC: Colorectal cancer | ||
| Colorectum (HTA11) |  | AD: Adenomas |
| SER: Sessile serrated lesions | ||
| MSI-H: Microsatellite-high colorectal cancer | ||
| MSS: Microsatellite stable colorectal cancer | ||
| Liver | 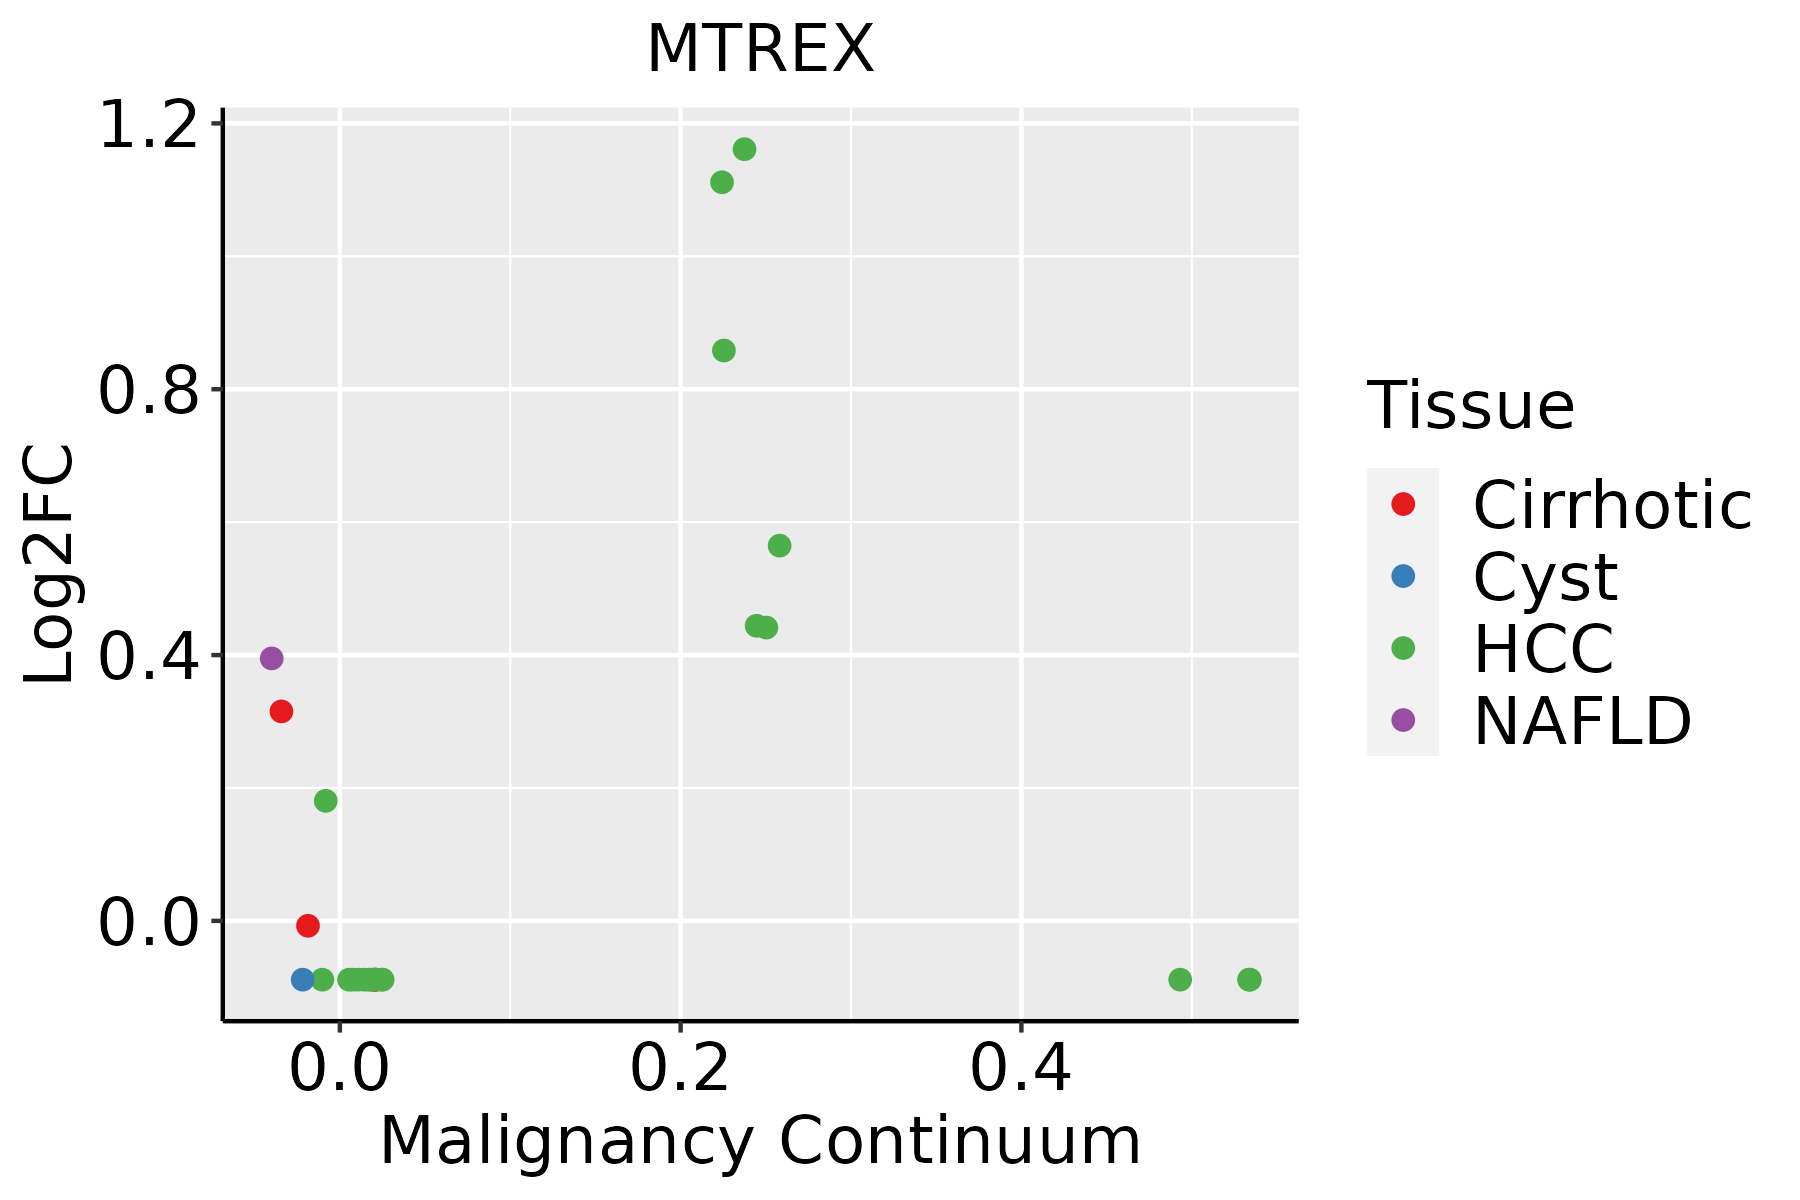 | HCC: Hepatocellular carcinoma |
| NAFLD: Non-alcoholic fatty liver disease | ||
| Thyroid | 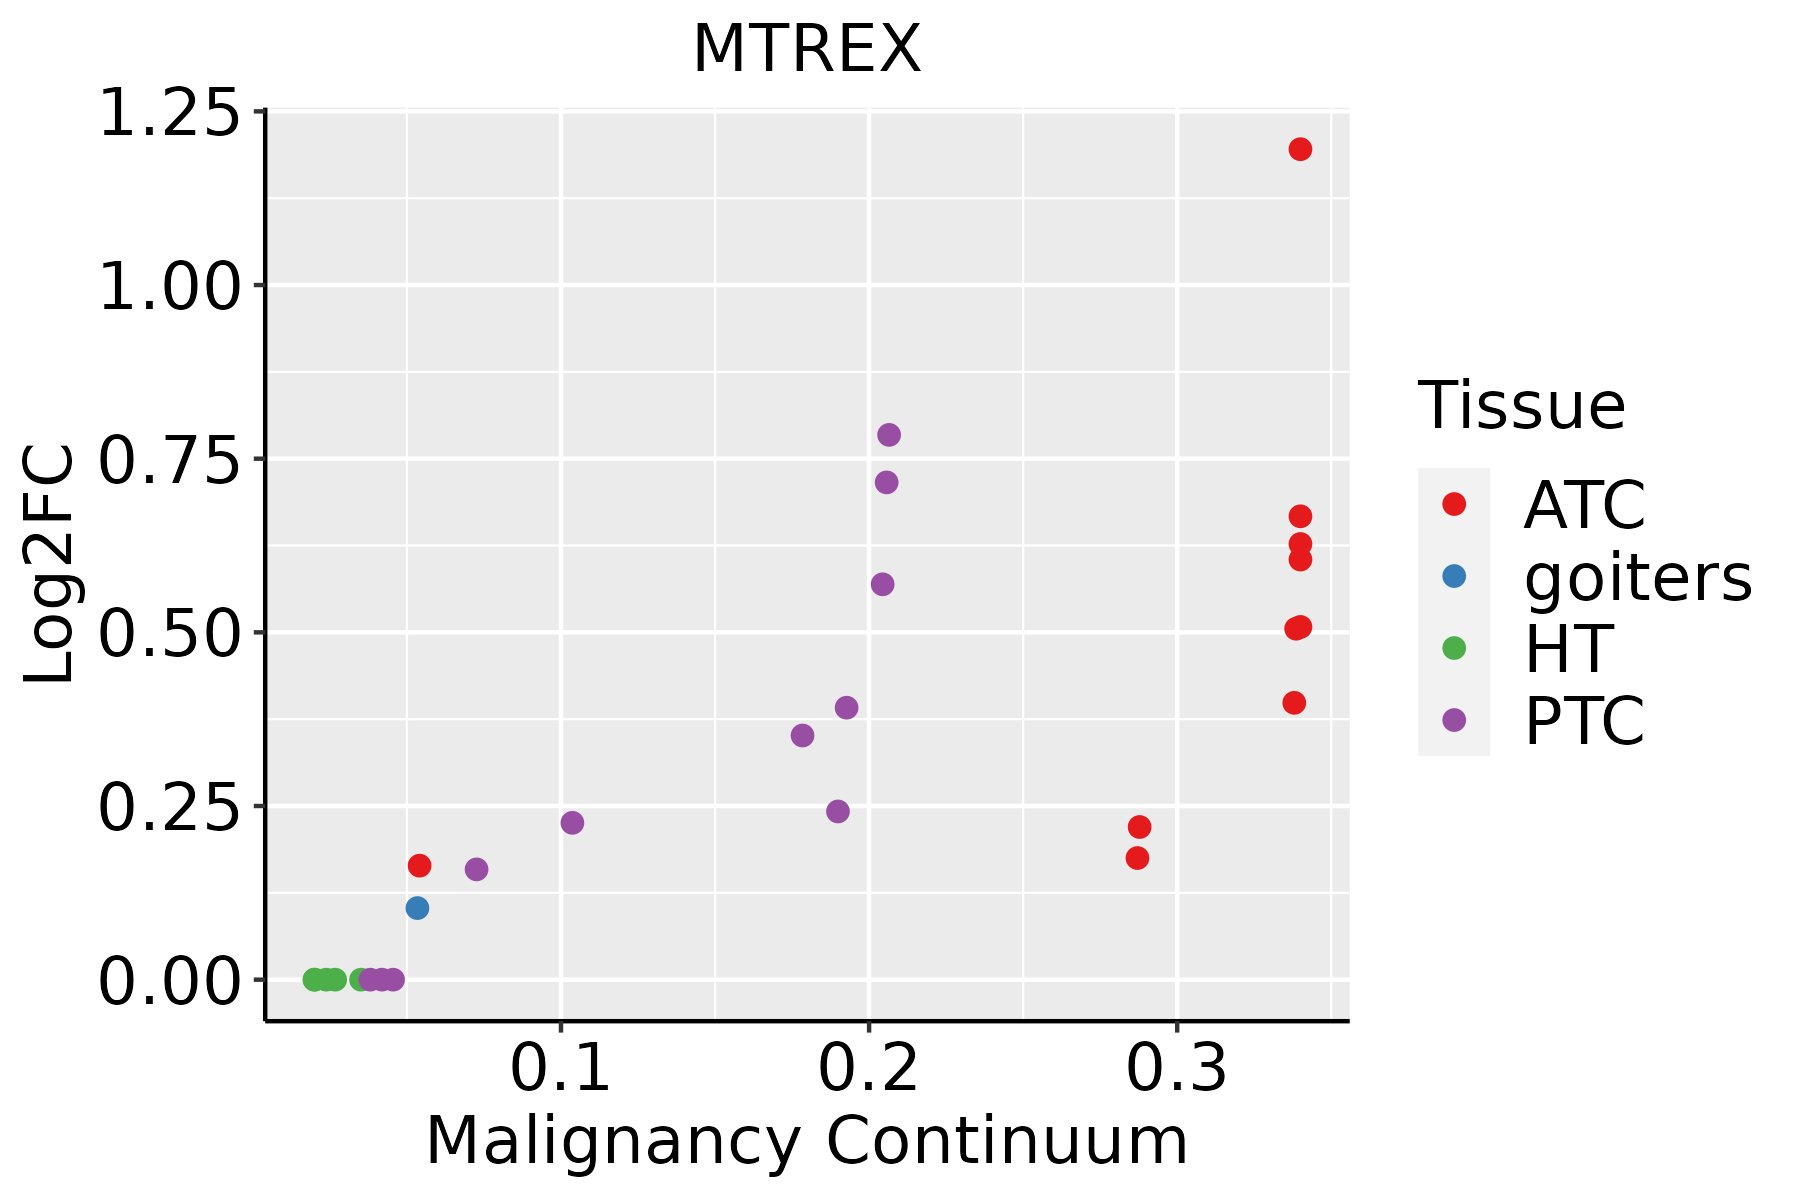 | ATC: Anaplastic thyroid cancer |
| HT: Hashimoto's thyroiditis | ||
| PTC: Papillary thyroid cancer |
| ∗log2FC in expression of this searched gene in stem-like cells from each diseased tissue sample relative to stem-like cells in normal samples in each tissue plotted against the malignancy continuum. Samples are colored based on if they are from different disease stage. |
Top |
Malignant transformation related pathway analysis |
| Find out the enriched GO biological processes and KEGG pathways involved in transition from healthy to precancer to cancer |
| Tissue | Disease Stage | Enriched GO biological Processes |
| Thyroid | PTC |  |
| Thyroid | goiters |  |
| Thyroid | ATC |  |
| ∗Top 15 enriched GO BP terms are showed in the bar plot of each disease state in each tissue. Each row represents a significant GO biological process which is colored according to the -log10(p.adjust). |
| Page: 1 2 3 4 5 6 7 8 9 |
| GO ID | Tissue | Disease Stage | Description | Gene Ratio | Bg Ratio | pvalue | p.adjust | Count |
| GO:0008380 | Colorectum | AD | RNA splicing | 169/3918 | 434/18723 | 3.59e-18 | 2.04e-15 | 169 |
| GO:0000377 | Colorectum | AD | RNA splicing, via transesterification reactions with bulged adenosine as nucleophile | 130/3918 | 320/18723 | 5.88e-16 | 2.16e-13 | 130 |
| GO:0000398 | Colorectum | AD | mRNA splicing, via spliceosome | 130/3918 | 320/18723 | 5.88e-16 | 2.16e-13 | 130 |
| GO:0000375 | Colorectum | AD | RNA splicing, via transesterification reactions | 131/3918 | 324/18723 | 7.11e-16 | 2.22e-13 | 131 |
| GO:0006401 | Colorectum | AD | RNA catabolic process | 102/3918 | 278/18723 | 8.64e-10 | 6.76e-08 | 102 |
| GO:0022613 | Colorectum | AD | ribonucleoprotein complex biogenesis | 151/3918 | 463/18723 | 1.96e-09 | 1.39e-07 | 151 |
| GO:0044270 | Colorectum | AD | cellular nitrogen compound catabolic process | 147/3918 | 451/18723 | 3.35e-09 | 2.23e-07 | 147 |
| GO:0046700 | Colorectum | AD | heterocycle catabolic process | 145/3918 | 445/18723 | 4.37e-09 | 2.84e-07 | 145 |
| GO:0034655 | Colorectum | AD | nucleobase-containing compound catabolic process | 133/3918 | 407/18723 | 1.56e-08 | 9.12e-07 | 133 |
| GO:0019439 | Colorectum | AD | aromatic compound catabolic process | 146/3918 | 467/18723 | 7.48e-08 | 3.84e-06 | 146 |
| GO:1901361 | Colorectum | AD | organic cyclic compound catabolic process | 153/3918 | 495/18723 | 8.23e-08 | 4.18e-06 | 153 |
| GO:0042254 | Colorectum | AD | ribosome biogenesis | 84/3918 | 299/18723 | 1.82e-03 | 1.50e-02 | 84 |
| GO:00083802 | Colorectum | MSS | RNA splicing | 159/3467 | 434/18723 | 1.75e-19 | 1.22e-16 | 159 |
| GO:00003772 | Colorectum | MSS | RNA splicing, via transesterification reactions with bulged adenosine as nucleophile | 121/3467 | 320/18723 | 2.52e-16 | 8.27e-14 | 121 |
| GO:00003982 | Colorectum | MSS | mRNA splicing, via spliceosome | 121/3467 | 320/18723 | 2.52e-16 | 8.27e-14 | 121 |
| GO:00003752 | Colorectum | MSS | RNA splicing, via transesterification reactions | 122/3467 | 324/18723 | 2.75e-16 | 8.58e-14 | 122 |
| GO:00064012 | Colorectum | MSS | RNA catabolic process | 102/3467 | 278/18723 | 5.07e-13 | 1.02e-10 | 102 |
| GO:00226132 | Colorectum | MSS | ribonucleoprotein complex biogenesis | 144/3467 | 463/18723 | 2.76e-11 | 3.67e-09 | 144 |
| GO:00442702 | Colorectum | MSS | cellular nitrogen compound catabolic process | 141/3467 | 451/18723 | 2.95e-11 | 3.83e-09 | 141 |
| GO:00467002 | Colorectum | MSS | heterocycle catabolic process | 139/3467 | 445/18723 | 4.37e-11 | 5.05e-09 | 139 |
| Page: 1 2 3 4 5 6 7 |
| Pathway ID | Tissue | Disease Stage | Description | Gene Ratio | Bg Ratio | pvalue | p.adjust | qvalue | Count |
| hsa03018 | Liver | Cirrhotic | RNA degradation | 44/2530 | 79/8465 | 1.43e-06 | 1.65e-05 | 1.02e-05 | 44 |
| hsa030181 | Liver | Cirrhotic | RNA degradation | 44/2530 | 79/8465 | 1.43e-06 | 1.65e-05 | 1.02e-05 | 44 |
| hsa030182 | Liver | HCC | RNA degradation | 58/4020 | 79/8465 | 2.29e-06 | 2.19e-05 | 1.22e-05 | 58 |
| hsa030183 | Liver | HCC | RNA degradation | 58/4020 | 79/8465 | 2.29e-06 | 2.19e-05 | 1.22e-05 | 58 |
| Page: 1 |
Top |
Cell-cell communication analysis |
| Identification of potential cell-cell interactions between two cell types and their ligand-receptor pairs for different disease states |
| Ligand | Receptor | LRpair | Pathway | Tissue | Disease Stage |
| Page: 1 |
Top |
Single-cell gene regulatory network inference analysis |
| Find out the significant the regulons (TFs) and the target genes of each regulon across cell types for different disease states |
| TF | Cell Type | Tissue | Disease Stage | Target Gene | RSS | Regulon Activity |
| ∗The dot plots of a searched regulon are shown for all cell subpopulations in each disease state of each tissue based on the regulon specific score inferred using pySCENIC and by calculating the average expression. |
| Page: 1 |
Top |
Somatic mutation of malignant transformation related genes |
| Annotation of somatic variants for genes involved in malignant transformation |
| Hugo Symbol | Variant Class | Variant Classification | dbSNP RS | HGVSc | HGVSp | HGVSp Short | SWISSPROT | BIOTYPE | SIFT | PolyPhen | Tumor Sample Barcode | Tissue | Histology | Sex | Age | Stage | Therapy Types | Drugs | Outcome |
| Page: 1 |
Top |
Related drugs of malignant transformation related genes |
| Identification of chemicals and drugs interact with genes involved in malignant transfromation |
| (DGIdb 4.0) |
| Entrez ID | Symbol | Category | Interaction Types | Drug Claim Name | Drug Name | PMIDs |
| Page: 1 |

Copyright 2023-Present -The University of Texas Health Science Center at Houston |