
|
|||||
|
 | |
| |
| |
| |
| |
| |
|
Gene: MTMR12 |
Gene summary for MTMR12 |
| Gene information | Species | Human | Gene symbol | MTMR12 | Gene ID | 54545 |
| Gene name | myotubularin related protein 12 | |
| Gene Alias | 3-PAP | |
| Cytomap | 5p13.3 | |
| Gene Type | protein-coding | GO ID | GO:0006629 | UniProtAcc | Q9C0I1 |
Top |
Malignant transformation analysis |
| Identification of the aberrant gene expression in precancerous and cancerous lesions by comparing the gene expression of stem-like cells in diseased tissues with normal stem cells |
| Entrez ID | Symbol | Replicates | Species | Organ | Tissue | Adj P-value | Log2FC | Malignancy |
| 54545 | MTMR12 | AEH-subject1 | Human | Endometrium | AEH | 4.20e-03 | 2.96e-01 | -0.3059 |
| 54545 | MTMR12 | AEH-subject4 | Human | Endometrium | AEH | 1.57e-12 | 5.63e-01 | -0.2657 |
| 54545 | MTMR12 | AEH-subject5 | Human | Endometrium | AEH | 1.36e-06 | 3.14e-01 | -0.2953 |
| 54545 | MTMR12 | EEC-subject2 | Human | Endometrium | EEC | 4.92e-04 | 2.82e-01 | -0.2607 |
| 54545 | MTMR12 | LZE7T | Human | Esophagus | ESCC | 2.65e-04 | 6.98e-02 | 0.0667 |
| 54545 | MTMR12 | LZE20T | Human | Esophagus | ESCC | 5.01e-05 | 5.00e-02 | 0.0662 |
| 54545 | MTMR12 | LZE22T | Human | Esophagus | ESCC | 1.09e-03 | 1.26e-01 | 0.068 |
| 54545 | MTMR12 | LZE24T | Human | Esophagus | ESCC | 1.24e-09 | 1.14e-01 | 0.0596 |
| 54545 | MTMR12 | P1T-E | Human | Esophagus | ESCC | 1.03e-06 | 2.56e-01 | 0.0875 |
| 54545 | MTMR12 | P2T-E | Human | Esophagus | ESCC | 5.12e-10 | 1.68e-01 | 0.1177 |
| 54545 | MTMR12 | P4T-E | Human | Esophagus | ESCC | 1.34e-11 | 1.66e-01 | 0.1323 |
| 54545 | MTMR12 | P5T-E | Human | Esophagus | ESCC | 3.55e-11 | 1.03e-01 | 0.1327 |
| 54545 | MTMR12 | P8T-E | Human | Esophagus | ESCC | 1.76e-16 | 3.26e-01 | 0.0889 |
| 54545 | MTMR12 | P9T-E | Human | Esophagus | ESCC | 1.53e-06 | 7.00e-02 | 0.1131 |
| 54545 | MTMR12 | P10T-E | Human | Esophagus | ESCC | 3.49e-19 | 3.00e-01 | 0.116 |
| 54545 | MTMR12 | P11T-E | Human | Esophagus | ESCC | 4.81e-03 | 8.21e-02 | 0.1426 |
| 54545 | MTMR12 | P12T-E | Human | Esophagus | ESCC | 1.00e-23 | 2.12e-01 | 0.1122 |
| 54545 | MTMR12 | P15T-E | Human | Esophagus | ESCC | 2.17e-11 | 3.80e-02 | 0.1149 |
| 54545 | MTMR12 | P16T-E | Human | Esophagus | ESCC | 3.00e-25 | 3.75e-01 | 0.1153 |
| 54545 | MTMR12 | P17T-E | Human | Esophagus | ESCC | 1.27e-05 | 1.13e-01 | 0.1278 |
| Page: 1 2 3 4 5 |
| Tissue | Expression Dynamics | Abbreviation |
| Endometrium | 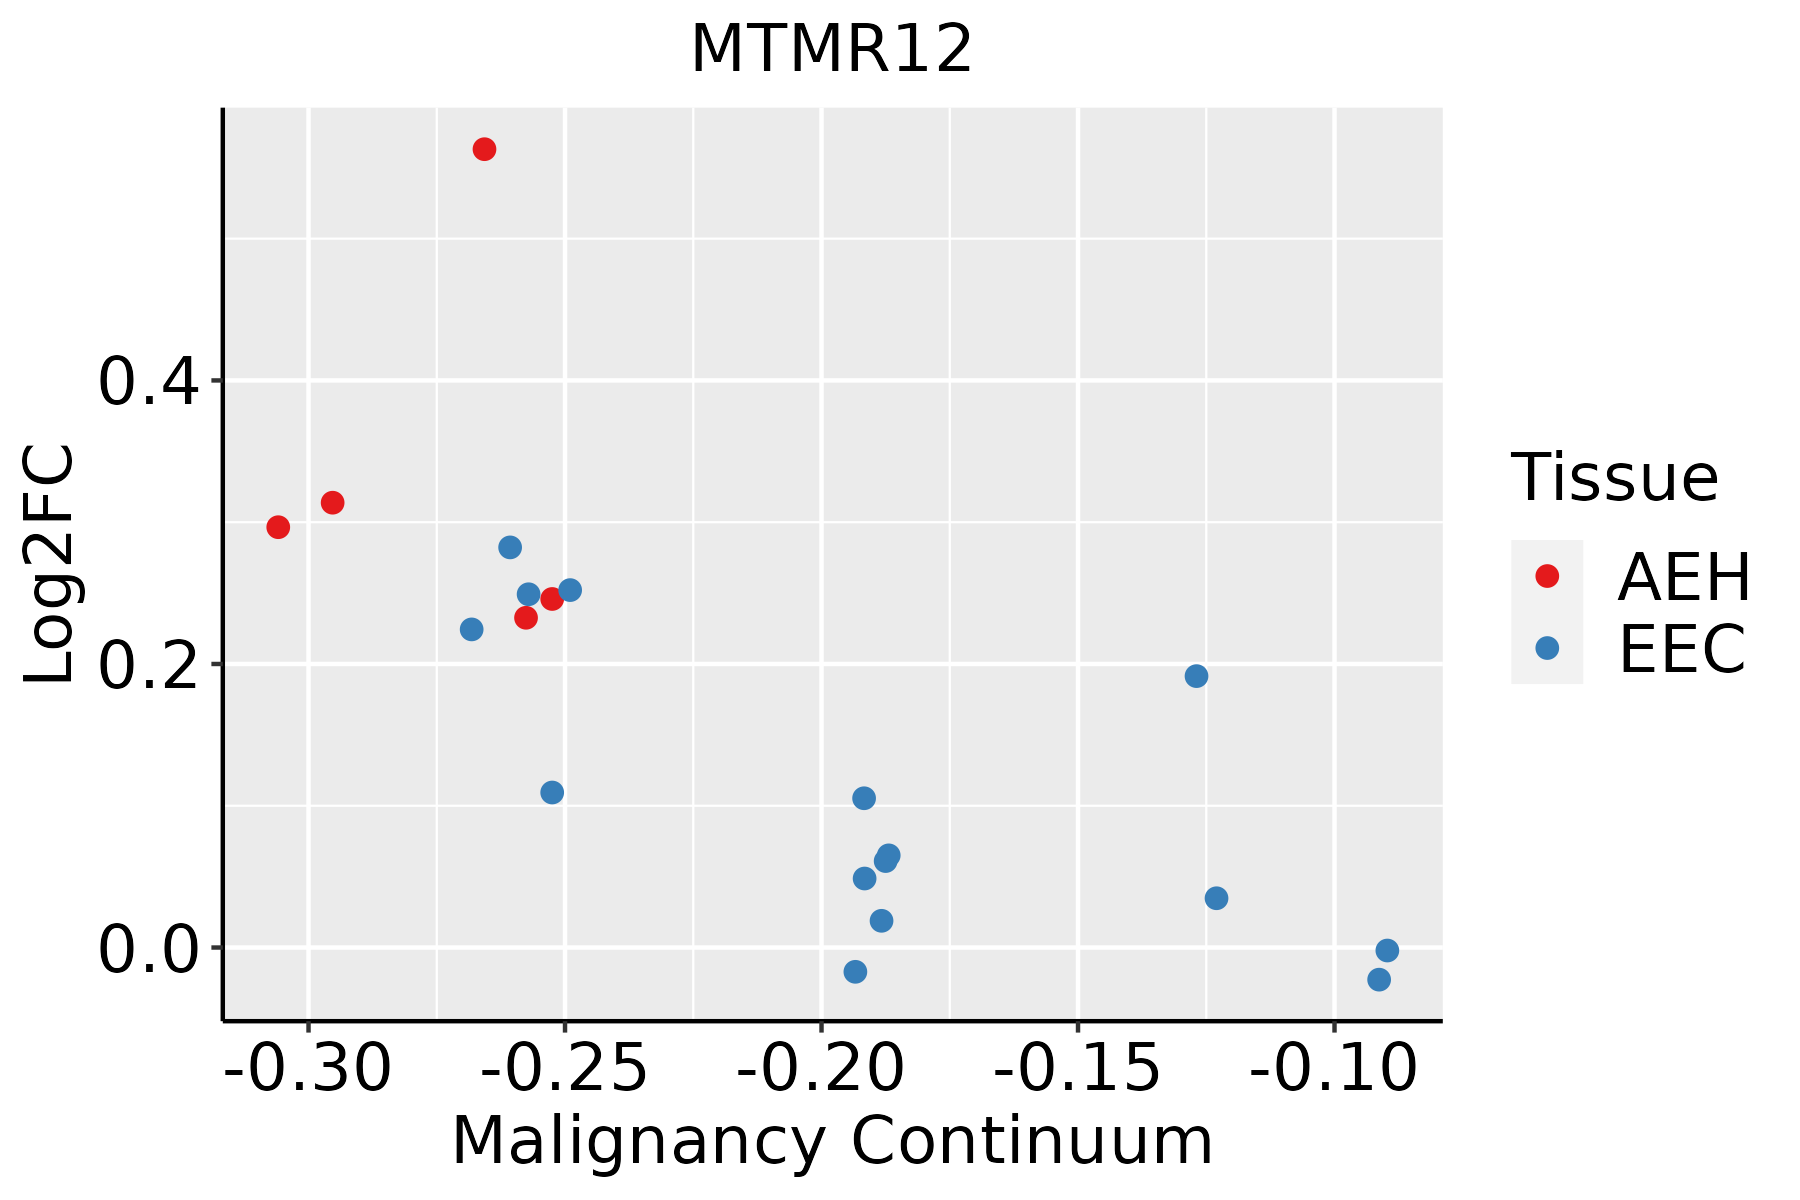 | AEH: Atypical endometrial hyperplasia |
| EEC: Endometrioid Cancer | ||
| Esophagus |  | ESCC: Esophageal squamous cell carcinoma |
| HGIN: High-grade intraepithelial neoplasias | ||
| LGIN: Low-grade intraepithelial neoplasias | ||
| Liver |  | HCC: Hepatocellular carcinoma |
| NAFLD: Non-alcoholic fatty liver disease | ||
| Thyroid | 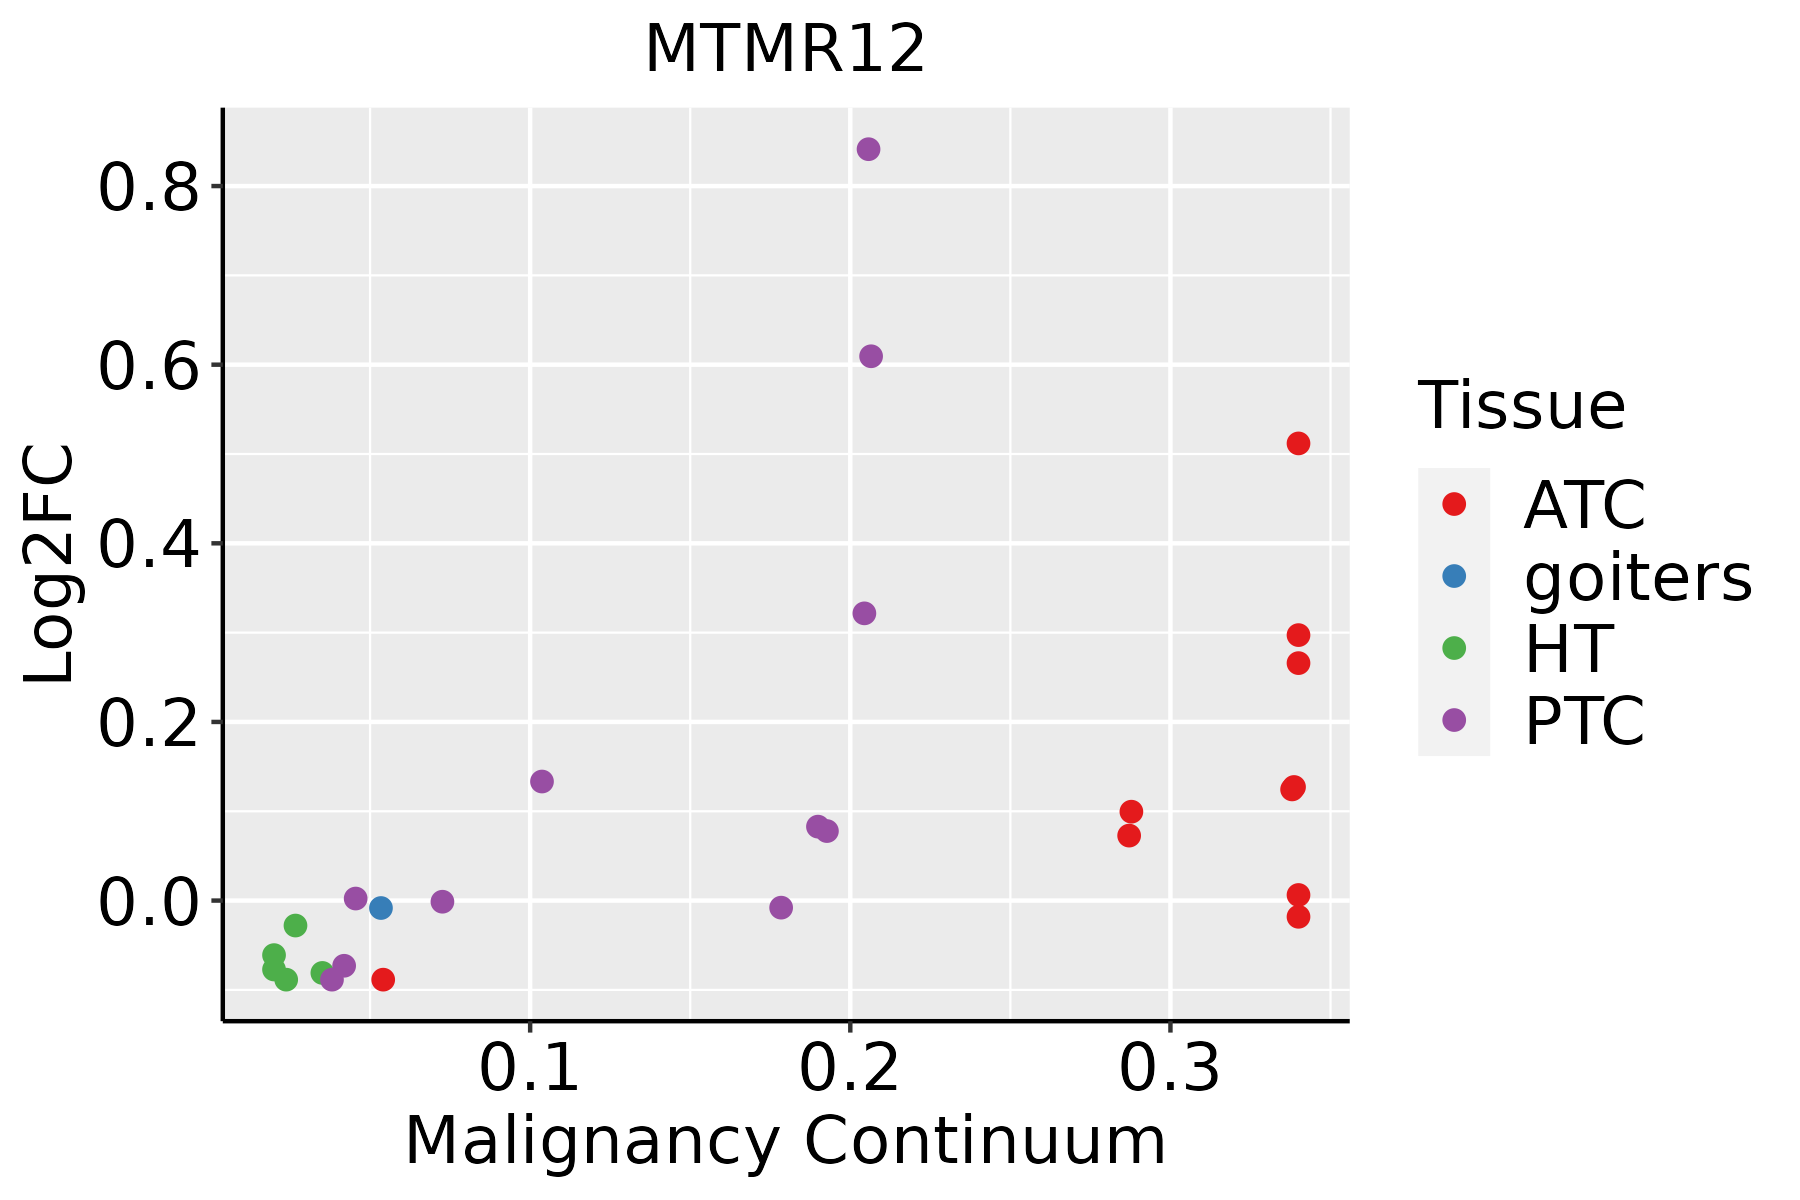 | ATC: Anaplastic thyroid cancer |
| HT: Hashimoto's thyroiditis | ||
| PTC: Papillary thyroid cancer |
| ∗log2FC in expression of this searched gene in stem-like cells from each diseased tissue sample relative to stem-like cells in normal samples in each tissue plotted against the malignancy continuum. Samples are colored based on if they are from different disease stage. |
Top |
Malignant transformation related pathway analysis |
| Find out the enriched GO biological processes and KEGG pathways involved in transition from healthy to precancer to cancer |
| Tissue | Disease Stage | Enriched GO biological Processes |
| Thyroid | PTC |  |
| Thyroid | goiters |  |
| Thyroid | ATC |  |
| ∗Top 15 enriched GO BP terms are showed in the bar plot of each disease state in each tissue. Each row represents a significant GO biological process which is colored according to the -log10(p.adjust). |
| Page: 1 2 3 4 5 6 7 8 9 |
| GO ID | Tissue | Disease Stage | Description | Gene Ratio | Bg Ratio | pvalue | p.adjust | Count |
| GO:19019984 | Endometrium | EEC | toxin transport | 11/2168 | 40/18723 | 4.65e-03 | 2.97e-02 | 11 |
| GO:001631110 | Esophagus | ESCC | dephosphorylation | 251/8552 | 417/18723 | 1.26e-09 | 2.99e-08 | 251 |
| GO:00066446 | Esophagus | ESCC | phospholipid metabolic process | 218/8552 | 383/18723 | 5.37e-06 | 5.59e-05 | 218 |
| GO:00066505 | Esophagus | ESCC | glycerophospholipid metabolic process | 174/8552 | 306/18723 | 4.92e-05 | 3.85e-04 | 174 |
| GO:00464864 | Esophagus | ESCC | glycerolipid metabolic process | 211/8552 | 392/18723 | 6.51e-04 | 3.46e-03 | 211 |
| GO:19019987 | Esophagus | ESCC | toxin transport | 28/8552 | 40/18723 | 1.61e-03 | 7.50e-03 | 28 |
| GO:00302586 | Esophagus | ESCC | lipid modification | 116/8552 | 212/18723 | 4.90e-03 | 1.89e-02 | 116 |
| GO:00302585 | Liver | NAFLD | lipid modification | 49/1882 | 212/18723 | 1.97e-08 | 2.17e-06 | 49 |
| GO:00464863 | Liver | NAFLD | glycerolipid metabolic process | 66/1882 | 392/18723 | 1.94e-05 | 5.52e-04 | 66 |
| GO:00163115 | Liver | NAFLD | dephosphorylation | 69/1882 | 417/18723 | 2.27e-05 | 6.23e-04 | 69 |
| GO:00066444 | Liver | HCC | phospholipid metabolic process | 214/7958 | 383/18723 | 7.25e-08 | 1.48e-06 | 214 |
| GO:001631121 | Liver | HCC | dephosphorylation | 230/7958 | 417/18723 | 1.00e-07 | 1.96e-06 | 230 |
| GO:004648611 | Liver | HCC | glycerolipid metabolic process | 215/7958 | 392/18723 | 4.54e-07 | 7.49e-06 | 215 |
| GO:003025821 | Liver | HCC | lipid modification | 123/7958 | 212/18723 | 3.50e-06 | 4.58e-05 | 123 |
| GO:00066504 | Liver | HCC | glycerophospholipid metabolic process | 168/7958 | 306/18723 | 7.27e-06 | 8.62e-05 | 168 |
| GO:001631116 | Thyroid | PTC | dephosphorylation | 174/5968 | 417/18723 | 1.20e-05 | 1.31e-04 | 174 |
| GO:19019989 | Thyroid | PTC | toxin transport | 21/5968 | 40/18723 | 5.37e-03 | 2.47e-02 | 21 |
| GO:001631117 | Thyroid | ATC | dephosphorylation | 179/6293 | 417/18723 | 3.88e-05 | 3.15e-04 | 179 |
| GO:190199813 | Thyroid | ATC | toxin transport | 25/6293 | 40/18723 | 1.72e-04 | 1.17e-03 | 25 |
| Page: 1 |
| Pathway ID | Tissue | Disease Stage | Description | Gene Ratio | Bg Ratio | pvalue | p.adjust | qvalue | Count |
| Page: 1 |
Top |
Cell-cell communication analysis |
| Identification of potential cell-cell interactions between two cell types and their ligand-receptor pairs for different disease states |
| Ligand | Receptor | LRpair | Pathway | Tissue | Disease Stage |
| Page: 1 |
Top |
Single-cell gene regulatory network inference analysis |
| Find out the significant the regulons (TFs) and the target genes of each regulon across cell types for different disease states |
| TF | Cell Type | Tissue | Disease Stage | Target Gene | RSS | Regulon Activity |
| ∗The dot plots of a searched regulon are shown for all cell subpopulations in each disease state of each tissue based on the regulon specific score inferred using pySCENIC and by calculating the average expression. |
| Page: 1 |
Top |
Somatic mutation of malignant transformation related genes |
| Annotation of somatic variants for genes involved in malignant transformation |
| Hugo Symbol | Variant Class | Variant Classification | dbSNP RS | HGVSc | HGVSp | HGVSp Short | SWISSPROT | BIOTYPE | SIFT | PolyPhen | Tumor Sample Barcode | Tissue | Histology | Sex | Age | Stage | Therapy Types | Drugs | Outcome |
| MTMR12 | SNV | Missense_Mutation | c.1580N>C | p.Gln527Pro | p.Q527P | Q9C0I1 | protein_coding | deleterious(0) | probably_damaging(0.986) | TCGA-A8-A07G-01 | Breast | breast invasive carcinoma | Female | >=65 | I/II | Chemotherapy | 5-fluorouracil | CR | |
| MTMR12 | SNV | Missense_Mutation | novel | c.1562N>G | p.Val521Gly | p.V521G | Q9C0I1 | protein_coding | deleterious(0) | possibly_damaging(0.796) | TCGA-D8-A142-01 | Breast | breast invasive carcinoma | Female | >=65 | I/II | Chemotherapy | cyclophosphamid | SD |
| MTMR12 | SNV | Missense_Mutation | c.1559N>G | p.Thr520Ser | p.T520S | Q9C0I1 | protein_coding | tolerated(0.83) | benign(0.01) | TCGA-E2-A14R-01 | Breast | breast invasive carcinoma | Female | <65 | I/II | Chemotherapy | doxorubicin | PD | |
| MTMR12 | SNV | Missense_Mutation | rs143619846 | c.1487N>T | p.Ser496Leu | p.S496L | Q9C0I1 | protein_coding | deleterious(0) | probably_damaging(0.991) | TCGA-GM-A2D9-01 | Breast | breast invasive carcinoma | Female | >=65 | I/II | Hormone Therapy | arimidex | SD |
| MTMR12 | insertion | Frame_Shift_Ins | novel | c.1919_1920insATTTTTTTCTTTCTACGCCCCCTTGCCTGTAAAACACCTGGGAA | p.Gln641PhefsTer28 | p.Q641Ffs*28 | Q9C0I1 | protein_coding | TCGA-A8-A06Z-01 | Breast | breast invasive carcinoma | Female | >=65 | I/II | Unknown | Unknown | SD | ||
| MTMR12 | deletion | In_Frame_Del | c.170_172delCAG | p.Thr57_Val58delinsIle | p.T57_V58delinsI | Q9C0I1 | protein_coding | TCGA-AN-A04D-01 | Breast | breast invasive carcinoma | Female | <65 | I/II | Unknown | Unknown | SD | |||
| MTMR12 | SNV | Missense_Mutation | c.1781N>T | p.Arg594Ile | p.R594I | Q9C0I1 | protein_coding | deleterious(0.01) | probably_damaging(0.999) | TCGA-AA-3510-01 | Colorectum | colon adenocarcinoma | Male | >=65 | I/II | Unknown | Unknown | SD | |
| MTMR12 | SNV | Missense_Mutation | c.1480N>G | p.Phe494Val | p.F494V | Q9C0I1 | protein_coding | deleterious(0) | probably_damaging(0.991) | TCGA-AA-3844-01 | Colorectum | colon adenocarcinoma | Female | >=65 | III/IV | Chemotherapy | capecitabine | PD | |
| MTMR12 | SNV | Missense_Mutation | c.907N>G | p.Thr303Ala | p.T303A | Q9C0I1 | protein_coding | tolerated(0.4) | benign(0.003) | TCGA-AA-3982-01 | Colorectum | colon adenocarcinoma | Male | >=65 | III/IV | Unknown | Unknown | SD | |
| MTMR12 | SNV | Missense_Mutation | c.539N>A | p.Arg180Gln | p.R180Q | Q9C0I1 | protein_coding | tolerated(0.21) | probably_damaging(0.92) | TCGA-AA-A010-01 | Colorectum | colon adenocarcinoma | Female | <65 | I/II | Chemotherapy | folinic | CR |
| Page: 1 2 3 4 5 6 7 8 9 |
Top |
Related drugs of malignant transformation related genes |
| Identification of chemicals and drugs interact with genes involved in malignant transfromation |
| (DGIdb 4.0) |
| Entrez ID | Symbol | Category | Interaction Types | Drug Claim Name | Drug Name | PMIDs |
| Page: 1 |

Copyright 2023-Present -The University of Texas Health Science Center at Houston |