
|
|||||
|
 | |
| |
| |
| |
| |
| |
|
Gene: IRS1 |
Gene summary for IRS1 |
| Gene information | Species | Human | Gene symbol | IRS1 | Gene ID | 3667 |
| Gene name | insulin receptor substrate 1 | |
| Gene Alias | HIRS-1 | |
| Cytomap | 2q36.3 | |
| Gene Type | protein-coding | GO ID | GO:0000271 | UniProtAcc | A0A024R499 |
Top |
Malignant transformation analysis |
| Identification of the aberrant gene expression in precancerous and cancerous lesions by comparing the gene expression of stem-like cells in diseased tissues with normal stem cells |
| Entrez ID | Symbol | Replicates | Species | Organ | Tissue | Adj P-value | Log2FC | Malignancy |
| 3667 | IRS1 | HCC1_Meng | Human | Liver | HCC | 8.93e-26 | -6.63e-02 | 0.0246 |
| 3667 | IRS1 | HCC2_Meng | Human | Liver | HCC | 6.51e-10 | -1.78e-02 | 0.0107 |
| 3667 | IRS1 | HCC1 | Human | Liver | HCC | 4.43e-06 | 3.92e+00 | 0.5336 |
| 3667 | IRS1 | HCC2 | Human | Liver | HCC | 2.07e-07 | 2.22e+00 | 0.5341 |
| 3667 | IRS1 | Pt13.a | Human | Liver | HCC | 4.06e-02 | -1.35e-01 | 0.021 |
| 3667 | IRS1 | S014 | Human | Liver | HCC | 1.78e-06 | 3.55e-01 | 0.2254 |
| 3667 | IRS1 | S015 | Human | Liver | HCC | 3.62e-04 | 3.35e-01 | 0.2375 |
| 3667 | IRS1 | C04 | Human | Oral cavity | OSCC | 1.84e-09 | 6.95e-01 | 0.2633 |
| 3667 | IRS1 | C21 | Human | Oral cavity | OSCC | 8.01e-09 | 5.00e-01 | 0.2678 |
| 3667 | IRS1 | C30 | Human | Oral cavity | OSCC | 1.10e-37 | 1.63e+00 | 0.3055 |
| 3667 | IRS1 | C51 | Human | Oral cavity | OSCC | 2.33e-02 | 3.48e-01 | 0.2674 |
| 3667 | IRS1 | C06 | Human | Oral cavity | OSCC | 1.77e-06 | 1.23e+00 | 0.2699 |
| 3667 | IRS1 | SYSMH1 | Human | Oral cavity | OSCC | 1.84e-02 | 1.57e-01 | 0.1127 |
| 3667 | IRS1 | SYSMH2 | Human | Oral cavity | OSCC | 1.20e-08 | 3.67e-01 | 0.2326 |
| 3667 | IRS1 | SYSMH3 | Human | Oral cavity | OSCC | 1.42e-40 | 1.06e+00 | 0.2442 |
| 3667 | IRS1 | SYSMH5 | Human | Oral cavity | OSCC | 7.19e-15 | 4.51e-01 | 0.0647 |
| 3667 | IRS1 | PTCwithHT_6 | Human | Thyroid | HT | 5.95e-07 | -2.97e-01 | 0.02 |
| 3667 | IRS1 | PTCwithHT_8 | Human | Thyroid | HT | 1.47e-02 | -2.58e-01 | 0.0351 |
| 3667 | IRS1 | male-WTA | Human | Thyroid | PTC | 6.69e-15 | -1.12e-01 | 0.1037 |
| 3667 | IRS1 | PTC01 | Human | Thyroid | PTC | 2.53e-08 | -3.56e-02 | 0.1899 |
| Page: 1 2 |
| Tissue | Expression Dynamics | Abbreviation |
| Liver | 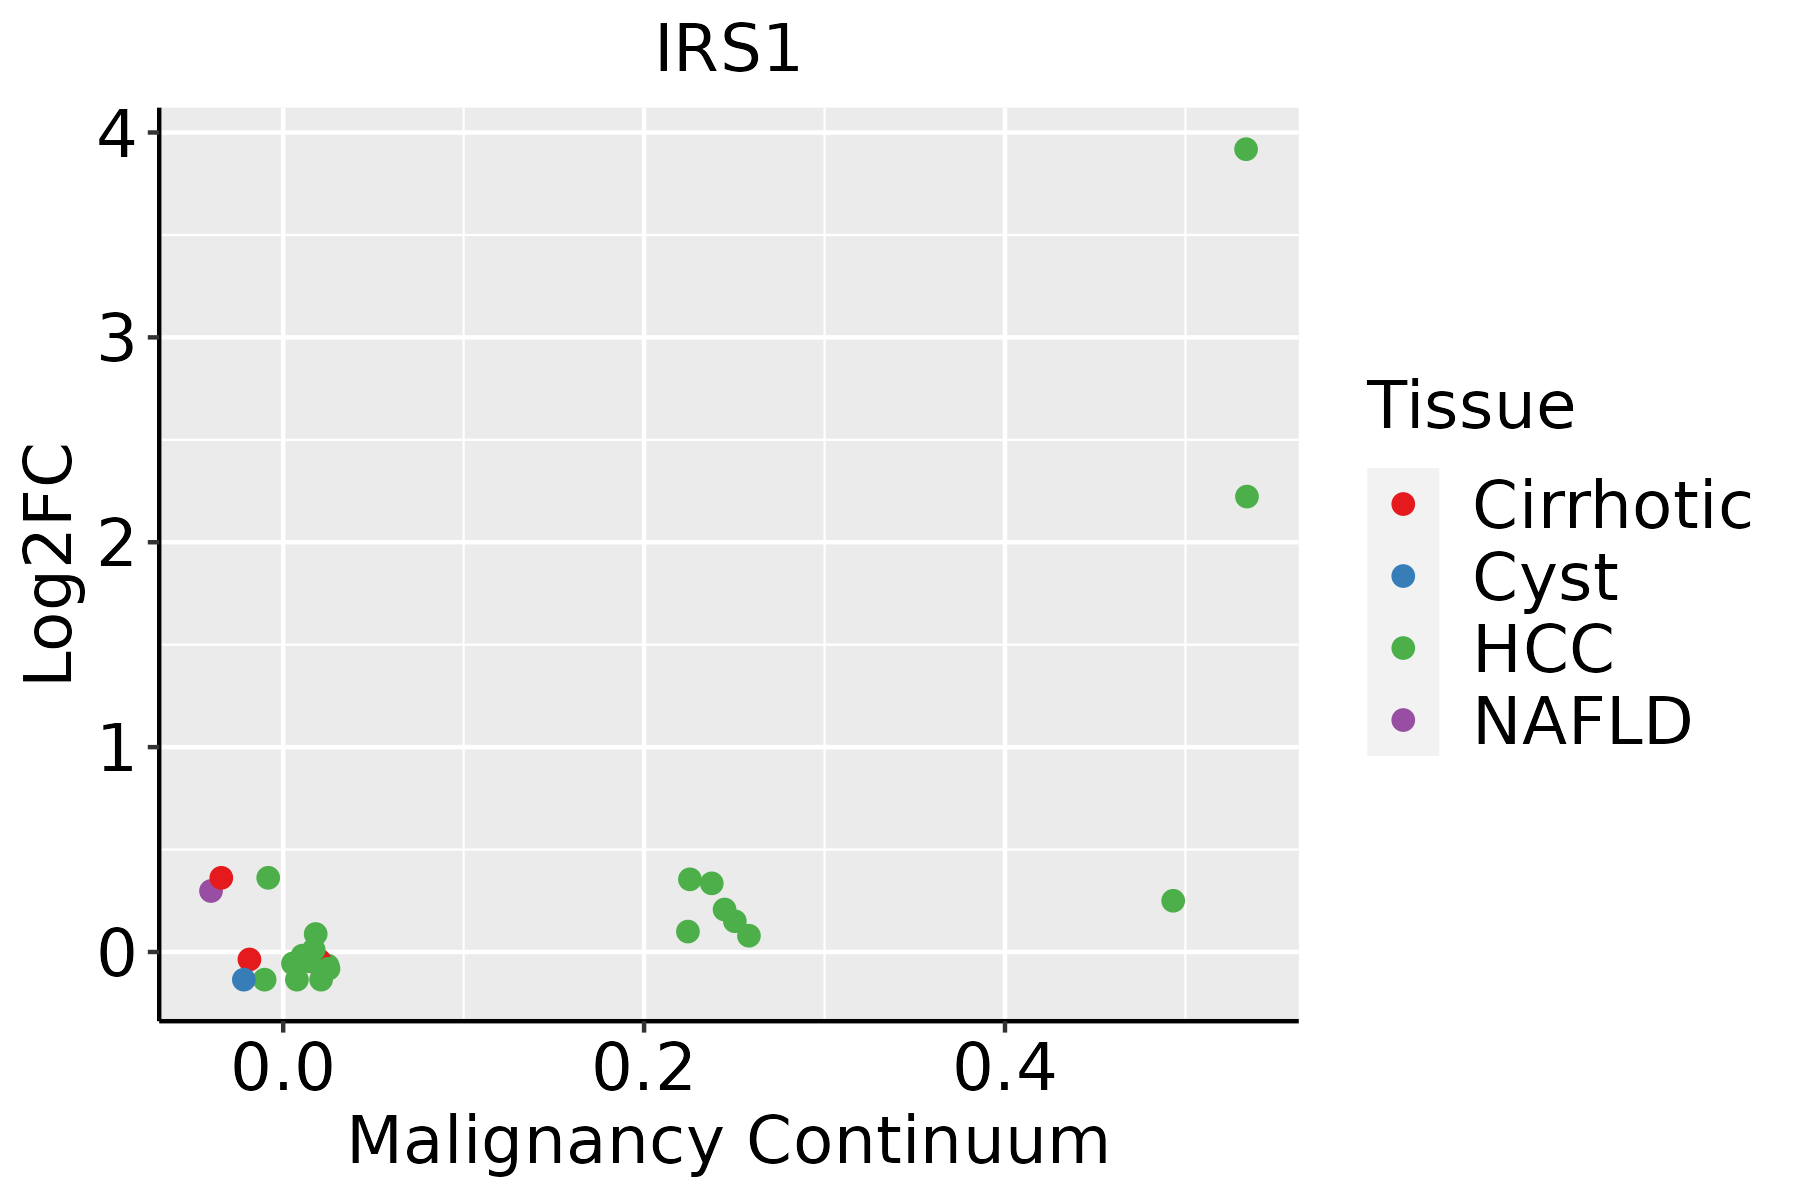 | HCC: Hepatocellular carcinoma |
| NAFLD: Non-alcoholic fatty liver disease | ||
| Oral Cavity |  | EOLP: Erosive Oral lichen planus |
| LP: leukoplakia | ||
| NEOLP: Non-erosive oral lichen planus | ||
| OSCC: Oral squamous cell carcinoma | ||
| Thyroid | 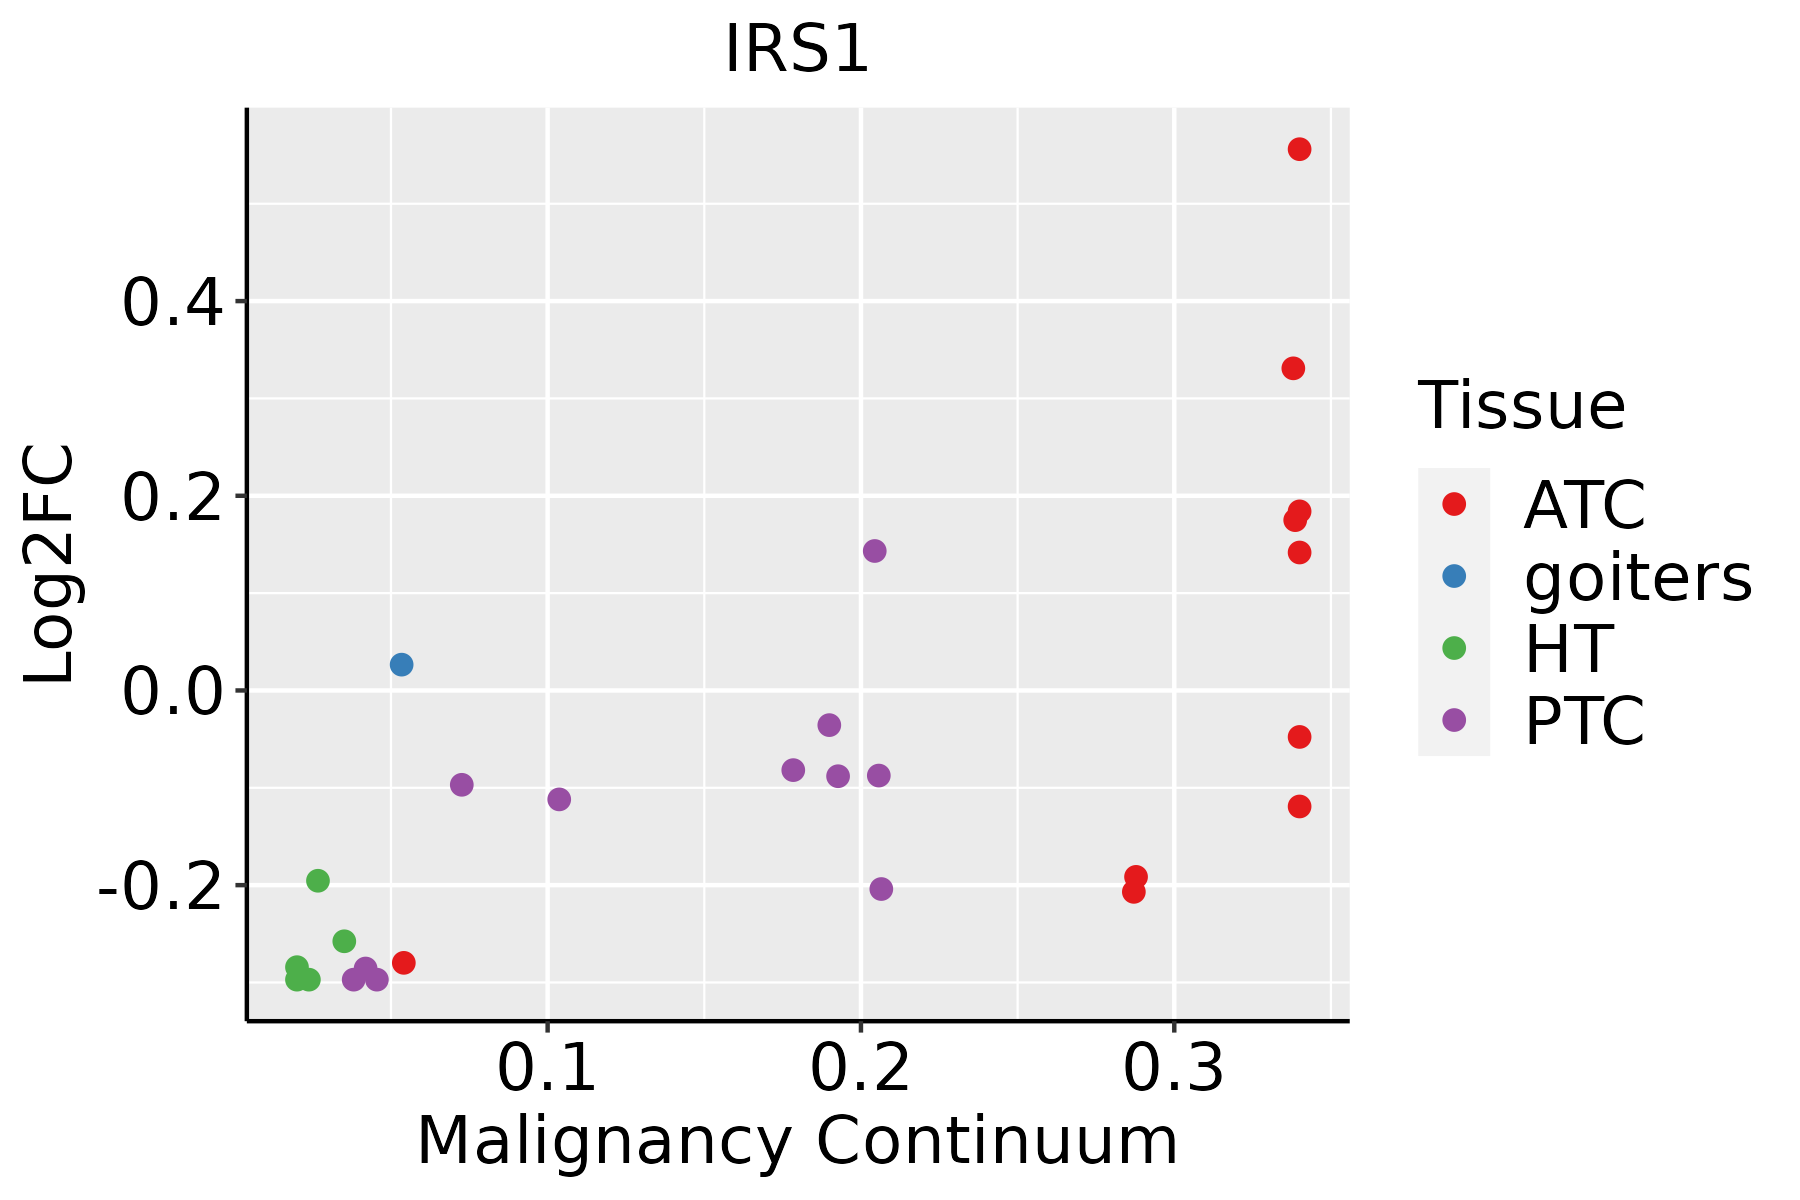 | ATC: Anaplastic thyroid cancer |
| HT: Hashimoto's thyroiditis | ||
| PTC: Papillary thyroid cancer |
| ∗log2FC in expression of this searched gene in stem-like cells from each diseased tissue sample relative to stem-like cells in normal samples in each tissue plotted against the malignancy continuum. Samples are colored based on if they are from different disease stage. |
Top |
Malignant transformation related pathway analysis |
| Find out the enriched GO biological processes and KEGG pathways involved in transition from healthy to precancer to cancer |
| Tissue | Disease Stage | Enriched GO biological Processes |
| Thyroid | PTC |  |
| Thyroid | goiters |  |
| Thyroid | ATC |  |
| ∗Top 15 enriched GO BP terms are showed in the bar plot of each disease state in each tissue. Each row represents a significant GO biological process which is colored according to the -log10(p.adjust). |
| Page: 1 2 3 4 5 6 7 8 9 |
| GO ID | Tissue | Disease Stage | Description | Gene Ratio | Bg Ratio | pvalue | p.adjust | Count |
| GO:000609122 | Liver | HCC | generation of precursor metabolites and energy | 340/7958 | 490/18723 | 4.04e-34 | 2.85e-31 | 340 |
| GO:000989622 | Liver | HCC | positive regulation of catabolic process | 335/7958 | 492/18723 | 3.83e-31 | 1.87e-28 | 335 |
| GO:003133122 | Liver | HCC | positive regulation of cellular catabolic process | 295/7958 | 427/18723 | 3.20e-29 | 1.45e-26 | 295 |
| GO:001598022 | Liver | HCC | energy derivation by oxidation of organic compounds | 221/7958 | 318/18723 | 1.02e-22 | 1.86e-20 | 221 |
| GO:003286821 | Liver | HCC | response to insulin | 172/7958 | 264/18723 | 7.14e-14 | 4.23e-12 | 172 |
| GO:000663122 | Liver | HCC | fatty acid metabolic process | 238/7958 | 390/18723 | 8.24e-14 | 4.84e-12 | 238 |
| GO:000599621 | Liver | HCC | monosaccharide metabolic process | 167/7958 | 257/18723 | 2.31e-13 | 1.25e-11 | 167 |
| GO:003286921 | Liver | HCC | cellular response to insulin stimulus | 137/7958 | 203/18723 | 4.69e-13 | 2.44e-11 | 137 |
| GO:001931821 | Liver | HCC | hexose metabolic process | 155/7958 | 237/18723 | 7.63e-13 | 3.90e-11 | 155 |
| GO:004343422 | Liver | HCC | response to peptide hormone | 247/7958 | 414/18723 | 9.55e-13 | 4.77e-11 | 247 |
| GO:004428221 | Liver | HCC | small molecule catabolic process | 225/7958 | 376/18723 | 6.50e-12 | 2.80e-10 | 225 |
| GO:007137521 | Liver | HCC | cellular response to peptide hormone stimulus | 179/7958 | 290/18723 | 2.54e-11 | 9.88e-10 | 179 |
| GO:001605421 | Liver | HCC | organic acid catabolic process | 152/7958 | 240/18723 | 5.11e-11 | 1.92e-09 | 152 |
| GO:000600621 | Liver | HCC | glucose metabolic process | 128/7958 | 196/18723 | 8.60e-11 | 3.06e-09 | 128 |
| GO:00463952 | Liver | HCC | carboxylic acid catabolic process | 149/7958 | 236/18723 | 1.11e-10 | 3.87e-09 | 149 |
| GO:190165321 | Liver | HCC | cellular response to peptide | 211/7958 | 359/18723 | 2.86e-10 | 9.63e-09 | 211 |
| GO:004346722 | Liver | HCC | regulation of generation of precursor metabolites and energy | 89/7958 | 130/18723 | 1.84e-09 | 5.35e-08 | 89 |
| GO:004424222 | Liver | HCC | cellular lipid catabolic process | 134/7958 | 214/18723 | 2.07e-09 | 5.79e-08 | 134 |
| GO:001939522 | Liver | HCC | fatty acid oxidation | 72/7958 | 103/18723 | 1.63e-08 | 3.92e-07 | 72 |
| GO:000906221 | Liver | HCC | fatty acid catabolic process | 70/7958 | 100/18723 | 2.34e-08 | 5.44e-07 | 70 |
| Page: 1 2 3 4 5 6 7 8 9 |
| Pathway ID | Tissue | Disease Stage | Description | Gene Ratio | Bg Ratio | pvalue | p.adjust | qvalue | Count |
| hsa0493242 | Liver | HCC | Non-alcoholic fatty liver disease | 124/4020 | 155/8465 | 4.54e-17 | 2.54e-15 | 1.41e-15 | 124 |
| hsa0541522 | Liver | HCC | Diabetic cardiomyopathy | 151/4020 | 203/8465 | 2.72e-15 | 1.01e-13 | 5.63e-14 | 151 |
| hsa0501022 | Liver | HCC | Alzheimer disease | 254/4020 | 384/8465 | 3.75e-14 | 8.97e-13 | 4.99e-13 | 254 |
| hsa0414021 | Liver | HCC | Autophagy - animal | 99/4020 | 141/8465 | 3.08e-08 | 4.70e-07 | 2.61e-07 | 99 |
| hsa0491041 | Liver | HCC | Insulin signaling pathway | 95/4020 | 137/8465 | 1.53e-07 | 1.97e-06 | 1.10e-06 | 95 |
| hsa0493121 | Liver | HCC | Insulin resistance | 77/4020 | 108/8465 | 3.89e-07 | 4.46e-06 | 2.48e-06 | 77 |
| hsa040684 | Liver | HCC | FoxO signaling pathway | 85/4020 | 131/8465 | 3.99e-05 | 2.16e-04 | 1.20e-04 | 85 |
| hsa0421121 | Liver | HCC | Longevity regulating pathway | 61/4020 | 89/8465 | 4.46e-05 | 2.37e-04 | 1.32e-04 | 61 |
| hsa0415241 | Liver | HCC | AMPK signaling pathway | 77/4020 | 121/8465 | 2.32e-04 | 1.11e-03 | 6.18e-04 | 77 |
| hsa041502 | Liver | HCC | mTOR signaling pathway | 95/4020 | 156/8465 | 4.70e-04 | 1.99e-03 | 1.11e-03 | 95 |
| hsa0472210 | Liver | HCC | Neurotrophin signaling pathway | 74/4020 | 119/8465 | 8.27e-04 | 3.26e-03 | 1.81e-03 | 74 |
| hsa049202 | Liver | HCC | Adipocytokine signaling pathway | 45/4020 | 69/8465 | 2.19e-03 | 7.55e-03 | 4.20e-03 | 45 |
| hsa042138 | Liver | HCC | Longevity regulating pathway - multiple species | 41/4020 | 62/8465 | 2.30e-03 | 7.86e-03 | 4.37e-03 | 41 |
| hsa0493252 | Liver | HCC | Non-alcoholic fatty liver disease | 124/4020 | 155/8465 | 4.54e-17 | 2.54e-15 | 1.41e-15 | 124 |
| hsa0541532 | Liver | HCC | Diabetic cardiomyopathy | 151/4020 | 203/8465 | 2.72e-15 | 1.01e-13 | 5.63e-14 | 151 |
| hsa0501032 | Liver | HCC | Alzheimer disease | 254/4020 | 384/8465 | 3.75e-14 | 8.97e-13 | 4.99e-13 | 254 |
| hsa0414031 | Liver | HCC | Autophagy - animal | 99/4020 | 141/8465 | 3.08e-08 | 4.70e-07 | 2.61e-07 | 99 |
| hsa0491051 | Liver | HCC | Insulin signaling pathway | 95/4020 | 137/8465 | 1.53e-07 | 1.97e-06 | 1.10e-06 | 95 |
| hsa0493131 | Liver | HCC | Insulin resistance | 77/4020 | 108/8465 | 3.89e-07 | 4.46e-06 | 2.48e-06 | 77 |
| hsa040685 | Liver | HCC | FoxO signaling pathway | 85/4020 | 131/8465 | 3.99e-05 | 2.16e-04 | 1.20e-04 | 85 |
| Page: 1 2 3 |
Top |
Cell-cell communication analysis |
| Identification of potential cell-cell interactions between two cell types and their ligand-receptor pairs for different disease states |
| Ligand | Receptor | LRpair | Pathway | Tissue | Disease Stage |
| Page: 1 |
Top |
Single-cell gene regulatory network inference analysis |
| Find out the significant the regulons (TFs) and the target genes of each regulon across cell types for different disease states |
| TF | Cell Type | Tissue | Disease Stage | Target Gene | RSS | Regulon Activity |
| ∗The dot plots of a searched regulon are shown for all cell subpopulations in each disease state of each tissue based on the regulon specific score inferred using pySCENIC and by calculating the average expression. |
| Page: 1 |
Top |
Somatic mutation of malignant transformation related genes |
| Annotation of somatic variants for genes involved in malignant transformation |
| Hugo Symbol | Variant Class | Variant Classification | dbSNP RS | HGVSc | HGVSp | HGVSp Short | SWISSPROT | BIOTYPE | SIFT | PolyPhen | Tumor Sample Barcode | Tissue | Histology | Sex | Age | Stage | Therapy Types | Drugs | Outcome |
| IRS1 | SNV | Missense_Mutation | novel | c.3176N>C | p.Leu1059Pro | p.L1059P | P35568 | protein_coding | deleterious(0.01) | possibly_damaging(0.687) | TCGA-A8-A06O-01 | Breast | breast invasive carcinoma | Female | <65 | I/II | Hormone Therapy | letrozole | SD |
| IRS1 | SNV | Missense_Mutation | c.787N>A | p.Glu263Lys | p.E263K | P35568 | protein_coding | deleterious(0) | probably_damaging(0.994) | TCGA-AC-A23H-01 | Breast | breast invasive carcinoma | Female | >=65 | I/II | Unknown | Unknown | PD | |
| IRS1 | SNV | Missense_Mutation | c.285N>G | p.Ile95Met | p.I95M | P35568 | protein_coding | deleterious(0) | probably_damaging(0.988) | TCGA-AC-A23H-01 | Breast | breast invasive carcinoma | Female | >=65 | I/II | Unknown | Unknown | PD | |
| IRS1 | SNV | Missense_Mutation | c.292N>A | p.Asp98Asn | p.D98N | P35568 | protein_coding | deleterious(0) | probably_damaging(0.918) | TCGA-AN-A0FJ-01 | Breast | breast invasive carcinoma | Female | <65 | III/IV | Unknown | Unknown | SD | |
| IRS1 | SNV | Missense_Mutation | novel | c.364N>T | p.Asp122Tyr | p.D122Y | P35568 | protein_coding | deleterious(0.02) | benign(0.27) | TCGA-BH-A0B6-01 | Breast | breast invasive carcinoma | Female | <65 | I/II | Unknown | Unknown | SD |
| IRS1 | SNV | Missense_Mutation | novel | c.830N>G | p.Ser277Cys | p.S277C | P35568 | protein_coding | deleterious(0) | probably_damaging(0.936) | TCGA-C8-A8HP-01 | Breast | breast invasive carcinoma | Female | <65 | III/IV | Chemotherapy | 5-fluorouracil | CR |
| IRS1 | SNV | Missense_Mutation | c.2199N>A | p.Met733Ile | p.M733I | P35568 | protein_coding | tolerated(0.85) | benign(0) | TCGA-D8-A1JN-01 | Breast | breast invasive carcinoma | Female | >=65 | III/IV | Hormone Therapy | anastrozolum | SD | |
| IRS1 | insertion | Frame_Shift_Ins | novel | c.1999_2000insTCAGGAG | p.Pro667LeufsTer10 | p.P667Lfs*10 | P35568 | protein_coding | TCGA-AO-A0JB-01 | Breast | breast invasive carcinoma | Female | <65 | III/IV | Chemotherapy | cyclophosphamide | SD | ||
| IRS1 | SNV | Missense_Mutation | novel | c.2509C>A | p.Leu837Met | p.L837M | P35568 | protein_coding | tolerated(0.25) | benign(0.146) | TCGA-2W-A8YY-01 | Cervix | cervical & endocervical cancer | Female | <65 | I/II | Chemotherapy | cisplatin | CR |
| IRS1 | SNV | Missense_Mutation | novel | c.1232G>A | p.Arg411Gln | p.R411Q | P35568 | protein_coding | deleterious(0.04) | possibly_damaging(0.852) | TCGA-2W-A8YY-01 | Cervix | cervical & endocervical cancer | Female | <65 | I/II | Chemotherapy | cisplatin | CR |
| Page: 1 2 3 4 5 6 7 8 9 10 11 12 13 14 15 |
Top |
Related drugs of malignant transformation related genes |
| Identification of chemicals and drugs interact with genes involved in malignant transfromation |
| (DGIdb 4.0) |
| Entrez ID | Symbol | Category | Interaction Types | Drug Claim Name | Drug Name | PMIDs |
| 3667 | IRS1 | KINASE, CLINICALLY ACTIONABLE | GS-101 | |||
| 3667 | IRS1 | KINASE, CLINICALLY ACTIONABLE | fluorouracil | FLUOROURACIL | ||
| 3667 | IRS1 | KINASE, CLINICALLY ACTIONABLE | GLIMEPIRIDE | GLIMEPIRIDE | 15710354 | |
| 3667 | IRS1 | KINASE, CLINICALLY ACTIONABLE | DHEA | PRASTERONE | 15501480 | |
| 3667 | IRS1 | KINASE, CLINICALLY ACTIONABLE | INOSITOL | INOSITOL | 9693122 | |
| 3667 | IRS1 | KINASE, CLINICALLY ACTIONABLE | ETHANOL | ALCOHOL | 7526037 | |
| 3667 | IRS1 | KINASE, CLINICALLY ACTIONABLE | epirubicin | EPIRUBICIN | ||
| 3667 | IRS1 | KINASE, CLINICALLY ACTIONABLE | cyclophosphamide | CYCLOPHOSPHAMIDE |
| Page: 1 |

Copyright 2023-Present -The University of Texas Health Science Center at Houston |