
|
|||||
|
 | |
| |
| |
| |
| |
| |
|
Gene: ING3 |
Gene summary for ING3 |
| Gene information | Species | Human | Gene symbol | ING3 | Gene ID | 54556 |
| Gene name | inhibitor of growth family member 3 | |
| Gene Alias | Eaf4 | |
| Cytomap | 7q31.31 | |
| Gene Type | protein-coding | GO ID | GO:0006139 | UniProtAcc | Q9NXR8 |
Top |
Malignant transformation analysis |
| Identification of the aberrant gene expression in precancerous and cancerous lesions by comparing the gene expression of stem-like cells in diseased tissues with normal stem cells |
| Entrez ID | Symbol | Replicates | Species | Organ | Tissue | Adj P-value | Log2FC | Malignancy |
| 54556 | ING3 | LZE4T | Human | Esophagus | ESCC | 1.29e-04 | 1.47e-01 | 0.0811 |
| 54556 | ING3 | LZE20T | Human | Esophagus | ESCC | 4.35e-05 | 9.75e-02 | 0.0662 |
| 54556 | ING3 | LZE24T | Human | Esophagus | ESCC | 2.96e-11 | 2.10e-01 | 0.0596 |
| 54556 | ING3 | P2T-E | Human | Esophagus | ESCC | 1.89e-06 | 1.31e-01 | 0.1177 |
| 54556 | ING3 | P4T-E | Human | Esophagus | ESCC | 5.29e-18 | 3.82e-01 | 0.1323 |
| 54556 | ING3 | P5T-E | Human | Esophagus | ESCC | 4.08e-05 | 1.00e-01 | 0.1327 |
| 54556 | ING3 | P8T-E | Human | Esophagus | ESCC | 5.80e-14 | 2.36e-01 | 0.0889 |
| 54556 | ING3 | P9T-E | Human | Esophagus | ESCC | 2.83e-11 | 2.34e-01 | 0.1131 |
| 54556 | ING3 | P10T-E | Human | Esophagus | ESCC | 4.42e-14 | 2.26e-01 | 0.116 |
| 54556 | ING3 | P11T-E | Human | Esophagus | ESCC | 6.43e-07 | 2.38e-01 | 0.1426 |
| 54556 | ING3 | P12T-E | Human | Esophagus | ESCC | 7.56e-12 | 3.02e-01 | 0.1122 |
| 54556 | ING3 | P15T-E | Human | Esophagus | ESCC | 7.06e-12 | 2.60e-01 | 0.1149 |
| 54556 | ING3 | P16T-E | Human | Esophagus | ESCC | 2.36e-07 | 4.06e-02 | 0.1153 |
| 54556 | ING3 | P20T-E | Human | Esophagus | ESCC | 6.20e-19 | 5.48e-01 | 0.1124 |
| 54556 | ING3 | P21T-E | Human | Esophagus | ESCC | 1.03e-11 | 1.75e-01 | 0.1617 |
| 54556 | ING3 | P22T-E | Human | Esophagus | ESCC | 8.74e-06 | 3.36e-02 | 0.1236 |
| 54556 | ING3 | P23T-E | Human | Esophagus | ESCC | 2.14e-07 | 1.00e-01 | 0.108 |
| 54556 | ING3 | P24T-E | Human | Esophagus | ESCC | 4.64e-07 | 5.69e-02 | 0.1287 |
| 54556 | ING3 | P26T-E | Human | Esophagus | ESCC | 8.61e-11 | 2.40e-01 | 0.1276 |
| 54556 | ING3 | P27T-E | Human | Esophagus | ESCC | 2.90e-12 | 2.25e-01 | 0.1055 |
| Page: 1 2 3 4 |
| Tissue | Expression Dynamics | Abbreviation |
| Esophagus | 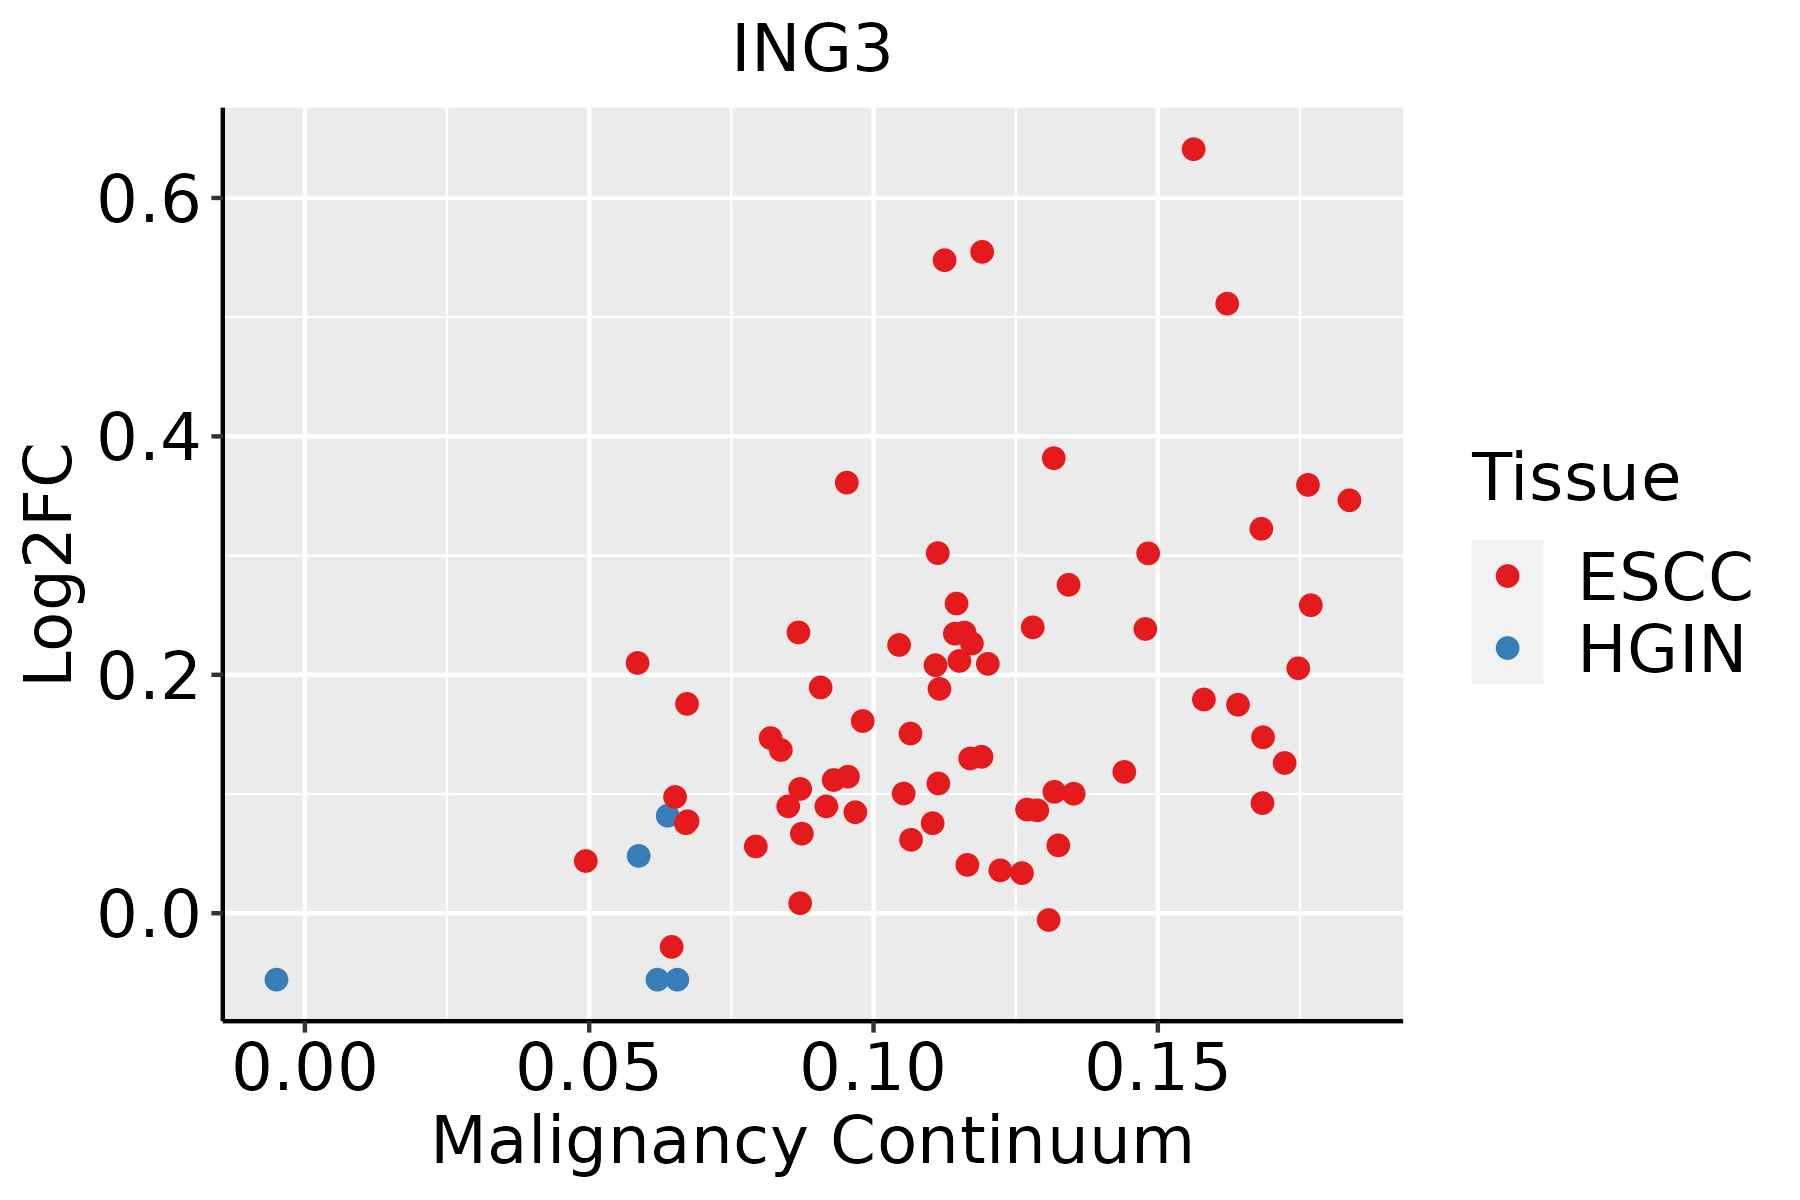 | ESCC: Esophageal squamous cell carcinoma |
| HGIN: High-grade intraepithelial neoplasias | ||
| LGIN: Low-grade intraepithelial neoplasias | ||
| Thyroid | 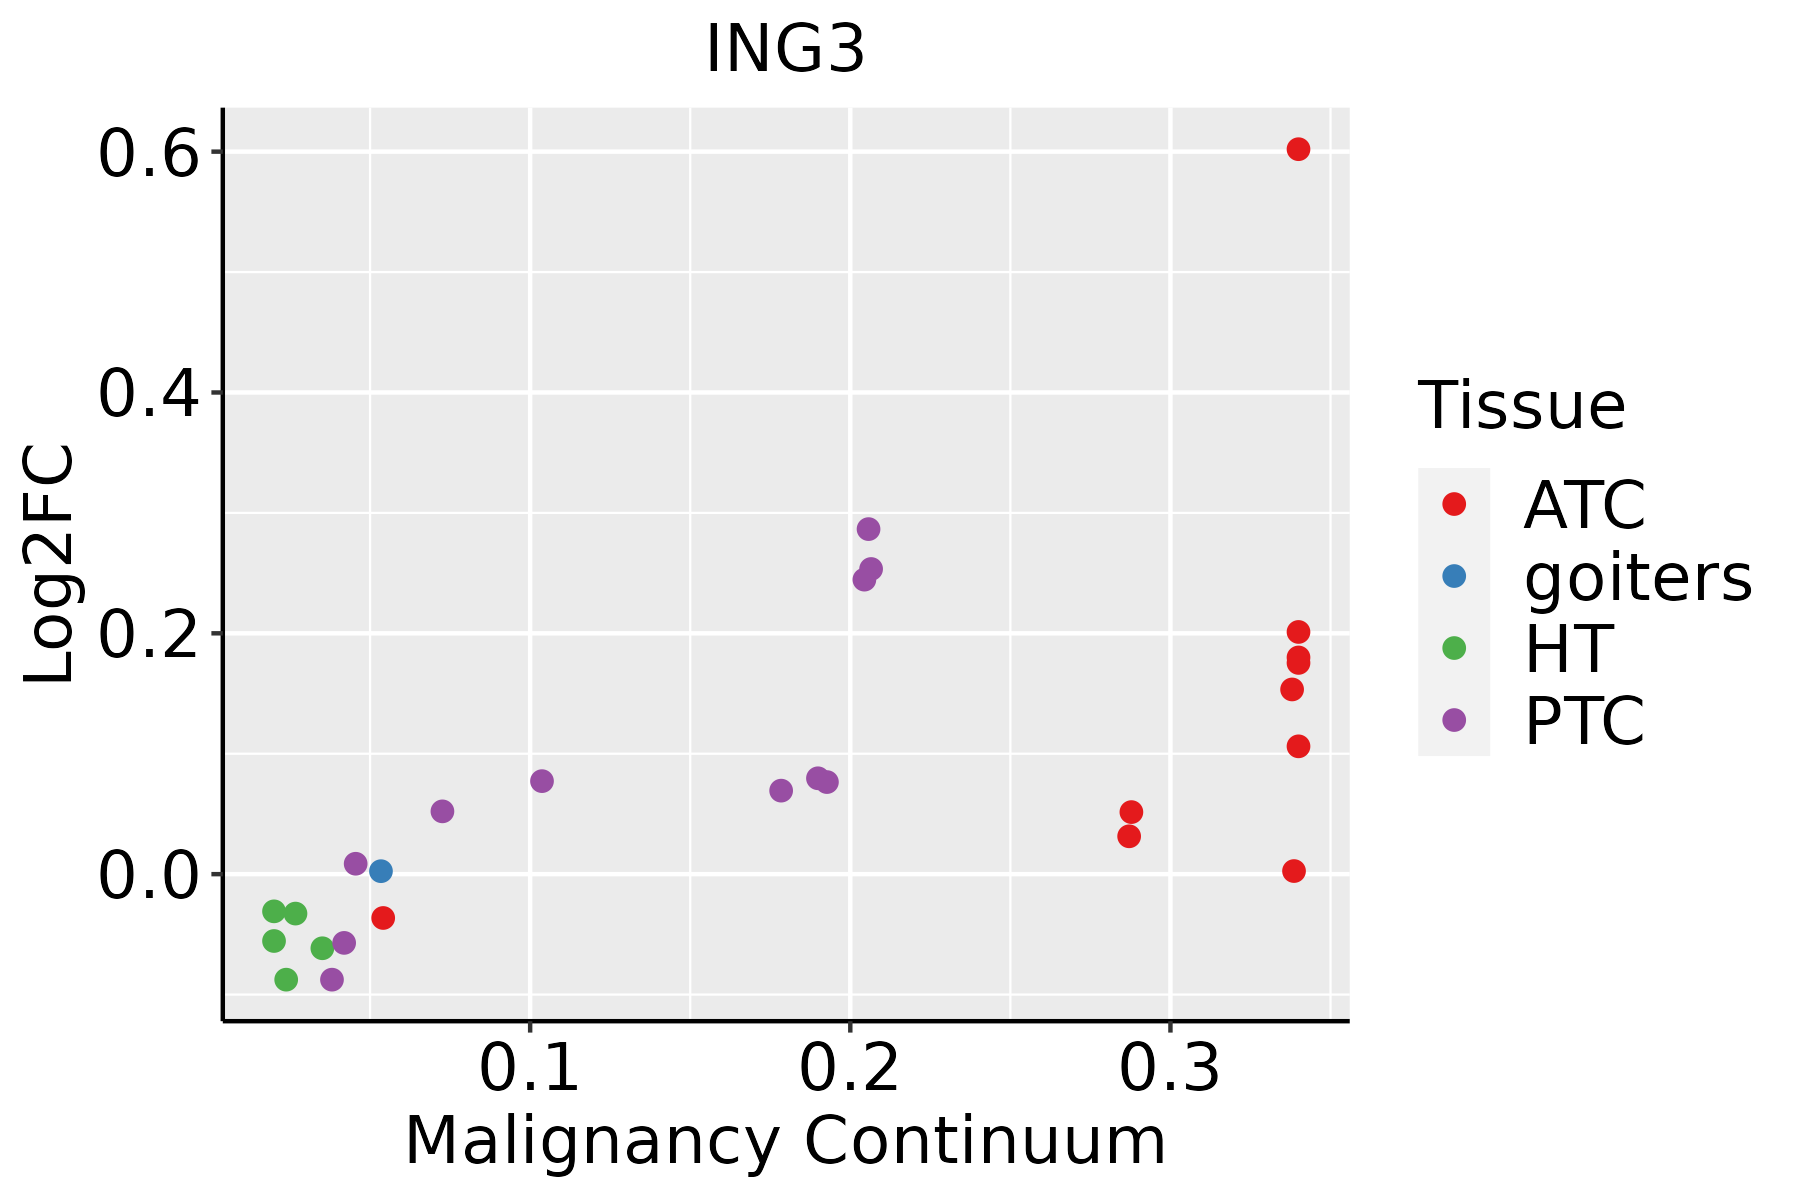 | ATC: Anaplastic thyroid cancer |
| HT: Hashimoto's thyroiditis | ||
| PTC: Papillary thyroid cancer |
| ∗log2FC in expression of this searched gene in stem-like cells from each diseased tissue sample relative to stem-like cells in normal samples in each tissue plotted against the malignancy continuum. Samples are colored based on if they are from different disease stage. |
Top |
Malignant transformation related pathway analysis |
| Find out the enriched GO biological processes and KEGG pathways involved in transition from healthy to precancer to cancer |
| Tissue | Disease Stage | Enriched GO biological Processes |
| Thyroid | PTC |  |
| Thyroid | goiters |  |
| Thyroid | ATC |  |
| ∗Top 15 enriched GO BP terms are showed in the bar plot of each disease state in each tissue. Each row represents a significant GO biological process which is colored according to the -log10(p.adjust). |
| Page: 1 2 3 4 5 6 7 8 9 |
| GO ID | Tissue | Disease Stage | Description | Gene Ratio | Bg Ratio | pvalue | p.adjust | Count |
| GO:001657015 | Esophagus | ESCC | histone modification | 323/8552 | 463/18723 | 2.61e-26 | 7.88e-24 | 323 |
| GO:001820514 | Esophagus | ESCC | peptidyl-lysine modification | 259/8552 | 376/18723 | 3.90e-20 | 5.26e-18 | 259 |
| GO:001839413 | Esophagus | ESCC | peptidyl-lysine acetylation | 123/8552 | 169/18723 | 6.58e-13 | 2.94e-11 | 123 |
| GO:004354313 | Esophagus | ESCC | protein acylation | 165/8552 | 243/18723 | 1.69e-12 | 7.14e-11 | 165 |
| GO:000647313 | Esophagus | ESCC | protein acetylation | 140/8552 | 201/18723 | 4.37e-12 | 1.69e-10 | 140 |
| GO:001839313 | Esophagus | ESCC | internal peptidyl-lysine acetylation | 114/8552 | 158/18723 | 1.16e-11 | 4.24e-10 | 114 |
| GO:000647513 | Esophagus | ESCC | internal protein amino acid acetylation | 115/8552 | 160/18723 | 1.43e-11 | 5.08e-10 | 115 |
| GO:00165735 | Esophagus | ESCC | histone acetylation | 110/8552 | 152/18723 | 1.95e-11 | 6.81e-10 | 110 |
| GO:004396712 | Esophagus | ESCC | histone H4 acetylation | 53/8552 | 67/18723 | 2.11e-08 | 4.03e-07 | 53 |
| GO:00439682 | Esophagus | ESCC | histone H2A acetylation | 15/8552 | 17/18723 | 3.48e-04 | 2.03e-03 | 15 |
| GO:001657010 | Thyroid | PTC | histone modification | 235/5968 | 463/18723 | 1.17e-17 | 1.15e-15 | 235 |
| GO:00064737 | Thyroid | PTC | protein acetylation | 116/5968 | 201/18723 | 3.05e-14 | 1.92e-12 | 116 |
| GO:00435437 | Thyroid | PTC | protein acylation | 134/5968 | 243/18723 | 4.22e-14 | 2.58e-12 | 134 |
| GO:00182059 | Thyroid | PTC | peptidyl-lysine modification | 188/5968 | 376/18723 | 1.34e-13 | 7.09e-12 | 188 |
| GO:00183947 | Thyroid | PTC | peptidyl-lysine acetylation | 99/5968 | 169/18723 | 6.54e-13 | 3.08e-11 | 99 |
| GO:00064757 | Thyroid | PTC | internal protein amino acid acetylation | 92/5968 | 160/18723 | 1.80e-11 | 7.06e-10 | 92 |
| GO:00183937 | Thyroid | PTC | internal peptidyl-lysine acetylation | 91/5968 | 158/18723 | 2.04e-11 | 7.91e-10 | 91 |
| GO:00165737 | Thyroid | PTC | histone acetylation | 88/5968 | 152/18723 | 2.97e-11 | 1.10e-09 | 88 |
| GO:00439677 | Thyroid | PTC | histone H4 acetylation | 45/5968 | 67/18723 | 3.16e-09 | 8.63e-08 | 45 |
| GO:00439684 | Thyroid | PTC | histone H2A acetylation | 14/5968 | 17/18723 | 2.62e-05 | 2.56e-04 | 14 |
| Page: 1 2 |
| Pathway ID | Tissue | Disease Stage | Description | Gene Ratio | Bg Ratio | pvalue | p.adjust | qvalue | Count |
| Page: 1 |
Top |
Cell-cell communication analysis |
| Identification of potential cell-cell interactions between two cell types and their ligand-receptor pairs for different disease states |
| Ligand | Receptor | LRpair | Pathway | Tissue | Disease Stage |
| Page: 1 |
Top |
Single-cell gene regulatory network inference analysis |
| Find out the significant the regulons (TFs) and the target genes of each regulon across cell types for different disease states |
| TF | Cell Type | Tissue | Disease Stage | Target Gene | RSS | Regulon Activity |
| ∗The dot plots of a searched regulon are shown for all cell subpopulations in each disease state of each tissue based on the regulon specific score inferred using pySCENIC and by calculating the average expression. |
| Page: 1 |
Top |
Somatic mutation of malignant transformation related genes |
| Annotation of somatic variants for genes involved in malignant transformation |
| Hugo Symbol | Variant Class | Variant Classification | dbSNP RS | HGVSc | HGVSp | HGVSp Short | SWISSPROT | BIOTYPE | SIFT | PolyPhen | Tumor Sample Barcode | Tissue | Histology | Sex | Age | Stage | Therapy Types | Drugs | Outcome |
| ING3 | SNV | Missense_Mutation | novel | c.563G>A | p.Arg188Gln | p.R188Q | Q9NXR8 | protein_coding | tolerated(0.2) | probably_damaging(0.921) | TCGA-D8-A1J8-01 | Breast | breast invasive carcinoma | Female | >=65 | I/II | Hormone Therapy | nolvadex | SD |
| ING3 | SNV | Missense_Mutation | rs761297921 | c.1149A>G | p.Ile383Met | p.I383M | Q9NXR8 | protein_coding | tolerated(0.06) | possibly_damaging(0.905) | TCGA-2W-A8YY-01 | Cervix | cervical & endocervical cancer | Female | <65 | I/II | Chemotherapy | cisplatin | CR |
| ING3 | SNV | Missense_Mutation | rs769542101 | c.209N>G | p.Tyr70Cys | p.Y70C | Q9NXR8 | protein_coding | deleterious(0.01) | possibly_damaging(0.811) | TCGA-5M-AATE-01 | Colorectum | colon adenocarcinoma | Male | >=65 | I/II | Unknown | Unknown | PD |
| ING3 | SNV | Missense_Mutation | novel | c.563N>A | p.Arg188Gln | p.R188Q | Q9NXR8 | protein_coding | tolerated(0.2) | probably_damaging(0.921) | TCGA-AA-A00N-01 | Colorectum | colon adenocarcinoma | Male | >=65 | I/II | Unknown | Unknown | PD |
| ING3 | SNV | Missense_Mutation | c.706N>G | p.Thr236Ala | p.T236A | Q9NXR8 | protein_coding | deleterious(0.03) | probably_damaging(0.931) | TCGA-AD-6895-01 | Colorectum | colon adenocarcinoma | Male | >=65 | III/IV | Unknown | Unknown | SD | |
| ING3 | SNV | Missense_Mutation | novel | c.563N>A | p.Arg188Gln | p.R188Q | Q9NXR8 | protein_coding | tolerated(0.2) | probably_damaging(0.921) | TCGA-AZ-4315-01 | Colorectum | colon adenocarcinoma | Male | <65 | I/II | Unknown | Unknown | SD |
| ING3 | SNV | Missense_Mutation | c.542N>C | p.Lys181Thr | p.K181T | Q9NXR8 | protein_coding | tolerated(0.24) | probably_damaging(0.932) | TCGA-CA-6718-01 | Colorectum | colon adenocarcinoma | Male | <65 | I/II | Unknown | Unknown | PD | |
| ING3 | SNV | Missense_Mutation | c.49G>A | p.Asp17Asn | p.D17N | Q9NXR8 | protein_coding | deleterious(0.01) | probably_damaging(0.989) | TCGA-A5-A0G2-01 | Endometrium | uterine corpus endometrioid carcinoma | Female | <65 | III/IV | Unknown | Unknown | SD | |
| ING3 | SNV | Missense_Mutation | c.1154G>T | p.Trp385Leu | p.W385L | Q9NXR8 | protein_coding | deleterious(0) | probably_damaging(0.995) | TCGA-AJ-A23O-01 | Endometrium | uterine corpus endometrioid carcinoma | Female | >=65 | I/II | Unknown | Unknown | SD | |
| ING3 | SNV | Missense_Mutation | c.49N>T | p.Asp17Tyr | p.D17Y | Q9NXR8 | protein_coding | deleterious(0) | probably_damaging(0.998) | TCGA-AP-A059-01 | Endometrium | uterine corpus endometrioid carcinoma | Female | >=65 | I/II | Unknown | Unknown | SD |
| Page: 1 2 3 4 |
Top |
Related drugs of malignant transformation related genes |
| Identification of chemicals and drugs interact with genes involved in malignant transfromation |
| (DGIdb 4.0) |
| Entrez ID | Symbol | Category | Interaction Types | Drug Claim Name | Drug Name | PMIDs |
| Page: 1 |

Copyright 2023-Present -The University of Texas Health Science Center at Houston |