
|
|||||
|
 | |
| |
| |
| |
| |
| |
|
Gene: GOSR2 |
Gene summary for GOSR2 |
| Gene information | Species | Human | Gene symbol | GOSR2 | Gene ID | 9570 |
| Gene name | golgi SNAP receptor complex member 2 | |
| Gene Alias | Bos1 | |
| Cytomap | 17q21.32 | |
| Gene Type | protein-coding | GO ID | GO:0006810 | UniProtAcc | O14653 |
Top |
Malignant transformation analysis |
| Identification of the aberrant gene expression in precancerous and cancerous lesions by comparing the gene expression of stem-like cells in diseased tissues with normal stem cells |
| Entrez ID | Symbol | Replicates | Species | Organ | Tissue | Adj P-value | Log2FC | Malignancy |
| 9570 | GOSR2 | HCC1_Meng | Human | Liver | HCC | 3.02e-64 | 1.89e-01 | 0.0246 |
| 9570 | GOSR2 | HCC2_Meng | Human | Liver | HCC | 6.76e-11 | 5.82e-02 | 0.0107 |
| 9570 | GOSR2 | HCC1 | Human | Liver | HCC | 5.50e-04 | 2.95e+00 | 0.5336 |
| 9570 | GOSR2 | HCC2 | Human | Liver | HCC | 3.50e-17 | 4.29e+00 | 0.5341 |
| 9570 | GOSR2 | Pt13.b | Human | Liver | HCC | 1.79e-08 | 1.21e-01 | 0.0251 |
| 9570 | GOSR2 | S014 | Human | Liver | HCC | 3.30e-13 | 4.59e-01 | 0.2254 |
| 9570 | GOSR2 | S015 | Human | Liver | HCC | 1.68e-07 | 4.54e-01 | 0.2375 |
| 9570 | GOSR2 | S016 | Human | Liver | HCC | 6.55e-11 | 3.59e-01 | 0.2243 |
| 9570 | GOSR2 | S027 | Human | Liver | HCC | 7.04e-11 | 6.54e-01 | 0.2446 |
| 9570 | GOSR2 | S028 | Human | Liver | HCC | 8.29e-15 | 6.22e-01 | 0.2503 |
| 9570 | GOSR2 | S029 | Human | Liver | HCC | 1.69e-17 | 7.21e-01 | 0.2581 |
| 9570 | GOSR2 | C04 | Human | Oral cavity | OSCC | 1.96e-17 | 8.11e-01 | 0.2633 |
| 9570 | GOSR2 | C21 | Human | Oral cavity | OSCC | 5.27e-37 | 1.11e+00 | 0.2678 |
| 9570 | GOSR2 | C30 | Human | Oral cavity | OSCC | 1.65e-47 | 2.06e+00 | 0.3055 |
| 9570 | GOSR2 | C38 | Human | Oral cavity | OSCC | 1.35e-03 | 6.01e-01 | 0.172 |
| 9570 | GOSR2 | C43 | Human | Oral cavity | OSCC | 9.82e-21 | 3.58e-01 | 0.1704 |
| 9570 | GOSR2 | C51 | Human | Oral cavity | OSCC | 1.62e-11 | 6.35e-01 | 0.2674 |
| 9570 | GOSR2 | C57 | Human | Oral cavity | OSCC | 4.26e-11 | 3.52e-01 | 0.1679 |
| 9570 | GOSR2 | C06 | Human | Oral cavity | OSCC | 7.24e-09 | 9.35e-01 | 0.2699 |
| 9570 | GOSR2 | C08 | Human | Oral cavity | OSCC | 6.71e-25 | 4.33e-01 | 0.1919 |
| Page: 1 2 3 |
| Tissue | Expression Dynamics | Abbreviation |
| Liver | 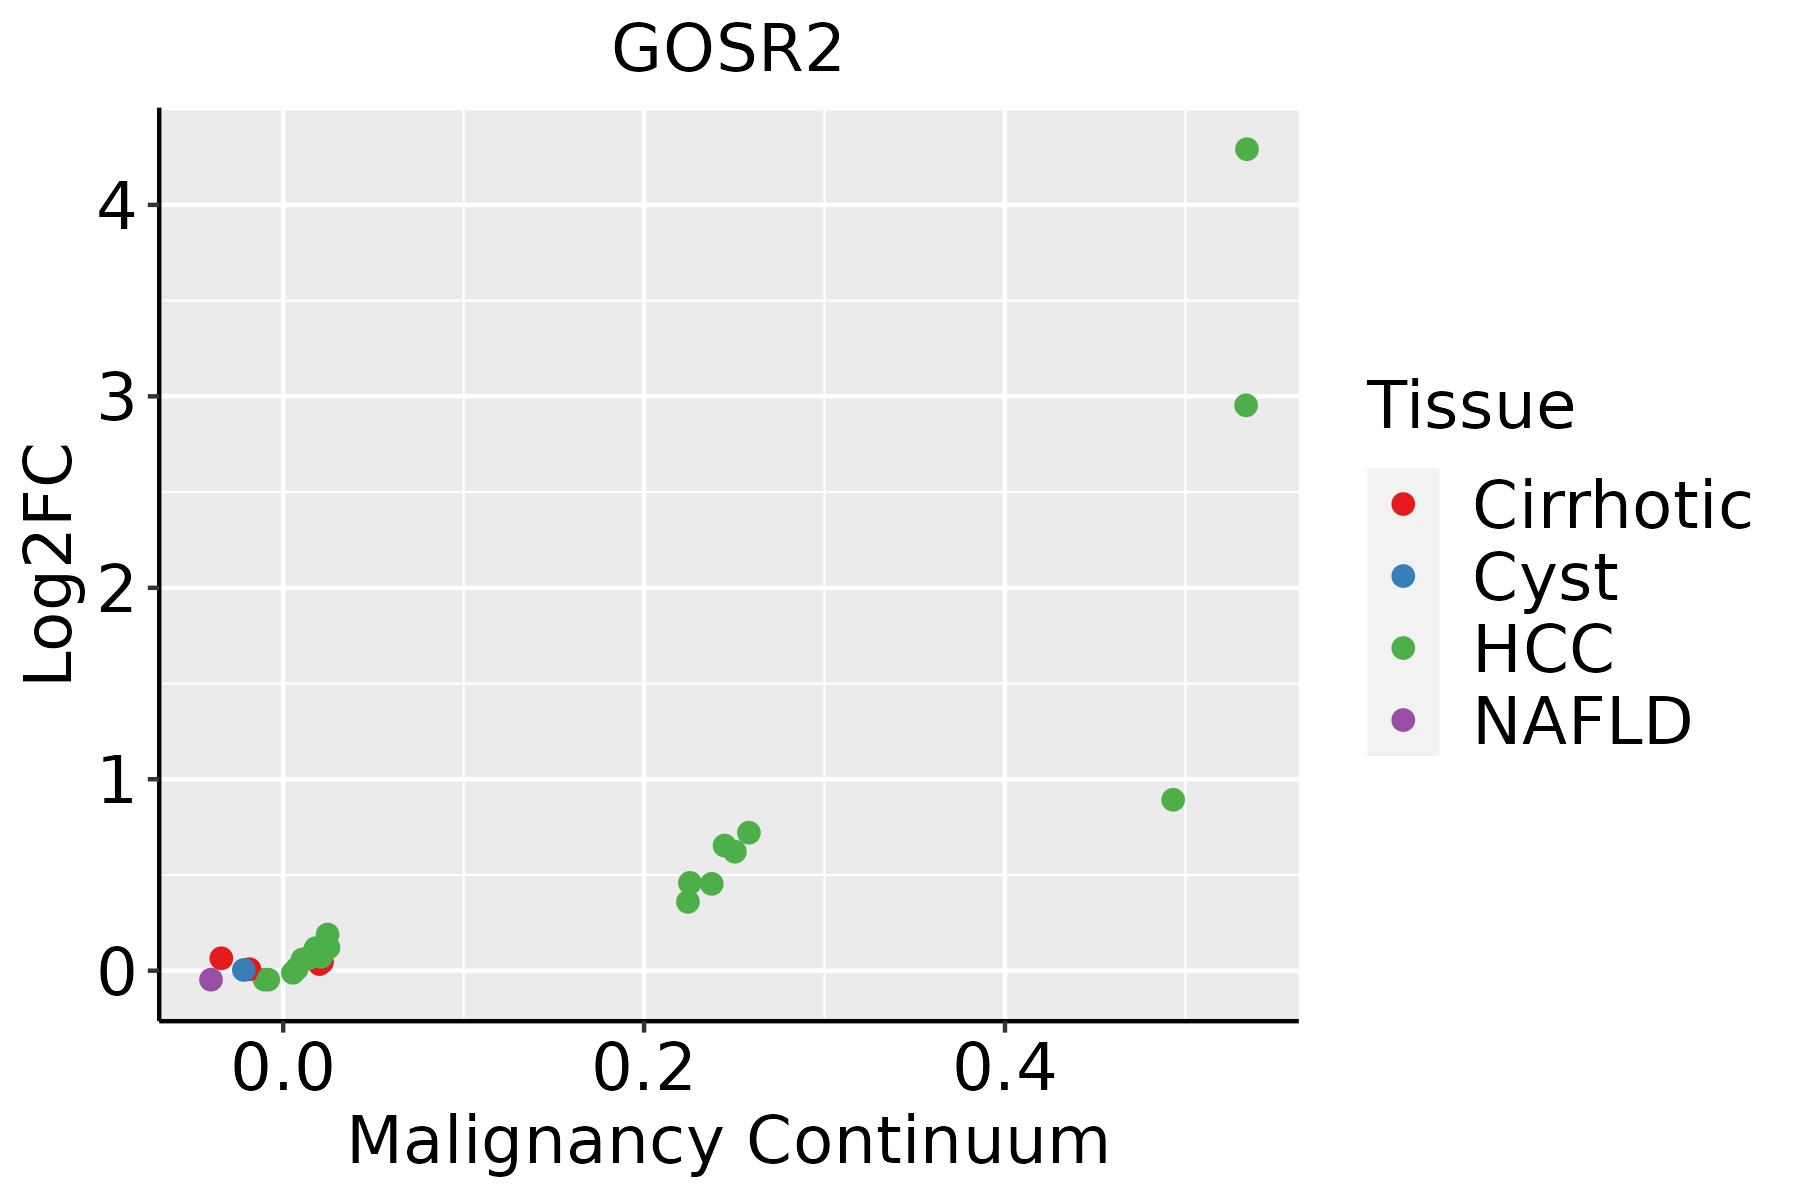 | HCC: Hepatocellular carcinoma |
| NAFLD: Non-alcoholic fatty liver disease | ||
| Oral Cavity |  | EOLP: Erosive Oral lichen planus |
| LP: leukoplakia | ||
| NEOLP: Non-erosive oral lichen planus | ||
| OSCC: Oral squamous cell carcinoma | ||
| Skin |  | AK: Actinic keratosis |
| cSCC: Cutaneous squamous cell carcinoma | ||
| SCCIS:squamous cell carcinoma in situ | ||
| Thyroid | 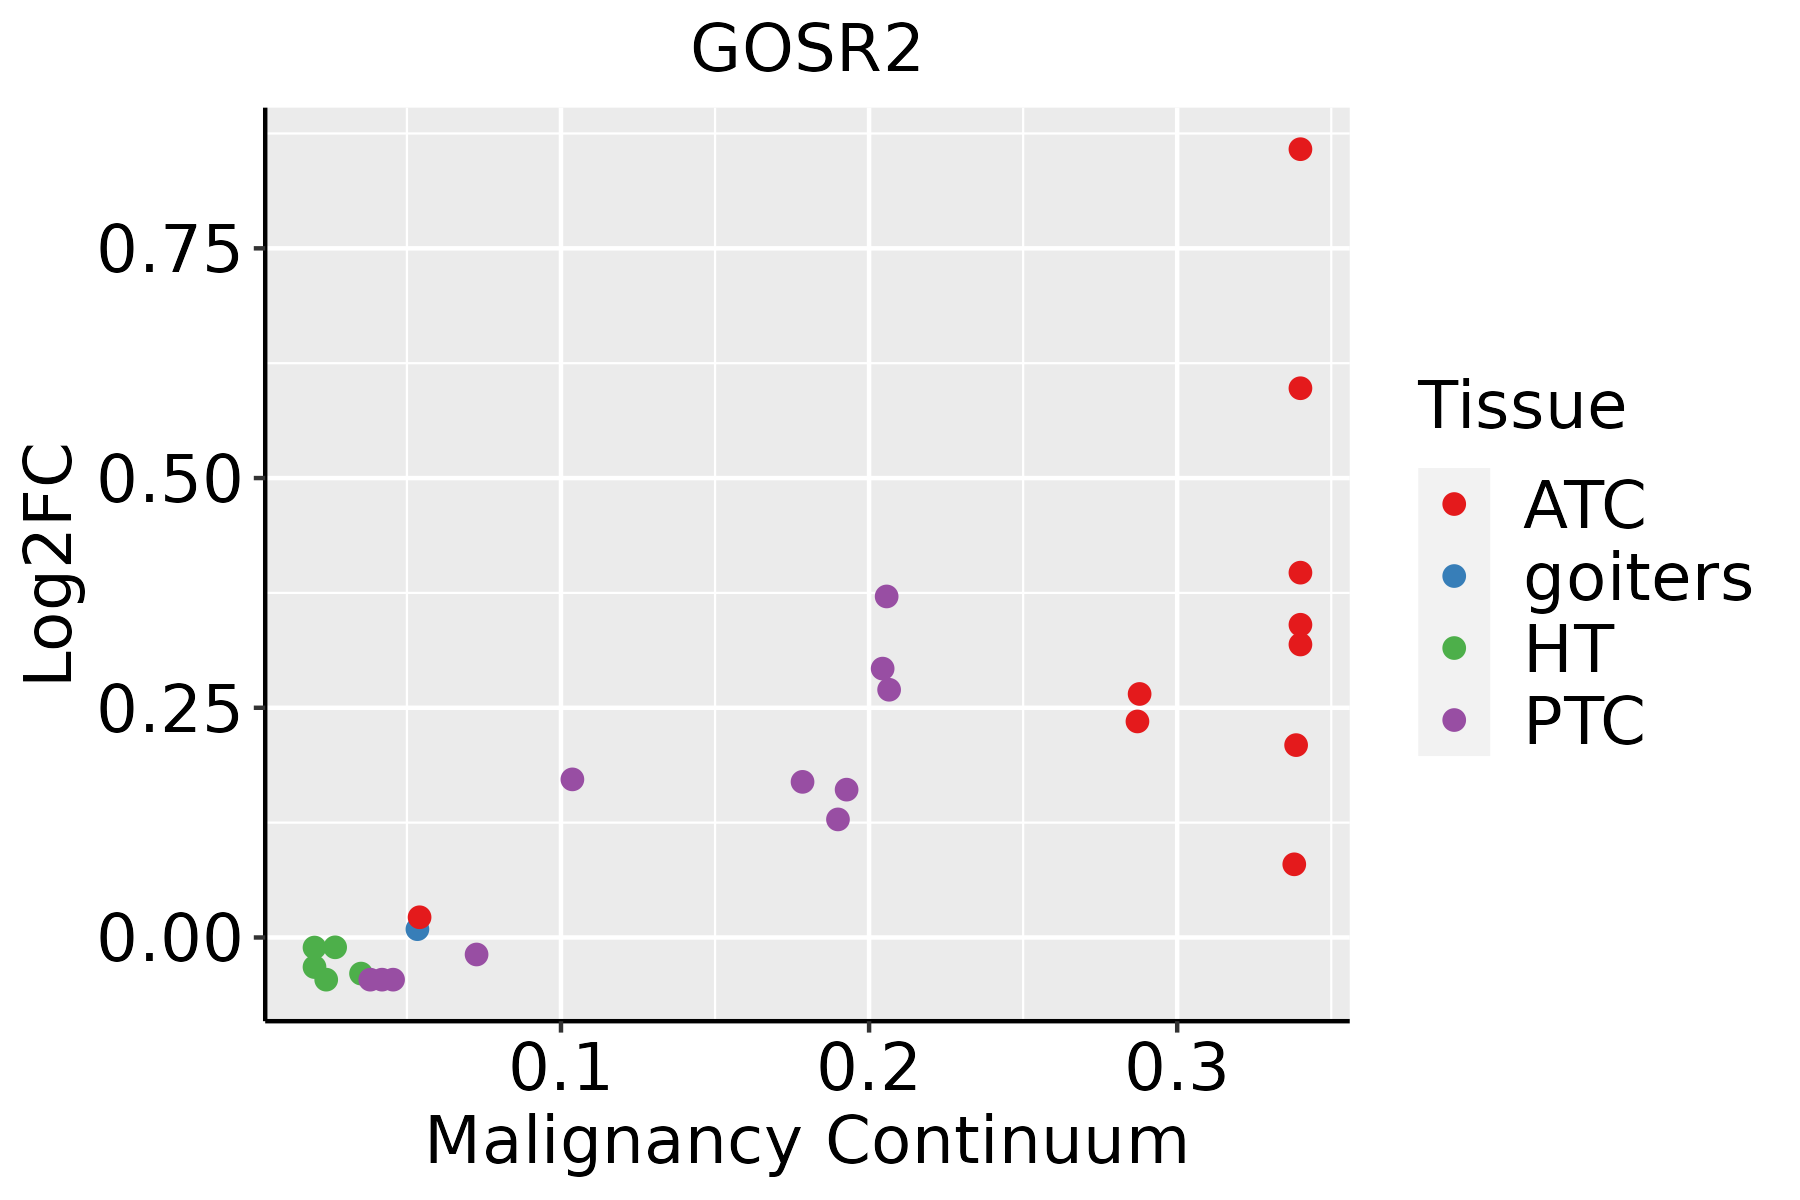 | ATC: Anaplastic thyroid cancer |
| HT: Hashimoto's thyroiditis | ||
| PTC: Papillary thyroid cancer |
| ∗log2FC in expression of this searched gene in stem-like cells from each diseased tissue sample relative to stem-like cells in normal samples in each tissue plotted against the malignancy continuum. Samples are colored based on if they are from different disease stage. |
Top |
Malignant transformation related pathway analysis |
| Find out the enriched GO biological processes and KEGG pathways involved in transition from healthy to precancer to cancer |
| Tissue | Disease Stage | Enriched GO biological Processes |
| Thyroid | PTC |  |
| Thyroid | goiters |  |
| Thyroid | ATC |  |
| ∗Top 15 enriched GO BP terms are showed in the bar plot of each disease state in each tissue. Each row represents a significant GO biological process which is colored according to the -log10(p.adjust). |
| Page: 1 2 3 4 5 6 7 8 9 |
| GO ID | Tissue | Disease Stage | Description | Gene Ratio | Bg Ratio | pvalue | p.adjust | Count |
| GO:004819321 | Liver | HCC | Golgi vesicle transport | 217/7958 | 296/18723 | 2.58e-27 | 1.02e-24 | 217 |
| GO:001605021 | Liver | HCC | vesicle organization | 194/7958 | 300/18723 | 5.58e-15 | 3.97e-13 | 194 |
| GO:004828411 | Liver | HCC | organelle fusion | 84/7958 | 141/18723 | 3.13e-05 | 3.20e-04 | 84 |
| GO:00901741 | Liver | HCC | organelle membrane fusion | 63/7958 | 110/18723 | 1.24e-03 | 6.85e-03 | 63 |
| GO:00069061 | Liver | HCC | vesicle fusion | 61/7958 | 106/18723 | 1.25e-03 | 6.90e-03 | 61 |
| GO:0061025 | Liver | HCC | membrane fusion | 88/7958 | 163/18723 | 1.98e-03 | 1.00e-02 | 88 |
| GO:0006891 | Liver | HCC | intra-Golgi vesicle-mediated transport | 22/7958 | 33/18723 | 4.38e-03 | 1.90e-02 | 22 |
| GO:004819315 | Oral cavity | OSCC | Golgi vesicle transport | 209/7305 | 296/18723 | 1.39e-28 | 6.30e-26 | 209 |
| GO:00160508 | Oral cavity | OSCC | vesicle organization | 189/7305 | 300/18723 | 2.40e-17 | 2.14e-15 | 189 |
| GO:00482843 | Oral cavity | OSCC | organelle fusion | 82/7305 | 141/18723 | 3.08e-06 | 3.72e-05 | 82 |
| GO:00901742 | Oral cavity | OSCC | organelle membrane fusion | 63/7305 | 110/18723 | 7.75e-05 | 6.01e-04 | 63 |
| GO:00069062 | Oral cavity | OSCC | vesicle fusion | 61/7305 | 106/18723 | 8.28e-05 | 6.35e-04 | 61 |
| GO:00068913 | Oral cavity | OSCC | intra-Golgi vesicle-mediated transport | 23/7305 | 33/18723 | 3.47e-04 | 2.12e-03 | 23 |
| GO:00610253 | Oral cavity | OSCC | membrane fusion | 84/7305 | 163/18723 | 7.56e-04 | 4.12e-03 | 84 |
| GO:004819316 | Oral cavity | LP | Golgi vesicle transport | 141/4623 | 296/18723 | 6.11e-18 | 1.06e-15 | 141 |
| GO:001605013 | Oral cavity | LP | vesicle organization | 128/4623 | 300/18723 | 4.96e-12 | 3.98e-10 | 128 |
| GO:004828412 | Oral cavity | LP | organelle fusion | 56/4623 | 141/18723 | 5.55e-05 | 7.62e-04 | 56 |
| GO:000690611 | Oral cavity | LP | vesicle fusion | 44/4623 | 106/18723 | 1.01e-04 | 1.24e-03 | 44 |
| GO:009017411 | Oral cavity | LP | organelle membrane fusion | 45/4623 | 110/18723 | 1.28e-04 | 1.49e-03 | 45 |
| GO:00610251 | Oral cavity | LP | membrane fusion | 58/4623 | 163/18723 | 1.19e-03 | 9.62e-03 | 58 |
| Page: 1 2 3 |
| Pathway ID | Tissue | Disease Stage | Description | Gene Ratio | Bg Ratio | pvalue | p.adjust | qvalue | Count |
| hsa041302 | Liver | HCC | SNARE interactions in vesicular transport | 25/4020 | 33/8465 | 8.78e-04 | 3.38e-03 | 1.88e-03 | 25 |
| hsa041303 | Liver | HCC | SNARE interactions in vesicular transport | 25/4020 | 33/8465 | 8.78e-04 | 3.38e-03 | 1.88e-03 | 25 |
| hsa041304 | Oral cavity | OSCC | SNARE interactions in vesicular transport | 28/3704 | 33/8465 | 1.31e-06 | 7.18e-06 | 3.66e-06 | 28 |
| hsa0413011 | Oral cavity | OSCC | SNARE interactions in vesicular transport | 28/3704 | 33/8465 | 1.31e-06 | 7.18e-06 | 3.66e-06 | 28 |
| hsa0413021 | Oral cavity | LP | SNARE interactions in vesicular transport | 22/2418 | 33/8465 | 6.00e-06 | 4.76e-05 | 3.07e-05 | 22 |
| hsa0413031 | Oral cavity | LP | SNARE interactions in vesicular transport | 22/2418 | 33/8465 | 6.00e-06 | 4.76e-05 | 3.07e-05 | 22 |
| Page: 1 |
Top |
Cell-cell communication analysis |
| Identification of potential cell-cell interactions between two cell types and their ligand-receptor pairs for different disease states |
| Ligand | Receptor | LRpair | Pathway | Tissue | Disease Stage |
| Page: 1 |
Top |
Single-cell gene regulatory network inference analysis |
| Find out the significant the regulons (TFs) and the target genes of each regulon across cell types for different disease states |
| TF | Cell Type | Tissue | Disease Stage | Target Gene | RSS | Regulon Activity |
| ∗The dot plots of a searched regulon are shown for all cell subpopulations in each disease state of each tissue based on the regulon specific score inferred using pySCENIC and by calculating the average expression. |
| Page: 1 |
Top |
Somatic mutation of malignant transformation related genes |
| Annotation of somatic variants for genes involved in malignant transformation |
| Hugo Symbol | Variant Class | Variant Classification | dbSNP RS | HGVSc | HGVSp | HGVSp Short | SWISSPROT | BIOTYPE | SIFT | PolyPhen | Tumor Sample Barcode | Tissue | Histology | Sex | Age | Stage | Therapy Types | Drugs | Outcome |
| GOSR2 | insertion | In_Frame_Ins | novel | c.566_567insGGGGAAGCCATGGAAAGGAACATTTGGAACCAG | p.Asp189delinsGluGlyLysProTrpLysGlyThrPheGlyThrSer | p.D189delinsEGKPWKGTFGTS | O14653 | protein_coding | TCGA-BH-A0BJ-01 | Breast | breast invasive carcinoma | Female | <65 | I/II | Chemotherapy | doxorubicin | SD | ||
| GOSR2 | SNV | Missense_Mutation | novel | c.133N>G | p.Phe45Val | p.F45V | O14653 | protein_coding | tolerated(0.49) | benign(0.175) | TCGA-FU-A3HZ-01 | Cervix | cervical & endocervical cancer | Female | <65 | I/II | Chemotherapy | cisplatin | CR |
| GOSR2 | SNV | Missense_Mutation | c.154G>A | p.Glu52Lys | p.E52K | O14653 | protein_coding | deleterious(0.01) | possibly_damaging(0.761) | TCGA-A6-6780-01 | Colorectum | colon adenocarcinoma | Male | >=65 | I/II | Unknown | Unknown | SD | |
| GOSR2 | SNV | Missense_Mutation | rs577835455 | c.248N>T | p.Ala83Val | p.A83V | O14653 | protein_coding | deleterious(0.04) | possibly_damaging(0.616) | TCGA-AA-3977-01 | Colorectum | colon adenocarcinoma | Male | >=65 | I/II | Unknown | Unknown | SD |
| GOSR2 | SNV | Missense_Mutation | c.344A>T | p.Asp115Val | p.D115V | O14653 | protein_coding | deleterious(0.01) | possibly_damaging(0.735) | TCGA-CK-4951-01 | Colorectum | colon adenocarcinoma | Female | >=65 | I/II | Unknown | Unknown | PD | |
| GOSR2 | SNV | Missense_Mutation | c.134N>C | p.Phe45Ser | p.F45S | O14653 | protein_coding | tolerated(0.44) | benign(0.013) | TCGA-DM-A1HB-01 | Colorectum | colon adenocarcinoma | Male | >=65 | III/IV | Unknown | Unknown | SD | |
| GOSR2 | SNV | Missense_Mutation | novel | c.311N>C | p.Leu104Pro | p.L104P | O14653 | protein_coding | deleterious(0) | probably_damaging(1) | TCGA-AG-4005-01 | Colorectum | rectum adenocarcinoma | Male | <65 | III/IV | Chemotherapy | folinic | CR |
| GOSR2 | SNV | Missense_Mutation | c.156N>T | p.Glu52Asp | p.E52D | O14653 | protein_coding | tolerated(1) | benign(0.029) | TCGA-AG-A002-01 | Colorectum | rectum adenocarcinoma | Male | <65 | I/II | Unknown | Unknown | SD | |
| GOSR2 | SNV | Missense_Mutation | c.294N>T | p.Glu98Asp | p.E98D | O14653 | protein_coding | tolerated(0.28) | benign(0.02) | TCGA-A5-A0G2-01 | Endometrium | uterine corpus endometrioid carcinoma | Female | <65 | III/IV | Unknown | Unknown | SD | |
| GOSR2 | SNV | Missense_Mutation | novel | c.479N>T | p.Gly160Val | p.G160V | O14653 | protein_coding | deleterious(0.01) | probably_damaging(0.966) | TCGA-A5-A0G2-01 | Endometrium | uterine corpus endometrioid carcinoma | Female | <65 | III/IV | Unknown | Unknown | SD |
| Page: 1 2 3 |
Top |
Related drugs of malignant transformation related genes |
| Identification of chemicals and drugs interact with genes involved in malignant transfromation |
| (DGIdb 4.0) |
| Entrez ID | Symbol | Category | Interaction Types | Drug Claim Name | Drug Name | PMIDs |
| Page: 1 |

Copyright 2023-Present -The University of Texas Health Science Center at Houston |