
|
|||||
|
 | |
| |
| |
| |
| |
| |
|
Gene: GFRA2 |
Gene summary for GFRA2 |
| Gene information | Species | Human | Gene symbol | GFRA2 | Gene ID | 2675 |
| Gene name | GDNF family receptor alpha 2 | |
| Gene Alias | GDNFRB | |
| Cytomap | 8p21.3 | |
| Gene Type | protein-coding | GO ID | GO:0001932 | UniProtAcc | O00451 |
Top |
Malignant transformation analysis |
| Identification of the aberrant gene expression in precancerous and cancerous lesions by comparing the gene expression of stem-like cells in diseased tissues with normal stem cells |
| Entrez ID | Symbol | Replicates | Species | Organ | Tissue | Adj P-value | Log2FC | Malignancy |
| 2675 | GFRA2 | male-WTA | Human | Thyroid | PTC | 1.92e-23 | 2.36e-01 | 0.1037 |
| 2675 | GFRA2 | PTC01 | Human | Thyroid | PTC | 1.84e-04 | 2.13e-01 | 0.1899 |
| 2675 | GFRA2 | PTC06 | Human | Thyroid | PTC | 4.42e-19 | 6.81e-01 | 0.2057 |
| 2675 | GFRA2 | PTC07 | Human | Thyroid | PTC | 4.11e-17 | 4.55e-01 | 0.2044 |
| Page: 1 |
| Tissue | Expression Dynamics | Abbreviation |
| Thyroid | 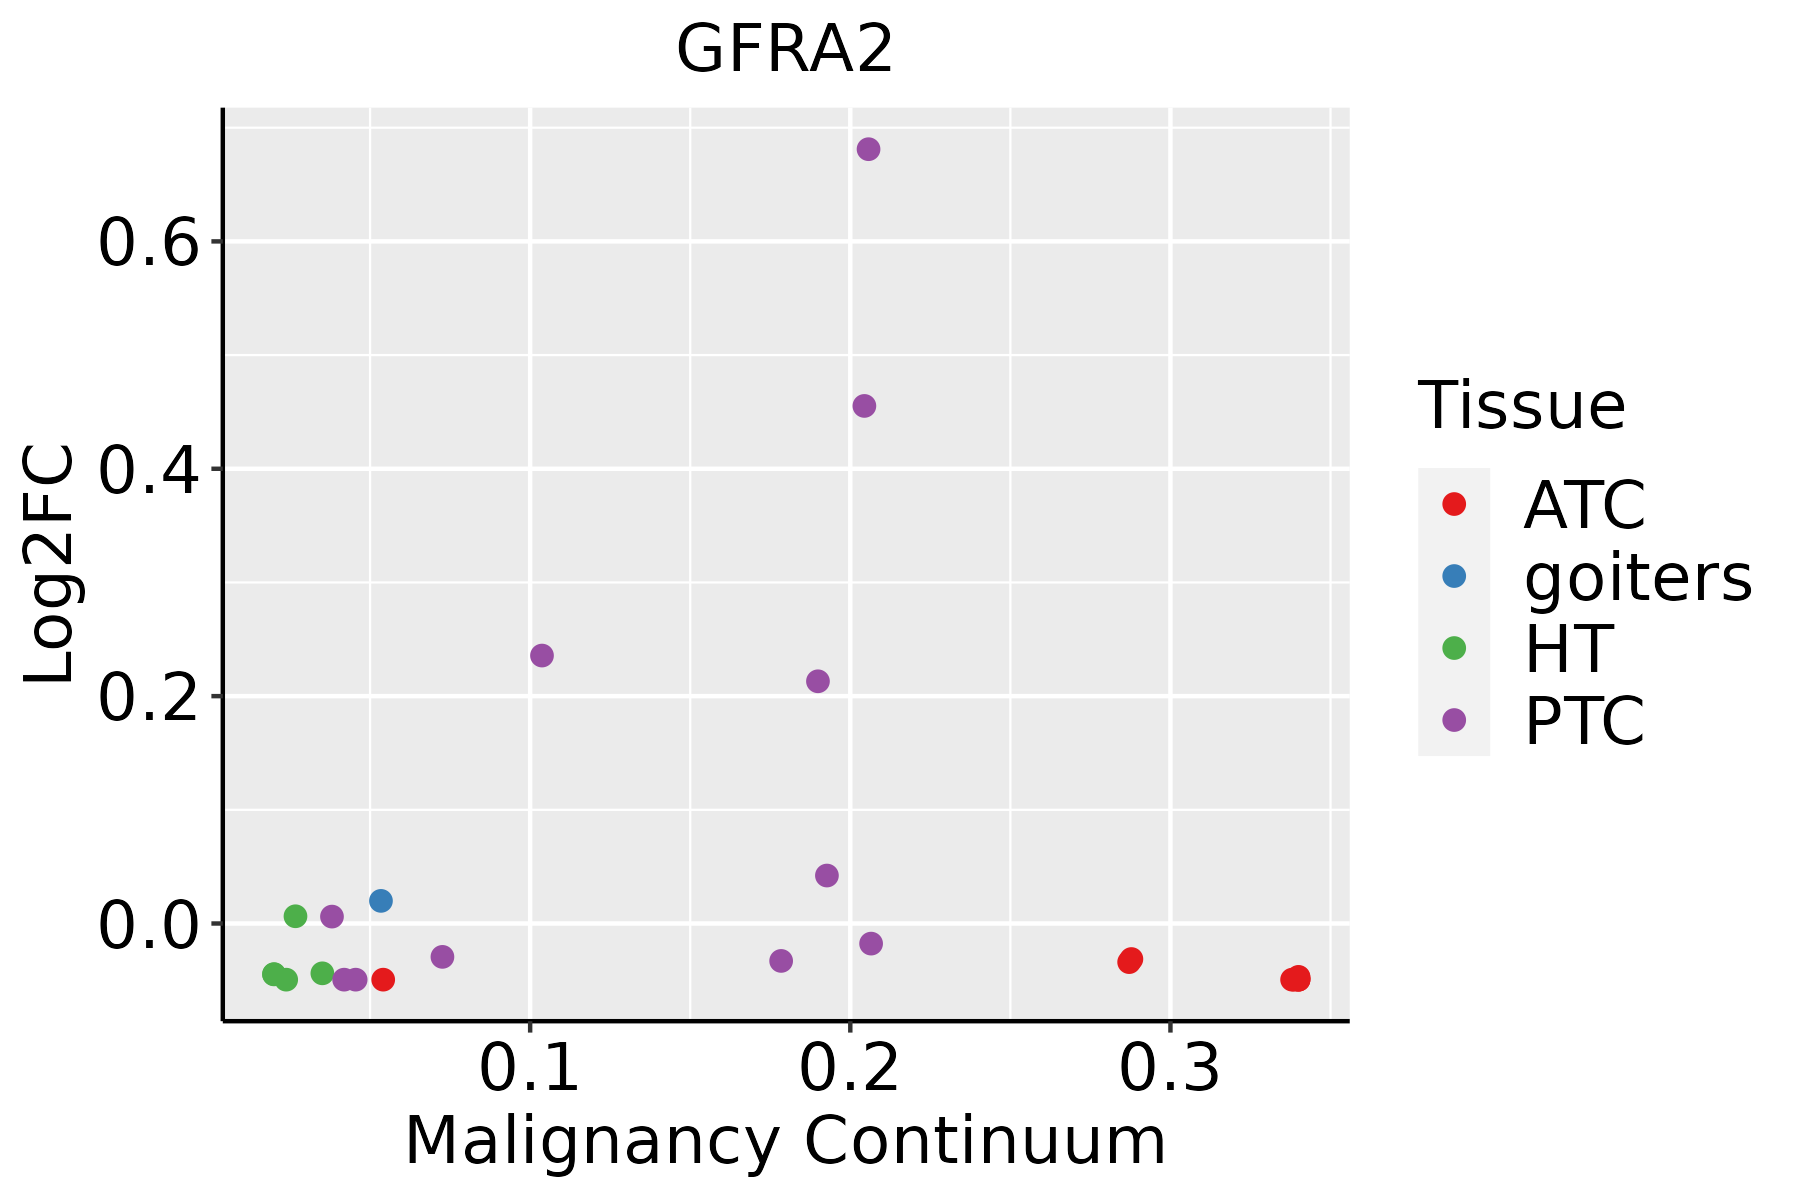 | ATC: Anaplastic thyroid cancer |
| HT: Hashimoto's thyroiditis | ||
| PTC: Papillary thyroid cancer |
| ∗log2FC in expression of this searched gene in stem-like cells from each diseased tissue sample relative to stem-like cells in normal samples in each tissue plotted against the malignancy continuum. Samples are colored based on if they are from different disease stage. |
Top |
Malignant transformation related pathway analysis |
| Find out the enriched GO biological processes and KEGG pathways involved in transition from healthy to precancer to cancer |
| Tissue | Disease Stage | Enriched GO biological Processes |
| Thyroid | PTC |  |
| Thyroid | goiters |  |
| Thyroid | ATC |  |
| ∗Top 15 enriched GO BP terms are showed in the bar plot of each disease state in each tissue. Each row represents a significant GO biological process which is colored according to the -log10(p.adjust). |
| Page: 1 2 3 4 5 6 7 8 9 |
| GO ID | Tissue | Disease Stage | Description | Gene Ratio | Bg Ratio | pvalue | p.adjust | Count |
| GO:0010563113 | Thyroid | PTC | negative regulation of phosphorus metabolic process | 219/5968 | 442/18723 | 4.47e-15 | 3.07e-13 | 219 |
| GO:0045936113 | Thyroid | PTC | negative regulation of phosphate metabolic process | 218/5968 | 441/18723 | 7.08e-15 | 4.75e-13 | 218 |
| GO:0001933113 | Thyroid | PTC | negative regulation of protein phosphorylation | 173/5968 | 342/18723 | 3.46e-13 | 1.75e-11 | 173 |
| GO:0042326113 | Thyroid | PTC | negative regulation of phosphorylation | 189/5968 | 385/18723 | 1.00e-12 | 4.64e-11 | 189 |
| GO:004677716 | Thyroid | PTC | protein autophosphorylation | 110/5968 | 227/18723 | 1.25e-07 | 2.44e-06 | 110 |
| GO:00319522 | Thyroid | PTC | regulation of protein autophosphorylation | 26/5968 | 43/18723 | 1.04e-04 | 8.42e-04 | 26 |
| Page: 1 |
| Pathway ID | Tissue | Disease Stage | Description | Gene Ratio | Bg Ratio | pvalue | p.adjust | qvalue | Count |
| Page: 1 |
Top |
Cell-cell communication analysis |
| Identification of potential cell-cell interactions between two cell types and their ligand-receptor pairs for different disease states |
| Ligand | Receptor | LRpair | Pathway | Tissue | Disease Stage |
| Page: 1 |
Top |
Single-cell gene regulatory network inference analysis |
| Find out the significant the regulons (TFs) and the target genes of each regulon across cell types for different disease states |
| TF | Cell Type | Tissue | Disease Stage | Target Gene | RSS | Regulon Activity |
| ∗The dot plots of a searched regulon are shown for all cell subpopulations in each disease state of each tissue based on the regulon specific score inferred using pySCENIC and by calculating the average expression. |
| Page: 1 |
Top |
Somatic mutation of malignant transformation related genes |
| Annotation of somatic variants for genes involved in malignant transformation |
| Hugo Symbol | Variant Class | Variant Classification | dbSNP RS | HGVSc | HGVSp | HGVSp Short | SWISSPROT | BIOTYPE | SIFT | PolyPhen | Tumor Sample Barcode | Tissue | Histology | Sex | Age | Stage | Therapy Types | Drugs | Outcome |
| GFRA2 | SNV | Missense_Mutation | rs201199040 | c.1129N>T | p.Arg377Trp | p.R377W | O00451 | protein_coding | tolerated(0.09) | possibly_damaging(0.619) | TCGA-A2-A0CL-01 | Breast | breast invasive carcinoma | Female | <65 | III/IV | Chemotherapy | cytoxan | SD |
| GFRA2 | SNV | Missense_Mutation | c.668N>A | p.Ser223Tyr | p.S223Y | O00451 | protein_coding | deleterious(0) | probably_damaging(0.963) | TCGA-A2-A0SY-01 | Breast | breast invasive carcinoma | Female | <65 | III/IV | Hormone Therapy | arimidex | SD | |
| GFRA2 | SNV | Missense_Mutation | novel | c.618N>T | p.Gln206His | p.Q206H | O00451 | protein_coding | deleterious(0.04) | probably_damaging(0.924) | TCGA-AN-A046-01 | Breast | breast invasive carcinoma | Female | >=65 | I/II | Unknown | Unknown | SD |
| GFRA2 | SNV | Missense_Mutation | c.559C>T | p.Arg187Cys | p.R187C | O00451 | protein_coding | deleterious(0.01) | possibly_damaging(0.867) | TCGA-AN-A0AK-01 | Breast | breast invasive carcinoma | Female | >=65 | I/II | Unknown | Unknown | SD | |
| GFRA2 | SNV | Missense_Mutation | novel | c.1148N>G | p.Ser383Cys | p.S383C | O00451 | protein_coding | deleterious(0.03) | possibly_damaging(0.533) | TCGA-BH-A0B6-01 | Breast | breast invasive carcinoma | Female | <65 | I/II | Unknown | Unknown | SD |
| GFRA2 | SNV | Missense_Mutation | novel | c.745N>A | p.Pro249Thr | p.P249T | O00451 | protein_coding | deleterious(0.02) | probably_damaging(0.949) | TCGA-D8-A27V-01 | Breast | breast invasive carcinoma | Female | <65 | I/II | Hormone Therapy | tamoxiphen | SD |
| GFRA2 | SNV | Missense_Mutation | novel | c.734N>T | p.Asp245Val | p.D245V | O00451 | protein_coding | deleterious(0) | possibly_damaging(0.761) | TCGA-EW-A1P0-01 | Breast | breast invasive carcinoma | Female | <65 | I/II | Hormone Therapy | arimidex | PD |
| GFRA2 | SNV | Missense_Mutation | novel | c.593N>A | p.Arg198His | p.R198H | O00451 | protein_coding | deleterious(0) | benign(0.047) | TCGA-2W-A8YY-01 | Cervix | cervical & endocervical cancer | Female | <65 | I/II | Chemotherapy | cisplatin | CR |
| GFRA2 | SNV | Missense_Mutation | novel | c.178N>G | p.Leu60Val | p.L60V | O00451 | protein_coding | deleterious(0.01) | possibly_damaging(0.622) | TCGA-C5-A2M1-01 | Cervix | cervical & endocervical cancer | Female | <65 | I/II | Unknown | Unknown | SD |
| GFRA2 | SNV | Missense_Mutation | c.526N>G | p.Lys176Glu | p.K176E | O00451 | protein_coding | deleterious(0.01) | benign(0.06) | TCGA-C5-A7UH-01 | Cervix | cervical & endocervical cancer | Female | <65 | III/IV | Chemotherapy | cisplatin | SD |
| Page: 1 2 3 4 5 6 7 8 |
Top |
Related drugs of malignant transformation related genes |
| Identification of chemicals and drugs interact with genes involved in malignant transfromation |
| (DGIdb 4.0) |
| Entrez ID | Symbol | Category | Interaction Types | Drug Claim Name | Drug Name | PMIDs |
| Page: 1 |

Copyright 2023-Present -The University of Texas Health Science Center at Houston |