
|
|||||
|
 | |
| |
| |
| |
| |
| |
|
Gene: FAM160A1 |
Gene summary for FAM160A1 |
| Gene information | Species | Human | Gene symbol | FAM160A1 | Gene ID | 729830 |
| Gene name | FHF complex subunit HOOK interacting protein 1A | |
| Gene Alias | FAM160A1 | |
| Cytomap | 4q31.3 | |
| Gene Type | protein-coding | GO ID | GO:0008104 | UniProtAcc | Q05DH4 |
Top |
Malignant transformation analysis |
| Identification of the aberrant gene expression in precancerous and cancerous lesions by comparing the gene expression of stem-like cells in diseased tissues with normal stem cells |
| Entrez ID | Symbol | Replicates | Species | Organ | Tissue | Adj P-value | Log2FC | Malignancy |
| 729830 | FAM160A1 | CCI_1 | Human | Cervix | CC | 1.31e-10 | 1.30e+00 | 0.528 |
| 729830 | FAM160A1 | CCI_2 | Human | Cervix | CC | 3.46e-14 | 1.58e+00 | 0.5249 |
| 729830 | FAM160A1 | CCI_3 | Human | Cervix | CC | 2.56e-20 | 1.20e+00 | 0.516 |
| 729830 | FAM160A1 | HTA11_3410_2000001011 | Human | Colorectum | AD | 7.17e-18 | -5.83e-01 | 0.0155 |
| 729830 | FAM160A1 | HTA11_347_2000001011 | Human | Colorectum | AD | 4.07e-16 | 8.51e-01 | -0.1954 |
| 729830 | FAM160A1 | HTA11_3361_2000001011 | Human | Colorectum | AD | 8.19e-03 | -3.92e-01 | -0.1207 |
| 729830 | FAM160A1 | HTA11_866_3004761011 | Human | Colorectum | AD | 1.07e-14 | -6.40e-01 | 0.096 |
| 729830 | FAM160A1 | HTA11_8622_2000001021 | Human | Colorectum | SER | 5.75e-04 | -5.63e-01 | 0.0528 |
| 729830 | FAM160A1 | HTA11_6801_2000001011 | Human | Colorectum | SER | 1.46e-03 | -6.68e-01 | 0.0171 |
| 729830 | FAM160A1 | HTA11_10711_2000001011 | Human | Colorectum | AD | 1.30e-03 | -4.38e-01 | 0.0338 |
| 729830 | FAM160A1 | HTA11_99999970781_79442 | Human | Colorectum | MSS | 4.87e-02 | -4.18e-01 | 0.294 |
| 729830 | FAM160A1 | HTA11_99999973899_84307 | Human | Colorectum | MSS | 1.54e-06 | -6.44e-01 | 0.2585 |
| 729830 | FAM160A1 | HTA11_99999974143_84620 | Human | Colorectum | MSS | 6.87e-31 | -8.61e-01 | 0.3005 |
| 729830 | FAM160A1 | F007 | Human | Colorectum | FAP | 2.48e-03 | -2.56e-01 | 0.1176 |
| 729830 | FAM160A1 | A001-C-207 | Human | Colorectum | FAP | 8.22e-03 | -1.01e-01 | 0.1278 |
| 729830 | FAM160A1 | A015-C-203 | Human | Colorectum | FAP | 1.13e-23 | -3.29e-01 | -0.1294 |
| 729830 | FAM160A1 | A015-C-204 | Human | Colorectum | FAP | 2.00e-04 | -1.39e-01 | -0.0228 |
| 729830 | FAM160A1 | A014-C-040 | Human | Colorectum | FAP | 3.89e-04 | 9.99e-02 | -0.1184 |
| 729830 | FAM160A1 | A002-C-201 | Human | Colorectum | FAP | 7.22e-15 | -3.42e-01 | 0.0324 |
| 729830 | FAM160A1 | A001-C-119 | Human | Colorectum | FAP | 9.88e-08 | -3.55e-01 | -0.1557 |
| Page: 1 2 3 4 5 6 |
| Tissue | Expression Dynamics | Abbreviation |
| Cervix | 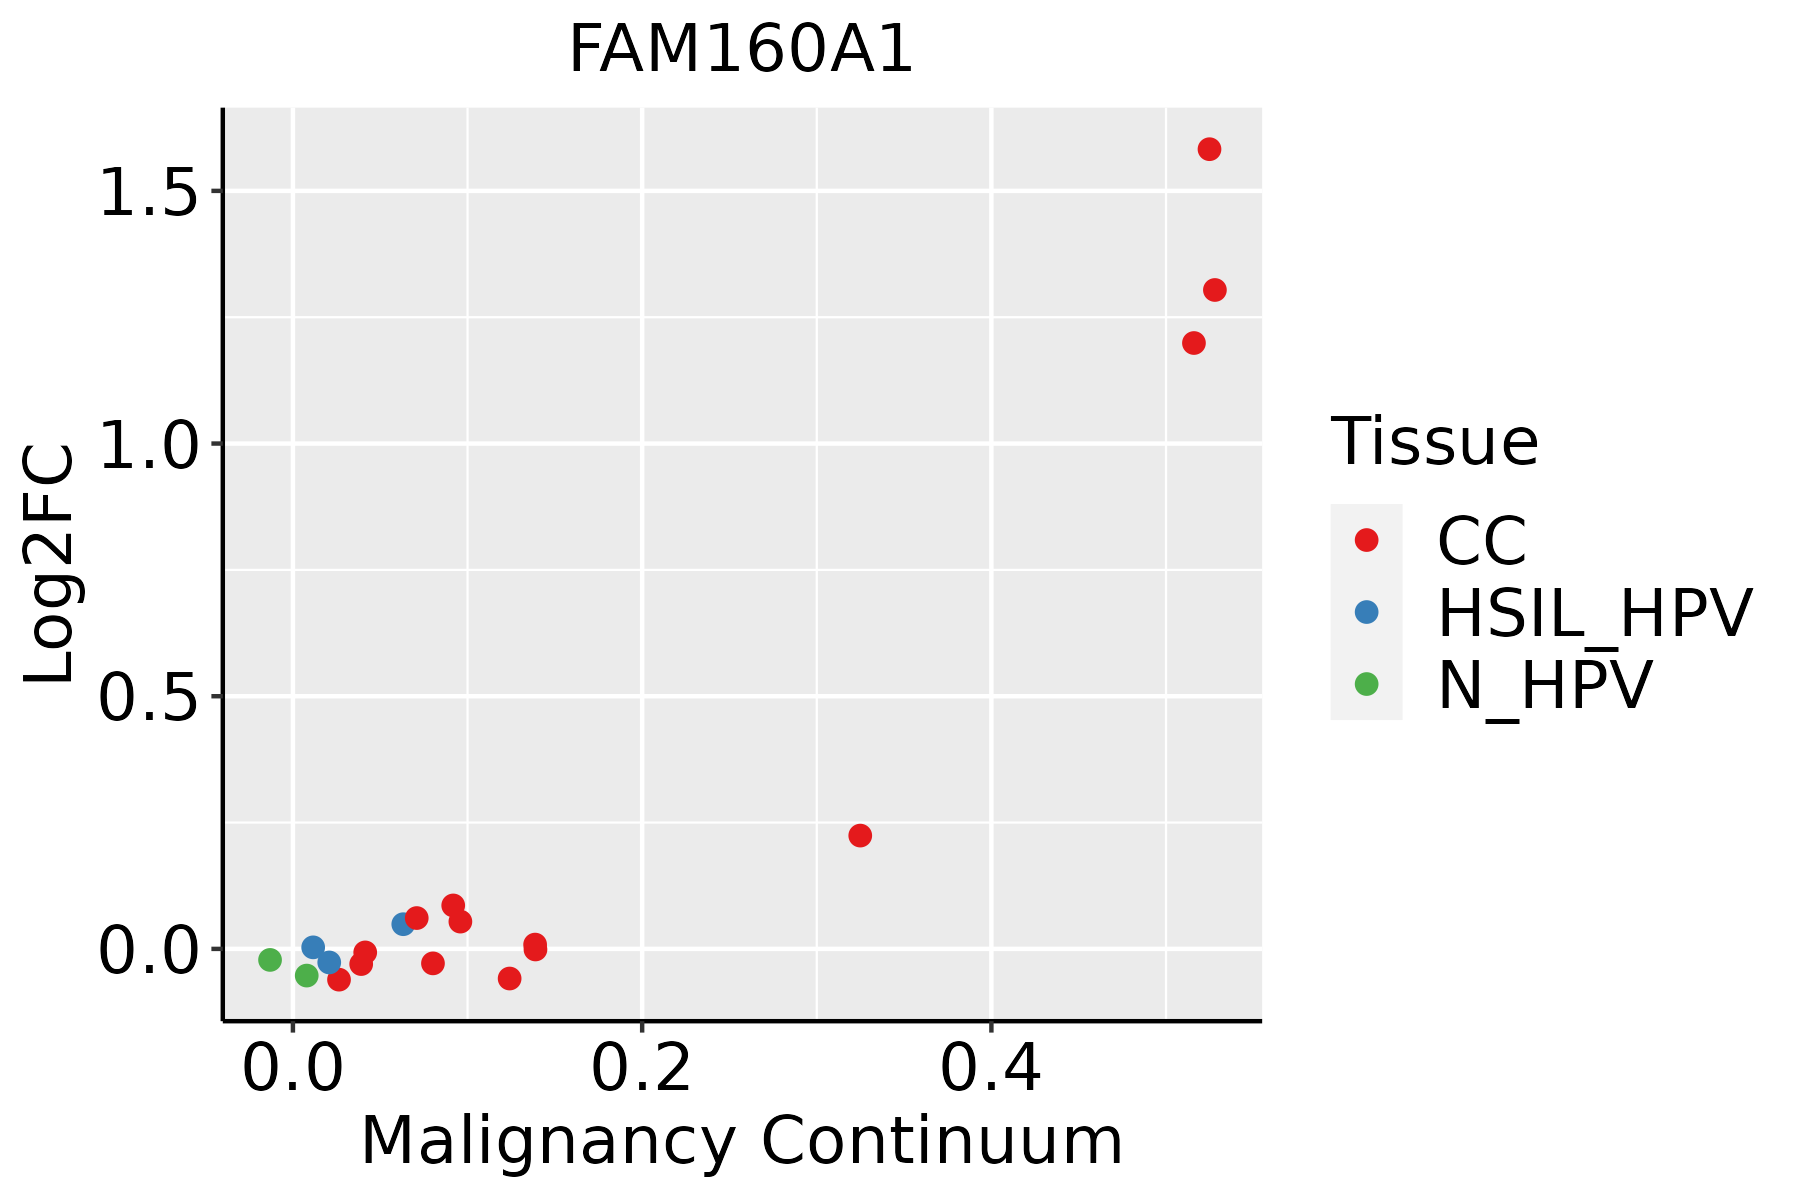 | CC: Cervix cancer |
| HSIL_HPV: HPV-infected high-grade squamous intraepithelial lesions | ||
| N_HPV: HPV-infected normal cervix | ||
| Colorectum (GSE201348) |  | FAP: Familial adenomatous polyposis |
| CRC: Colorectal cancer | ||
| Colorectum (HTA11) |  | AD: Adenomas |
| SER: Sessile serrated lesions | ||
| MSI-H: Microsatellite-high colorectal cancer | ||
| MSS: Microsatellite stable colorectal cancer | ||
| Endometrium | 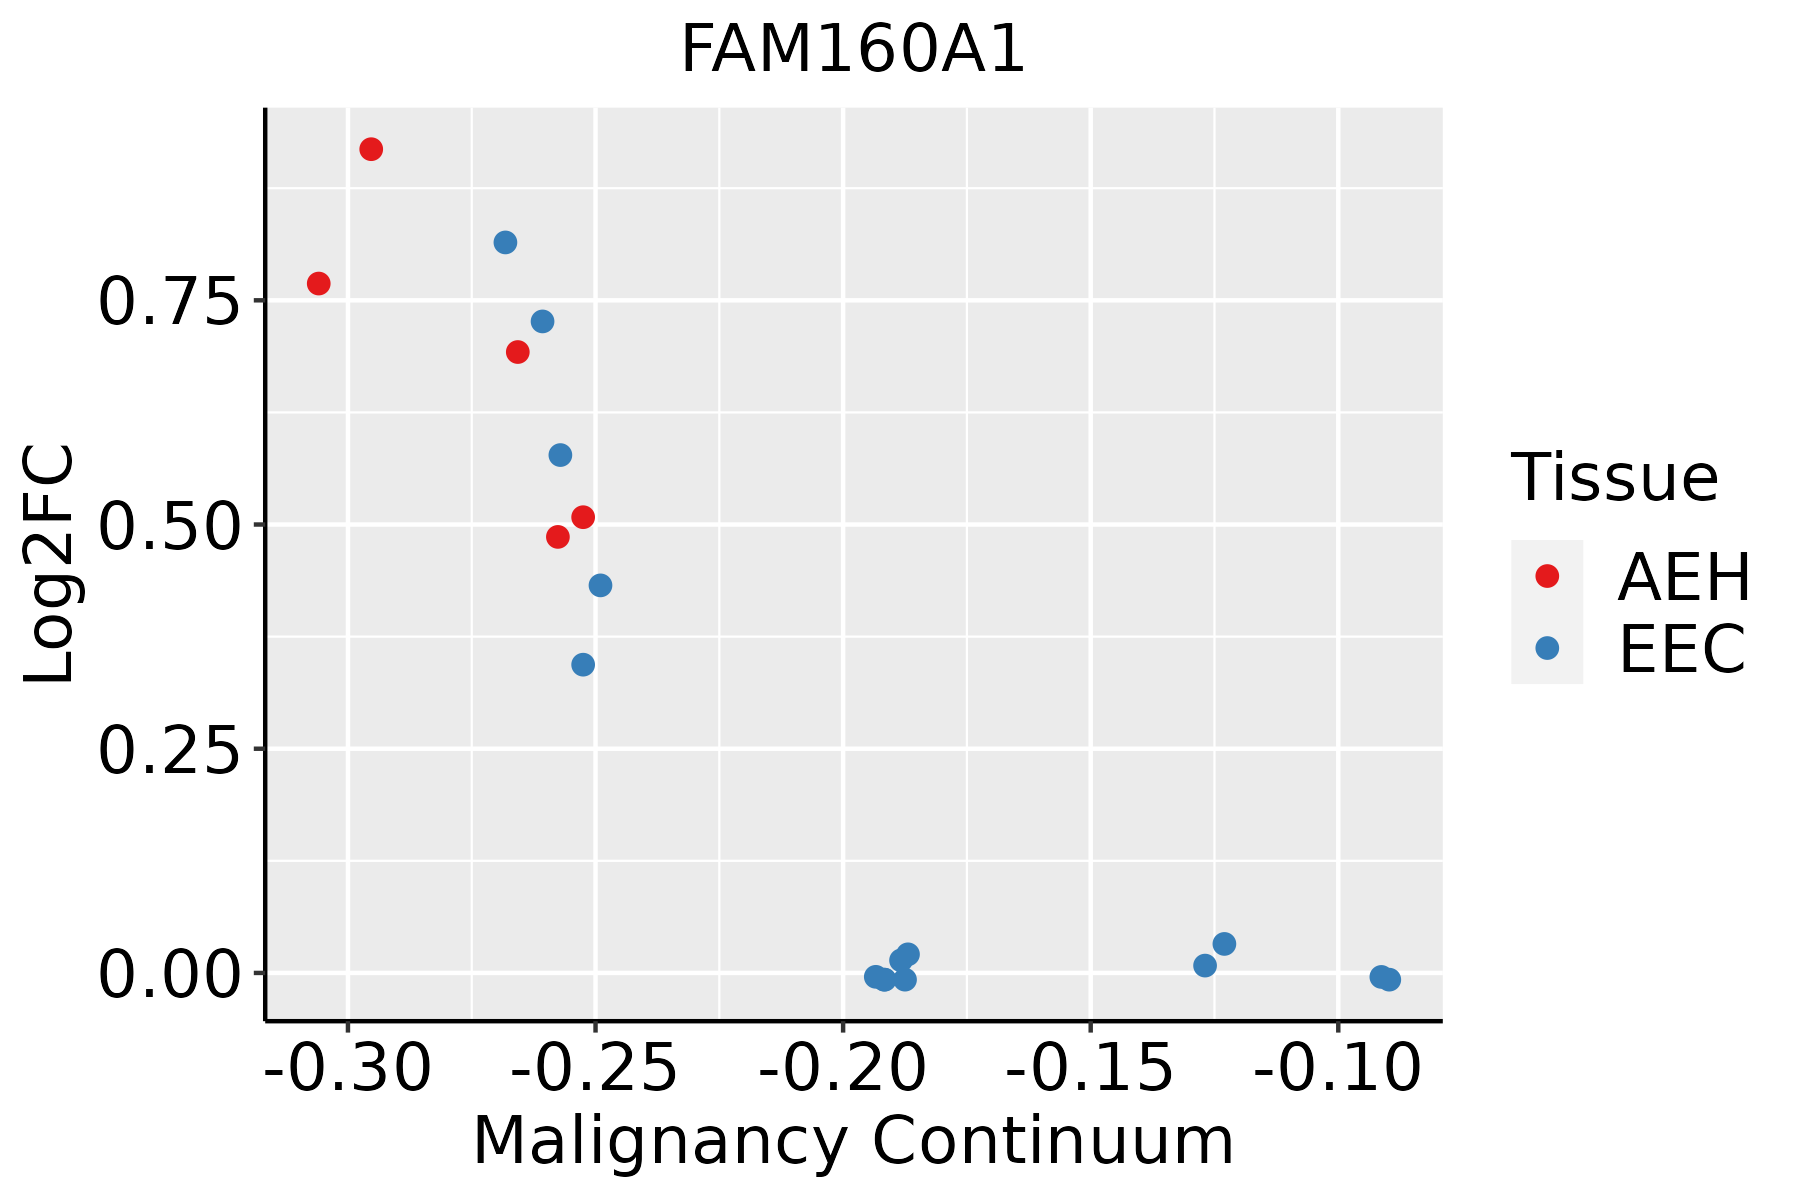 | AEH: Atypical endometrial hyperplasia |
| EEC: Endometrioid Cancer | ||
| GC | 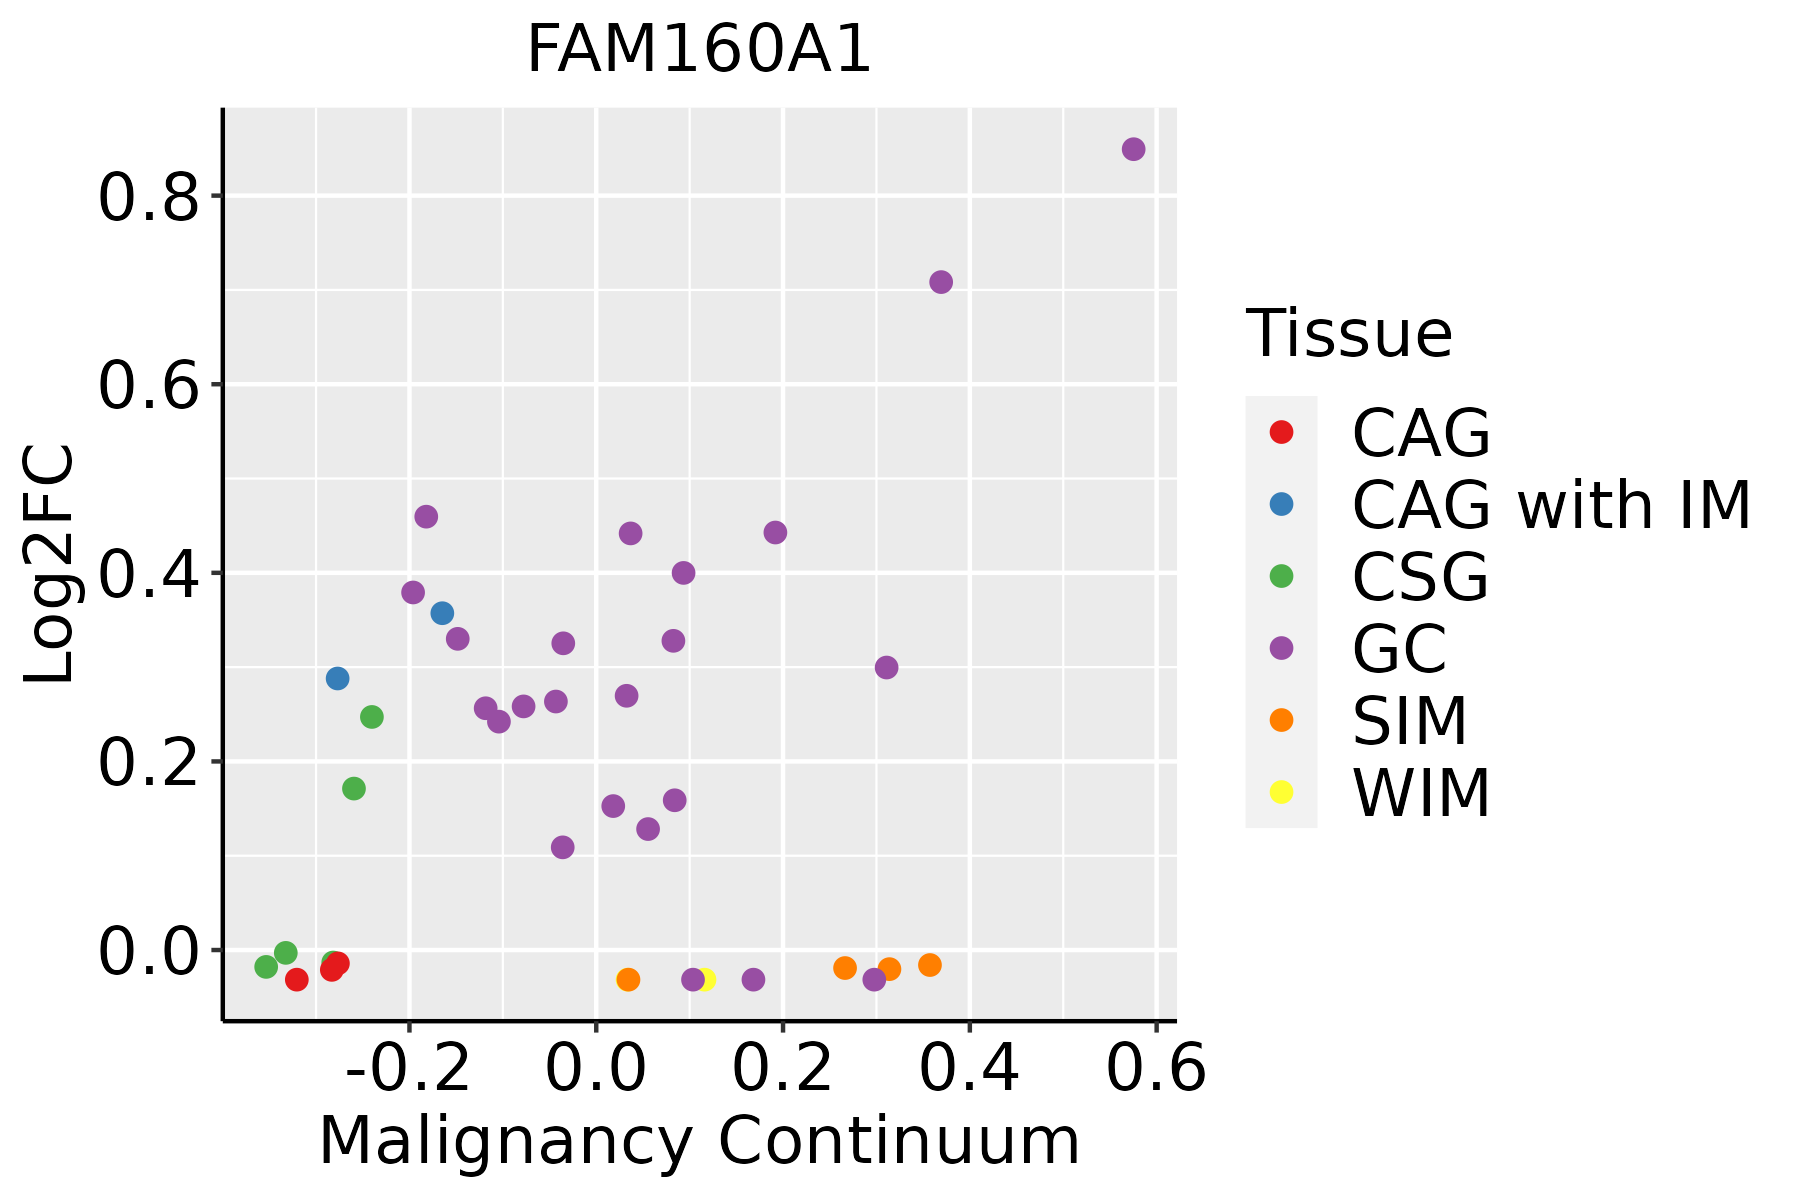 | CAG: Chronic atrophic gastritis |
| CAG with IM: Chronic atrophic gastritis with intestinal metaplasia | ||
| CSG: Chronic superficial gastritis | ||
| GC: Gastric cancer | ||
| SIM: Severe intestinal metaplasia | ||
| WIM: Wild intestinal metaplasia | ||
| Lung | 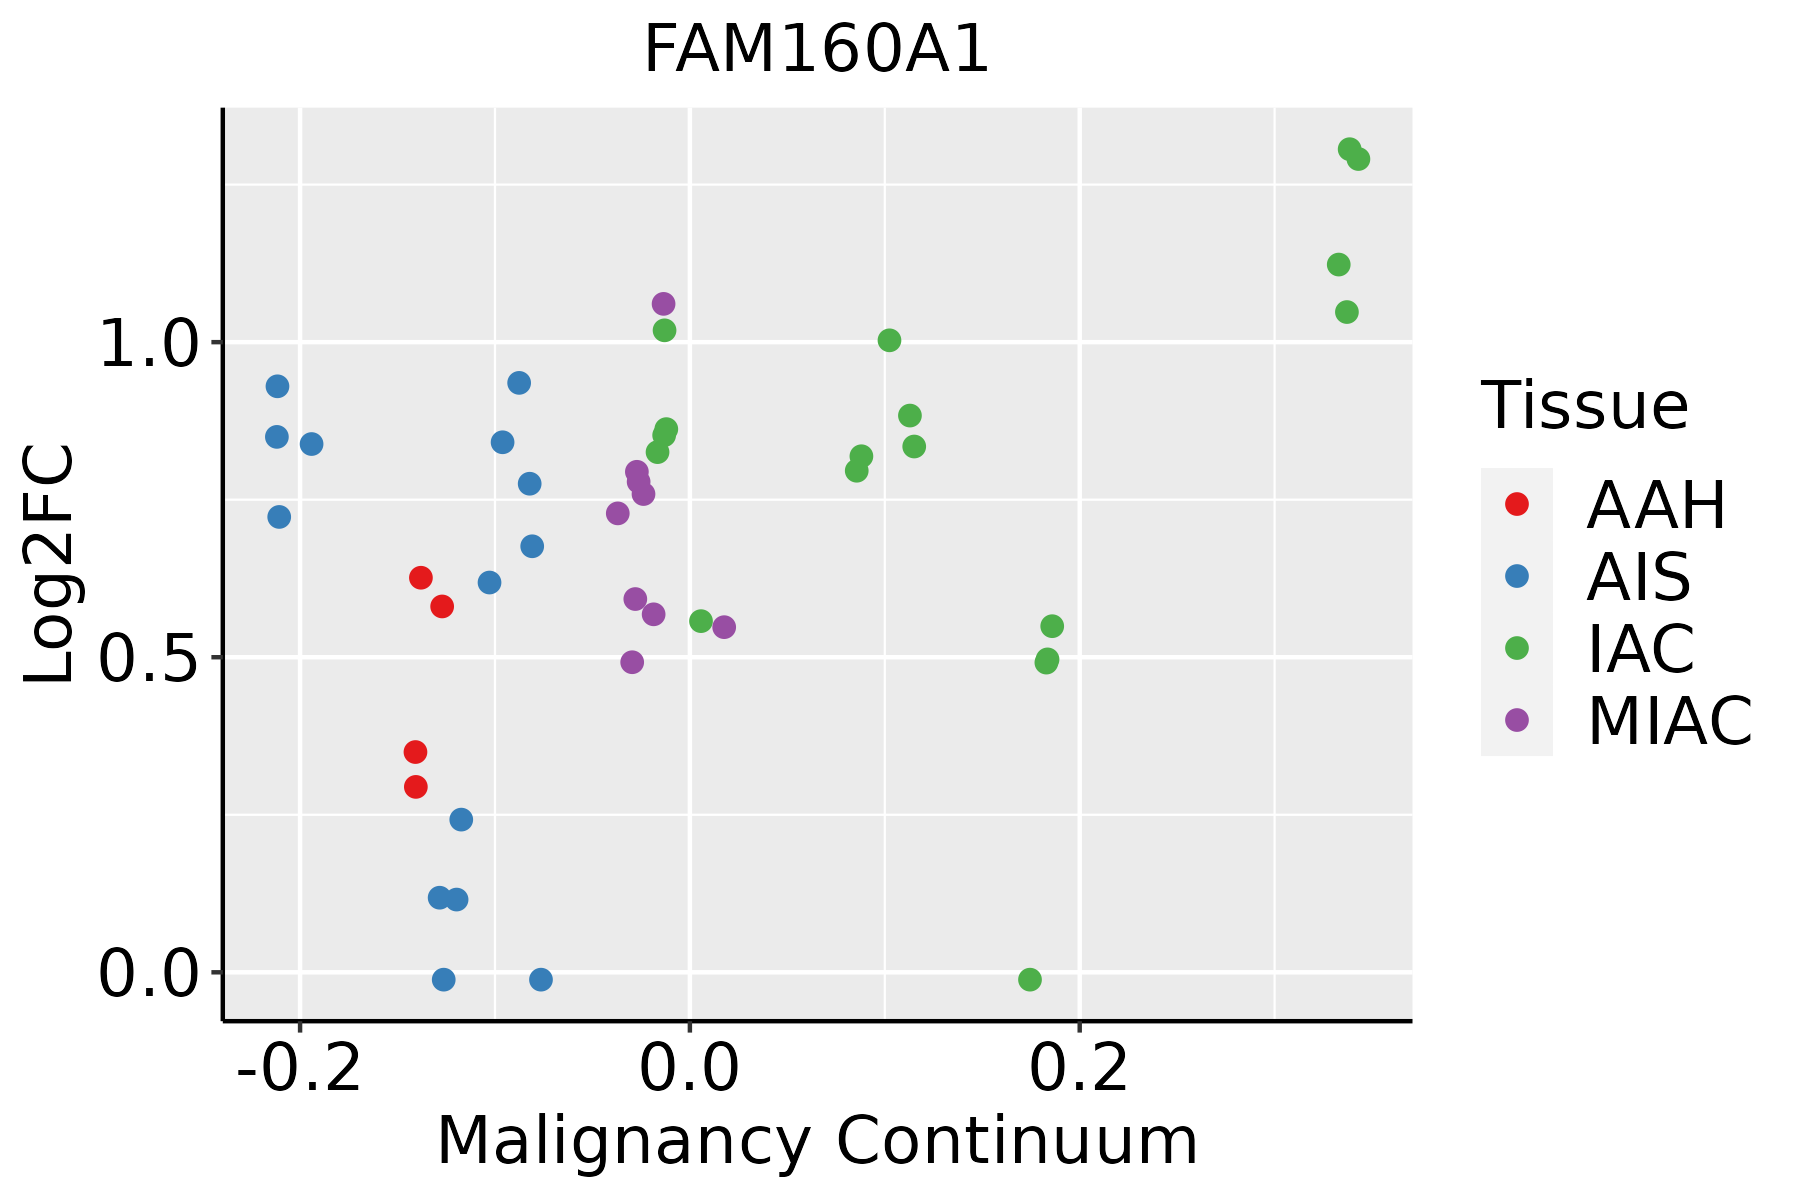 | AAH: Atypical adenomatous hyperplasia |
| AIS: Adenocarcinoma in situ | ||
| IAC: Invasive lung adenocarcinoma | ||
| MIA: Minimally invasive adenocarcinoma | ||
| Prostate |  | BPH: Benign Prostatic Hyperplasia |
| Skin | 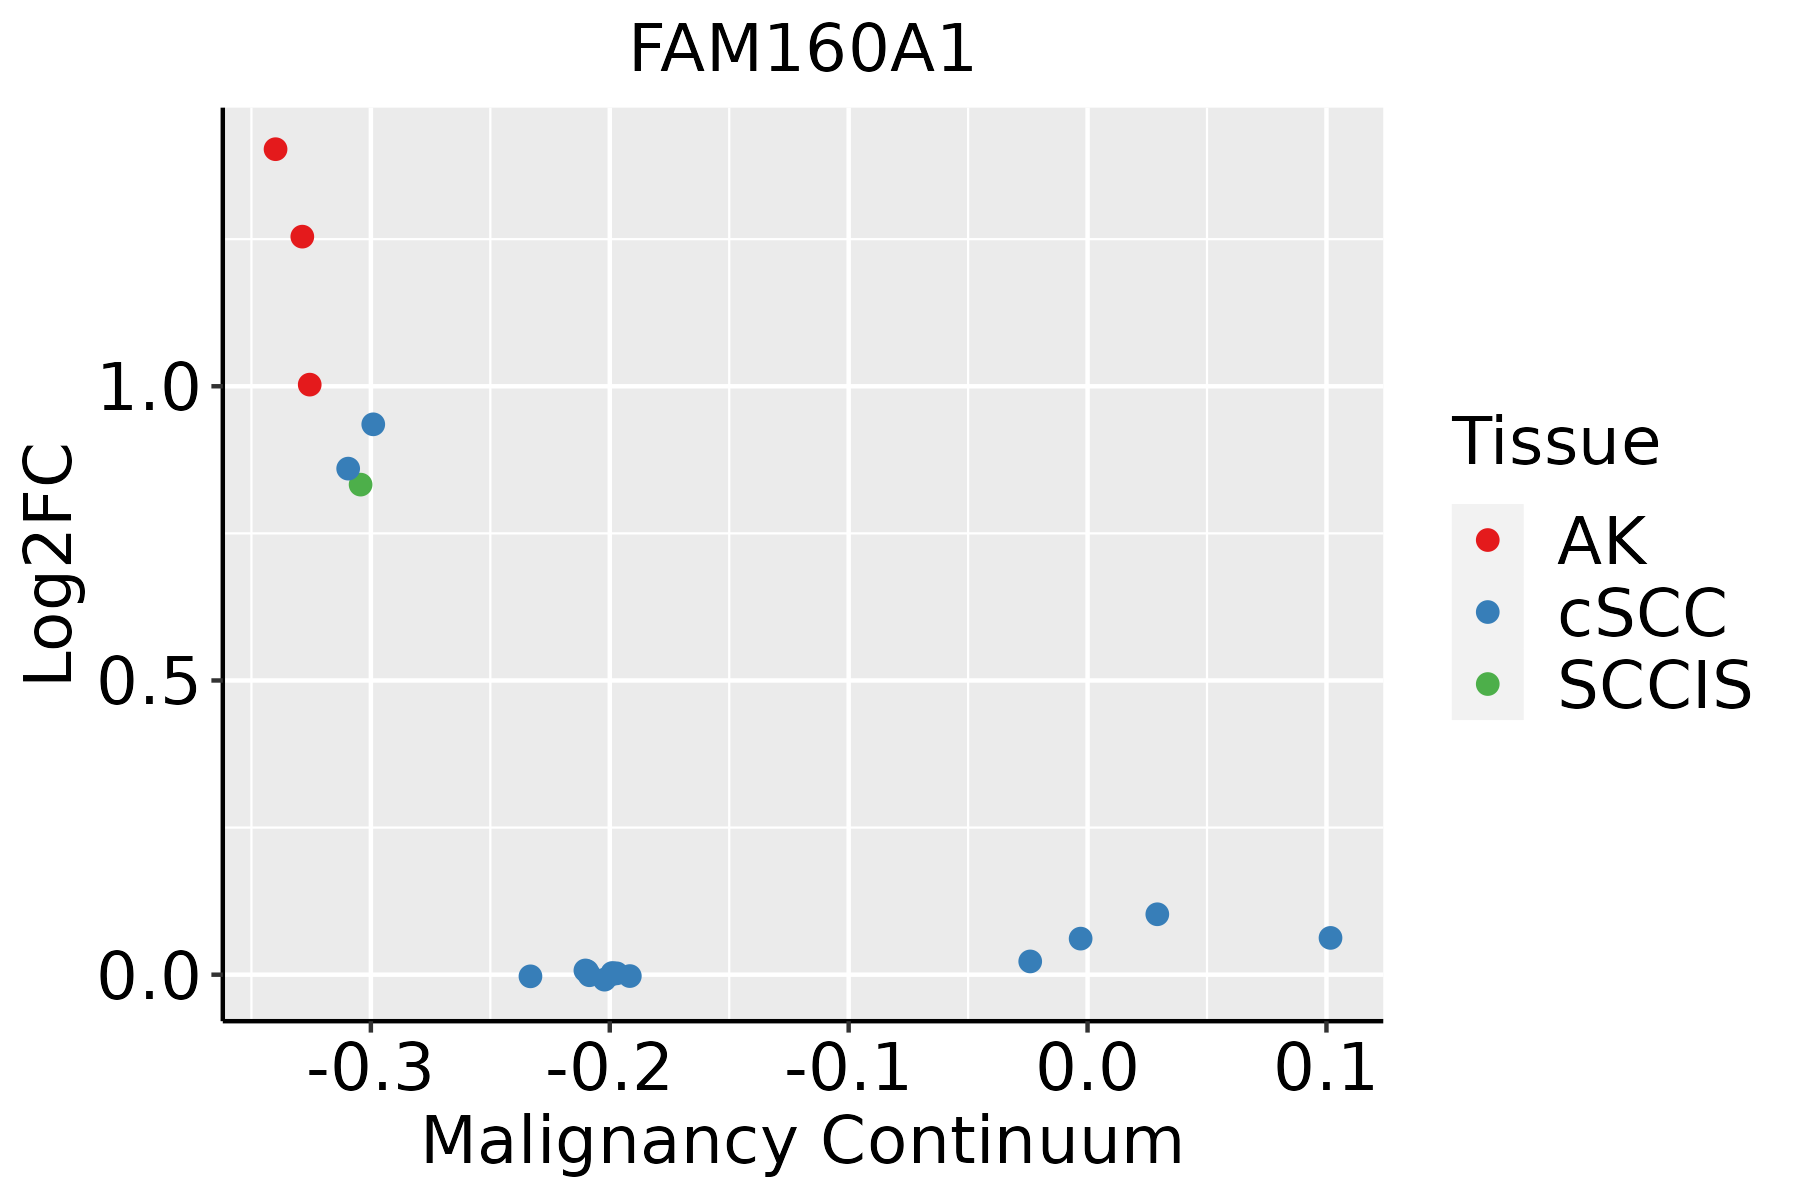 | AK: Actinic keratosis |
| cSCC: Cutaneous squamous cell carcinoma | ||
| SCCIS:squamous cell carcinoma in situ |
| ∗log2FC in expression of this searched gene in stem-like cells from each diseased tissue sample relative to stem-like cells in normal samples in each tissue plotted against the malignancy continuum. Samples are colored based on if they are from different disease stage. |
Top |
Malignant transformation related pathway analysis |
| Find out the enriched GO biological processes and KEGG pathways involved in transition from healthy to precancer to cancer |
| Tissue | Disease Stage | Enriched GO biological Processes |
| Thyroid | PTC |  |
| Thyroid | goiters |  |
| Thyroid | ATC |  |
| ∗Top 15 enriched GO BP terms are showed in the bar plot of each disease state in each tissue. Each row represents a significant GO biological process which is colored according to the -log10(p.adjust). |
| Page: 1 2 3 4 5 6 7 8 9 |
| GO ID | Tissue | Disease Stage | Description | Gene Ratio | Bg Ratio | pvalue | p.adjust | Count |
| Page: 1 |
| Pathway ID | Tissue | Disease Stage | Description | Gene Ratio | Bg Ratio | pvalue | p.adjust | qvalue | Count |
| Page: 1 |
Top |
Cell-cell communication analysis |
| Identification of potential cell-cell interactions between two cell types and their ligand-receptor pairs for different disease states |
| Ligand | Receptor | LRpair | Pathway | Tissue | Disease Stage |
| Page: 1 |
Top |
Single-cell gene regulatory network inference analysis |
| Find out the significant the regulons (TFs) and the target genes of each regulon across cell types for different disease states |
| TF | Cell Type | Tissue | Disease Stage | Target Gene | RSS | Regulon Activity |
| ∗The dot plots of a searched regulon are shown for all cell subpopulations in each disease state of each tissue based on the regulon specific score inferred using pySCENIC and by calculating the average expression. |
| Page: 1 |
Top |
Somatic mutation of malignant transformation related genes |
| Annotation of somatic variants for genes involved in malignant transformation |
| Hugo Symbol | Variant Class | Variant Classification | dbSNP RS | HGVSc | HGVSp | HGVSp Short | SWISSPROT | BIOTYPE | SIFT | PolyPhen | Tumor Sample Barcode | Tissue | Histology | Sex | Age | Stage | Therapy Types | Drugs | Outcome |
| FAM160A1 | SNV | Missense_Mutation | rs753532630 | c.389A>C | p.His130Pro | p.H130P | Q05DH4 | protein_coding | deleterious(0.03) | benign(0.099) | TCGA-A2-A25A-01 | Breast | breast invasive carcinoma | Female | <65 | I/II | Unspecific | Cytoxan | SD |
| FAM160A1 | SNV | Missense_Mutation | rs753532630 | c.389N>C | p.His130Pro | p.H130P | Q05DH4 | protein_coding | deleterious(0.03) | benign(0.099) | TCGA-AC-A23H-01 | Breast | breast invasive carcinoma | Female | >=65 | I/II | Unknown | Unknown | PD |
| FAM160A1 | SNV | Missense_Mutation | rs369099144 | c.1144C>T | p.Arg382Trp | p.R382W | Q05DH4 | protein_coding | deleterious(0.01) | probably_damaging(0.999) | TCGA-AN-A046-01 | Breast | breast invasive carcinoma | Female | >=65 | I/II | Unknown | Unknown | SD |
| FAM160A1 | SNV | Missense_Mutation | c.2971G>A | p.Glu991Lys | p.E991K | Q05DH4 | protein_coding | tolerated(0.8) | benign(0.001) | TCGA-BH-A0W7-01 | Breast | breast invasive carcinoma | Female | <65 | I/II | Chemotherapy | taxotere | CR | |
| FAM160A1 | SNV | Missense_Mutation | c.1844N>C | p.Lys615Thr | p.K615T | Q05DH4 | protein_coding | deleterious(0) | benign(0.203) | TCGA-BH-A1ET-01 | Breast | breast invasive carcinoma | Female | <65 | I/II | Unknown | Unknown | SD | |
| FAM160A1 | SNV | Missense_Mutation | rs535242527 | c.208N>T | p.His70Tyr | p.H70Y | Q05DH4 | protein_coding | deleterious(0) | benign(0.076) | TCGA-D8-A1J8-01 | Breast | breast invasive carcinoma | Female | >=65 | I/II | Hormone Therapy | nolvadex | SD |
| FAM160A1 | SNV | Missense_Mutation | rs753532630 | c.389N>C | p.His130Pro | p.H130P | Q05DH4 | protein_coding | deleterious(0.03) | benign(0.099) | TCGA-D8-A1XK-01 | Breast | breast invasive carcinoma | Female | <65 | I/II | Chemotherapy | doxorubicine+cyclophosphamide | SD |
| FAM160A1 | SNV | Missense_Mutation | rs753532630 | c.389A>C | p.His130Pro | p.H130P | Q05DH4 | protein_coding | deleterious(0.03) | benign(0.099) | TCGA-E9-A1NG-01 | Breast | breast invasive carcinoma | Female | <65 | I/II | Hormone Therapy | letrozole | SD |
| FAM160A1 | insertion | Nonsense_Mutation | novel | c.318_319insCTGGCCTACTGACCCCTCTCGGTGAATGAAGGGAATC | p.Arg107LeufsTer4 | p.R107Lfs*4 | Q05DH4 | protein_coding | TCGA-AR-A0U0-01 | Breast | breast invasive carcinoma | Female | >=65 | I/II | Unknown | Unknown | SD | ||
| FAM160A1 | deletion | Frame_Shift_Del | novel | c.724delN | p.Cys243ValfsTer19 | p.C243Vfs*19 | Q05DH4 | protein_coding | TCGA-D8-A27V-01 | Breast | breast invasive carcinoma | Female | <65 | I/II | Hormone Therapy | tamoxiphen | SD |
| Page: 1 2 3 4 5 6 7 |
Top |
Related drugs of malignant transformation related genes |
| Identification of chemicals and drugs interact with genes involved in malignant transfromation |
| (DGIdb 4.0) |
| Entrez ID | Symbol | Category | Interaction Types | Drug Claim Name | Drug Name | PMIDs |
| Page: 1 |

Copyright 2023-Present -The University of Texas Health Science Center at Houston |