
|
|||||
|
 | |
| |
| |
| |
| |
| |
|
Gene: EPRS1 |
Gene summary for EPRS1 |
| Gene information | Species | Human | Gene symbol | EPRS1 | Gene ID | 2058 |
| Gene name | glutamyl-prolyl-tRNA synthetase 1 | |
| Gene Alias | EARS | |
| Cytomap | 1q41 | |
| Gene Type | protein-coding | GO ID | GO:0002376 | UniProtAcc | P07814 |
Top |
Malignant transformation analysis |
| Identification of the aberrant gene expression in precancerous and cancerous lesions by comparing the gene expression of stem-like cells in diseased tissues with normal stem cells |
| Entrez ID | Symbol | Replicates | Species | Organ | Tissue | Adj P-value | Log2FC | Malignancy |
| 2058 | EPRS1 | HTA11_3410_2000001011 | Human | Colorectum | AD | 1.22e-13 | 2.83e-01 | 0.0155 |
| 2058 | EPRS1 | HTA11_2487_2000001011 | Human | Colorectum | SER | 7.90e-11 | 2.66e-01 | -0.1808 |
| 2058 | EPRS1 | HTA11_1938_2000001011 | Human | Colorectum | AD | 4.60e-24 | 6.66e-01 | -0.0811 |
| 2058 | EPRS1 | HTA11_78_2000001011 | Human | Colorectum | AD | 3.57e-32 | 7.90e-01 | -0.1088 |
| 2058 | EPRS1 | HTA11_347_2000001011 | Human | Colorectum | AD | 1.10e-46 | 8.18e-01 | -0.1954 |
| 2058 | EPRS1 | HTA11_411_2000001011 | Human | Colorectum | SER | 5.61e-03 | 4.38e-01 | -0.2602 |
| 2058 | EPRS1 | HTA11_2112_2000001011 | Human | Colorectum | SER | 1.50e-04 | 3.07e-01 | -0.2196 |
| 2058 | EPRS1 | HTA11_3361_2000001011 | Human | Colorectum | AD | 8.67e-12 | 3.79e-01 | -0.1207 |
| 2058 | EPRS1 | HTA11_83_2000001011 | Human | Colorectum | SER | 8.95e-14 | 4.65e-01 | -0.1526 |
| 2058 | EPRS1 | HTA11_696_2000001011 | Human | Colorectum | AD | 4.02e-18 | 3.82e-01 | -0.1464 |
| 2058 | EPRS1 | HTA11_866_2000001011 | Human | Colorectum | AD | 3.52e-13 | 2.74e-01 | -0.1001 |
| 2058 | EPRS1 | HTA11_1391_2000001011 | Human | Colorectum | AD | 2.25e-23 | 6.66e-01 | -0.059 |
| 2058 | EPRS1 | HTA11_2992_2000001011 | Human | Colorectum | SER | 2.44e-09 | 5.85e-01 | -0.1706 |
| 2058 | EPRS1 | HTA11_5212_2000001011 | Human | Colorectum | AD | 1.00e-07 | 3.63e-01 | -0.2061 |
| 2058 | EPRS1 | HTA11_5216_2000001011 | Human | Colorectum | SER | 3.22e-05 | 4.15e-01 | -0.1462 |
| 2058 | EPRS1 | HTA11_546_2000001011 | Human | Colorectum | AD | 1.01e-16 | 5.31e-01 | -0.0842 |
| 2058 | EPRS1 | HTA11_7862_2000001011 | Human | Colorectum | AD | 3.18e-15 | 5.27e-01 | -0.0179 |
| 2058 | EPRS1 | HTA11_866_3004761011 | Human | Colorectum | AD | 5.80e-17 | 3.95e-01 | 0.096 |
| 2058 | EPRS1 | HTA11_4255_2000001011 | Human | Colorectum | SER | 2.49e-08 | 4.15e-01 | 0.0446 |
| 2058 | EPRS1 | HTA11_8622_2000001021 | Human | Colorectum | SER | 1.95e-07 | 3.65e-01 | 0.0528 |
| Page: 1 2 |
| Tissue | Expression Dynamics | Abbreviation |
| Colorectum (GSE201348) |  | FAP: Familial adenomatous polyposis |
| CRC: Colorectal cancer | ||
| Colorectum (HTA11) | 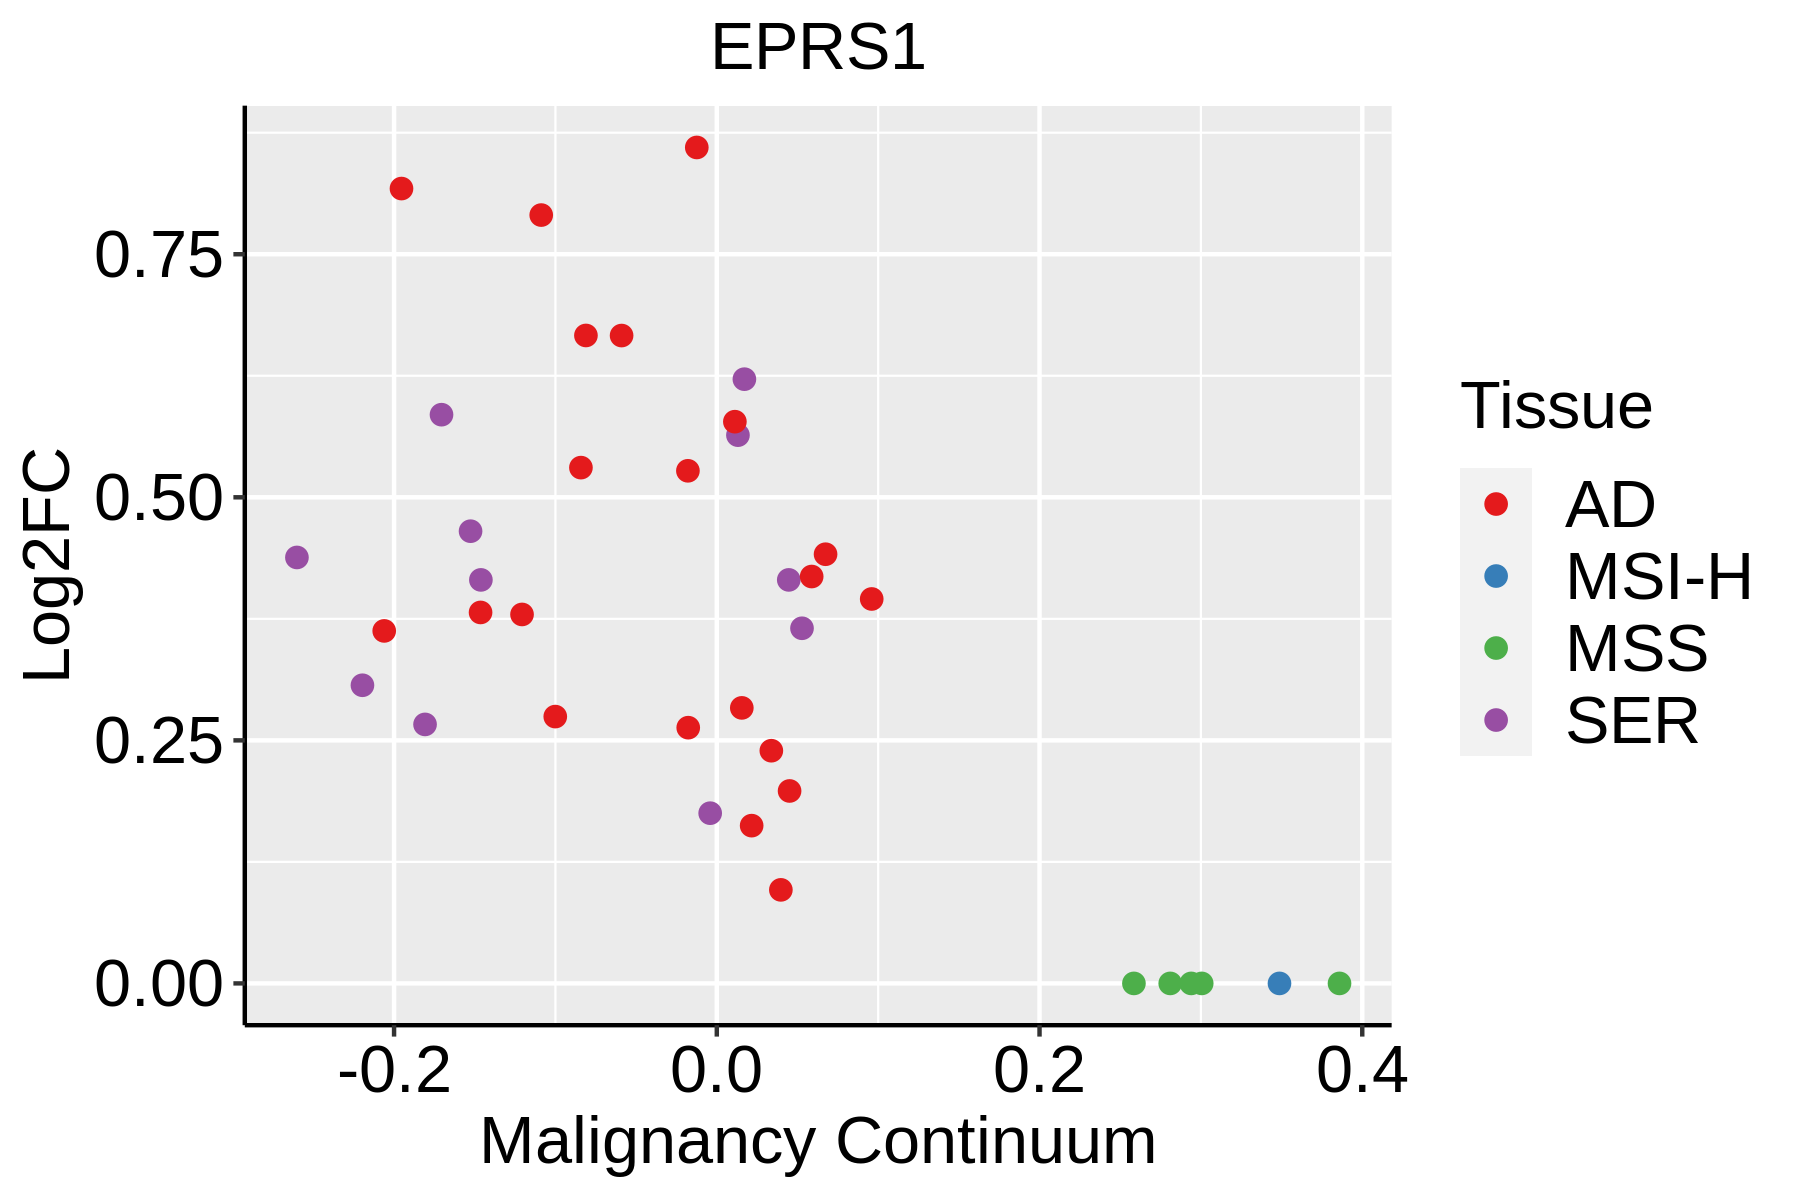 | AD: Adenomas |
| SER: Sessile serrated lesions | ||
| MSI-H: Microsatellite-high colorectal cancer | ||
| MSS: Microsatellite stable colorectal cancer |
| ∗log2FC in expression of this searched gene in stem-like cells from each diseased tissue sample relative to stem-like cells in normal samples in each tissue plotted against the malignancy continuum. Samples are colored based on if they are from different disease stage. |
Top |
Malignant transformation related pathway analysis |
| Find out the enriched GO biological processes and KEGG pathways involved in transition from healthy to precancer to cancer |
| Tissue | Disease Stage | Enriched GO biological Processes |
| Thyroid | PTC |  |
| Thyroid | goiters |  |
| Thyroid | ATC |  |
| ∗Top 15 enriched GO BP terms are showed in the bar plot of each disease state in each tissue. Each row represents a significant GO biological process which is colored according to the -log10(p.adjust). |
| Page: 1 2 3 4 5 6 7 8 9 |
| GO ID | Tissue | Disease Stage | Description | Gene Ratio | Bg Ratio | pvalue | p.adjust | Count |
| GO:0032868 | Colorectum | AD | response to insulin | 91/3918 | 264/18723 | 2.02e-07 | 8.48e-06 | 91 |
| GO:1901653 | Colorectum | AD | cellular response to peptide | 114/3918 | 359/18723 | 8.32e-07 | 2.88e-05 | 114 |
| GO:0032869 | Colorectum | AD | cellular response to insulin stimulus | 72/3918 | 203/18723 | 1.10e-06 | 3.68e-05 | 72 |
| GO:0006417 | Colorectum | AD | regulation of translation | 141/3918 | 468/18723 | 1.32e-06 | 4.22e-05 | 141 |
| GO:0071375 | Colorectum | AD | cellular response to peptide hormone stimulus | 95/3918 | 290/18723 | 1.50e-06 | 4.66e-05 | 95 |
| GO:0043434 | Colorectum | AD | response to peptide hormone | 126/3918 | 414/18723 | 2.70e-06 | 7.86e-05 | 126 |
| GO:0006418 | Colorectum | AD | tRNA aminoacylation for protein translation | 19/3918 | 41/18723 | 2.37e-04 | 3.03e-03 | 19 |
| GO:0043039 | Colorectum | AD | tRNA aminoacylation | 19/3918 | 44/18723 | 7.13e-04 | 7.21e-03 | 19 |
| GO:0043038 | Colorectum | AD | amino acid activation | 19/3918 | 45/18723 | 9.94e-04 | 9.28e-03 | 19 |
| GO:0006520 | Colorectum | AD | cellular amino acid metabolic process | 81/3918 | 284/18723 | 1.37e-03 | 1.19e-02 | 81 |
| GO:0010876 | Colorectum | AD | lipid localization | 120/3918 | 448/18723 | 1.59e-03 | 1.33e-02 | 120 |
| GO:0006869 | Colorectum | AD | lipid transport | 108/3918 | 398/18723 | 1.67e-03 | 1.39e-02 | 108 |
| GO:2000191 | Colorectum | AD | regulation of fatty acid transport | 14/3918 | 32/18723 | 3.03e-03 | 2.25e-02 | 14 |
| GO:00064181 | Colorectum | SER | tRNA aminoacylation for protein translation | 17/2897 | 41/18723 | 5.75e-05 | 1.35e-03 | 17 |
| GO:00328681 | Colorectum | SER | response to insulin | 65/2897 | 264/18723 | 6.70e-05 | 1.53e-03 | 65 |
| GO:19016531 | Colorectum | SER | cellular response to peptide | 83/2897 | 359/18723 | 8.03e-05 | 1.77e-03 | 83 |
| GO:00434341 | Colorectum | SER | response to peptide hormone | 93/2897 | 414/18723 | 9.61e-05 | 2.04e-03 | 93 |
| GO:00430391 | Colorectum | SER | tRNA aminoacylation | 17/2897 | 44/18723 | 1.64e-04 | 3.12e-03 | 17 |
| GO:00713751 | Colorectum | SER | cellular response to peptide hormone stimulus | 68/2897 | 290/18723 | 2.20e-04 | 3.89e-03 | 68 |
| GO:00430381 | Colorectum | SER | amino acid activation | 17/2897 | 45/18723 | 2.25e-04 | 3.91e-03 | 17 |
| Page: 1 2 |
| Pathway ID | Tissue | Disease Stage | Description | Gene Ratio | Bg Ratio | pvalue | p.adjust | qvalue | Count |
| Page: 1 |
Top |
Cell-cell communication analysis |
| Identification of potential cell-cell interactions between two cell types and their ligand-receptor pairs for different disease states |
| Ligand | Receptor | LRpair | Pathway | Tissue | Disease Stage |
| Page: 1 |
Top |
Single-cell gene regulatory network inference analysis |
| Find out the significant the regulons (TFs) and the target genes of each regulon across cell types for different disease states |
| TF | Cell Type | Tissue | Disease Stage | Target Gene | RSS | Regulon Activity |
| ∗The dot plots of a searched regulon are shown for all cell subpopulations in each disease state of each tissue based on the regulon specific score inferred using pySCENIC and by calculating the average expression. |
| Page: 1 |
Top |
Somatic mutation of malignant transformation related genes |
| Annotation of somatic variants for genes involved in malignant transformation |
| Hugo Symbol | Variant Class | Variant Classification | dbSNP RS | HGVSc | HGVSp | HGVSp Short | SWISSPROT | BIOTYPE | SIFT | PolyPhen | Tumor Sample Barcode | Tissue | Histology | Sex | Age | Stage | Therapy Types | Drugs | Outcome |
| Page: 1 |
Top |
Related drugs of malignant transformation related genes |
| Identification of chemicals and drugs interact with genes involved in malignant transfromation |
| (DGIdb 4.0) |
| Entrez ID | Symbol | Category | Interaction Types | Drug Claim Name | Drug Name | PMIDs |
| 2058 | EPRS1 | DRUGGABLE GENOME, ENZYME | HALOFUGINONE | HALOFUGINONE | ||
| 2058 | EPRS1 | DRUGGABLE GENOME, ENZYME | HT-100 | HALOFUGINONE |
| Page: 1 |

Copyright 2023-Present -The University of Texas Health Science Center at Houston |