
|
|||||
|
 | |
| |
| |
| |
| |
| |
|
Gene: CLDN3 |
Gene summary for CLDN3 |
| Gene information | Species | Human | Gene symbol | CLDN3 | Gene ID | 1365 |
| Gene name | claudin 3 | |
| Gene Alias | C7orf1 | |
| Cytomap | 7q11.23 | |
| Gene Type | protein-coding | GO ID | GO:0000902 | UniProtAcc | O15551 |
Top |
Malignant transformation analysis |
| Identification of the aberrant gene expression in precancerous and cancerous lesions by comparing the gene expression of stem-like cells in diseased tissues with normal stem cells |
| Entrez ID | Symbol | Replicates | Species | Organ | Tissue | Adj P-value | Log2FC | Malignancy |
| 1365 | CLDN3 | GSM4909285 | Human | Breast | IDC | 3.30e-04 | 3.53e-02 | 0.21 |
| 1365 | CLDN3 | GSM4909286 | Human | Breast | IDC | 1.64e-15 | -6.00e-01 | 0.1081 |
| 1365 | CLDN3 | GSM4909287 | Human | Breast | IDC | 5.37e-05 | 2.53e-01 | 0.2057 |
| 1365 | CLDN3 | GSM4909291 | Human | Breast | IDC | 2.83e-15 | 5.77e-01 | 0.1753 |
| 1365 | CLDN3 | GSM4909293 | Human | Breast | IDC | 6.49e-10 | 4.10e-01 | 0.1581 |
| 1365 | CLDN3 | GSM4909294 | Human | Breast | IDC | 3.75e-02 | -3.22e-05 | 0.2022 |
| 1365 | CLDN3 | GSM4909297 | Human | Breast | IDC | 2.04e-08 | 2.28e-02 | 0.1517 |
| 1365 | CLDN3 | GSM4909298 | Human | Breast | IDC | 8.57e-07 | -4.00e-01 | 0.1551 |
| 1365 | CLDN3 | GSM4909300 | Human | Breast | IDC | 3.46e-02 | 3.66e-01 | 0.0334 |
| 1365 | CLDN3 | GSM4909301 | Human | Breast | IDC | 2.04e-26 | 6.46e-01 | 0.1577 |
| 1365 | CLDN3 | GSM4909305 | Human | Breast | IDC | 5.47e-11 | 4.81e-01 | 0.0436 |
| 1365 | CLDN3 | GSM4909306 | Human | Breast | IDC | 5.21e-32 | 6.98e-01 | 0.1564 |
| 1365 | CLDN3 | GSM4909308 | Human | Breast | IDC | 4.33e-05 | -1.86e-01 | 0.158 |
| 1365 | CLDN3 | GSM4909309 | Human | Breast | IDC | 1.18e-04 | 2.85e-01 | 0.0483 |
| 1365 | CLDN3 | GSM4909311 | Human | Breast | IDC | 1.82e-22 | -5.21e-01 | 0.1534 |
| 1365 | CLDN3 | GSM4909312 | Human | Breast | IDC | 2.67e-04 | -3.08e-01 | 0.1552 |
| 1365 | CLDN3 | GSM4909315 | Human | Breast | IDC | 5.46e-12 | -5.52e-01 | 0.21 |
| 1365 | CLDN3 | GSM4909317 | Human | Breast | IDC | 1.26e-30 | 7.38e-01 | 0.1355 |
| 1365 | CLDN3 | GSM4909318 | Human | Breast | IDC | 1.86e-04 | 4.41e-01 | 0.2031 |
| 1365 | CLDN3 | GSM4909319 | Human | Breast | IDC | 7.69e-36 | 2.28e-01 | 0.1563 |
| Page: 1 2 3 4 5 6 7 8 9 10 |
| Tissue | Expression Dynamics | Abbreviation |
| Breast |  | IDC: Invasive ductal carcinoma |
| DCIS: Ductal carcinoma in situ | ||
| Precancer(BRCA1-mut): Precancerous lesion from BRCA1 mutation carriers | ||
| Colorectum (GSE201348) |  | FAP: Familial adenomatous polyposis |
| CRC: Colorectal cancer | ||
| Colorectum (HTA11) |  | AD: Adenomas |
| SER: Sessile serrated lesions | ||
| MSI-H: Microsatellite-high colorectal cancer | ||
| MSS: Microsatellite stable colorectal cancer | ||
| Endometrium | 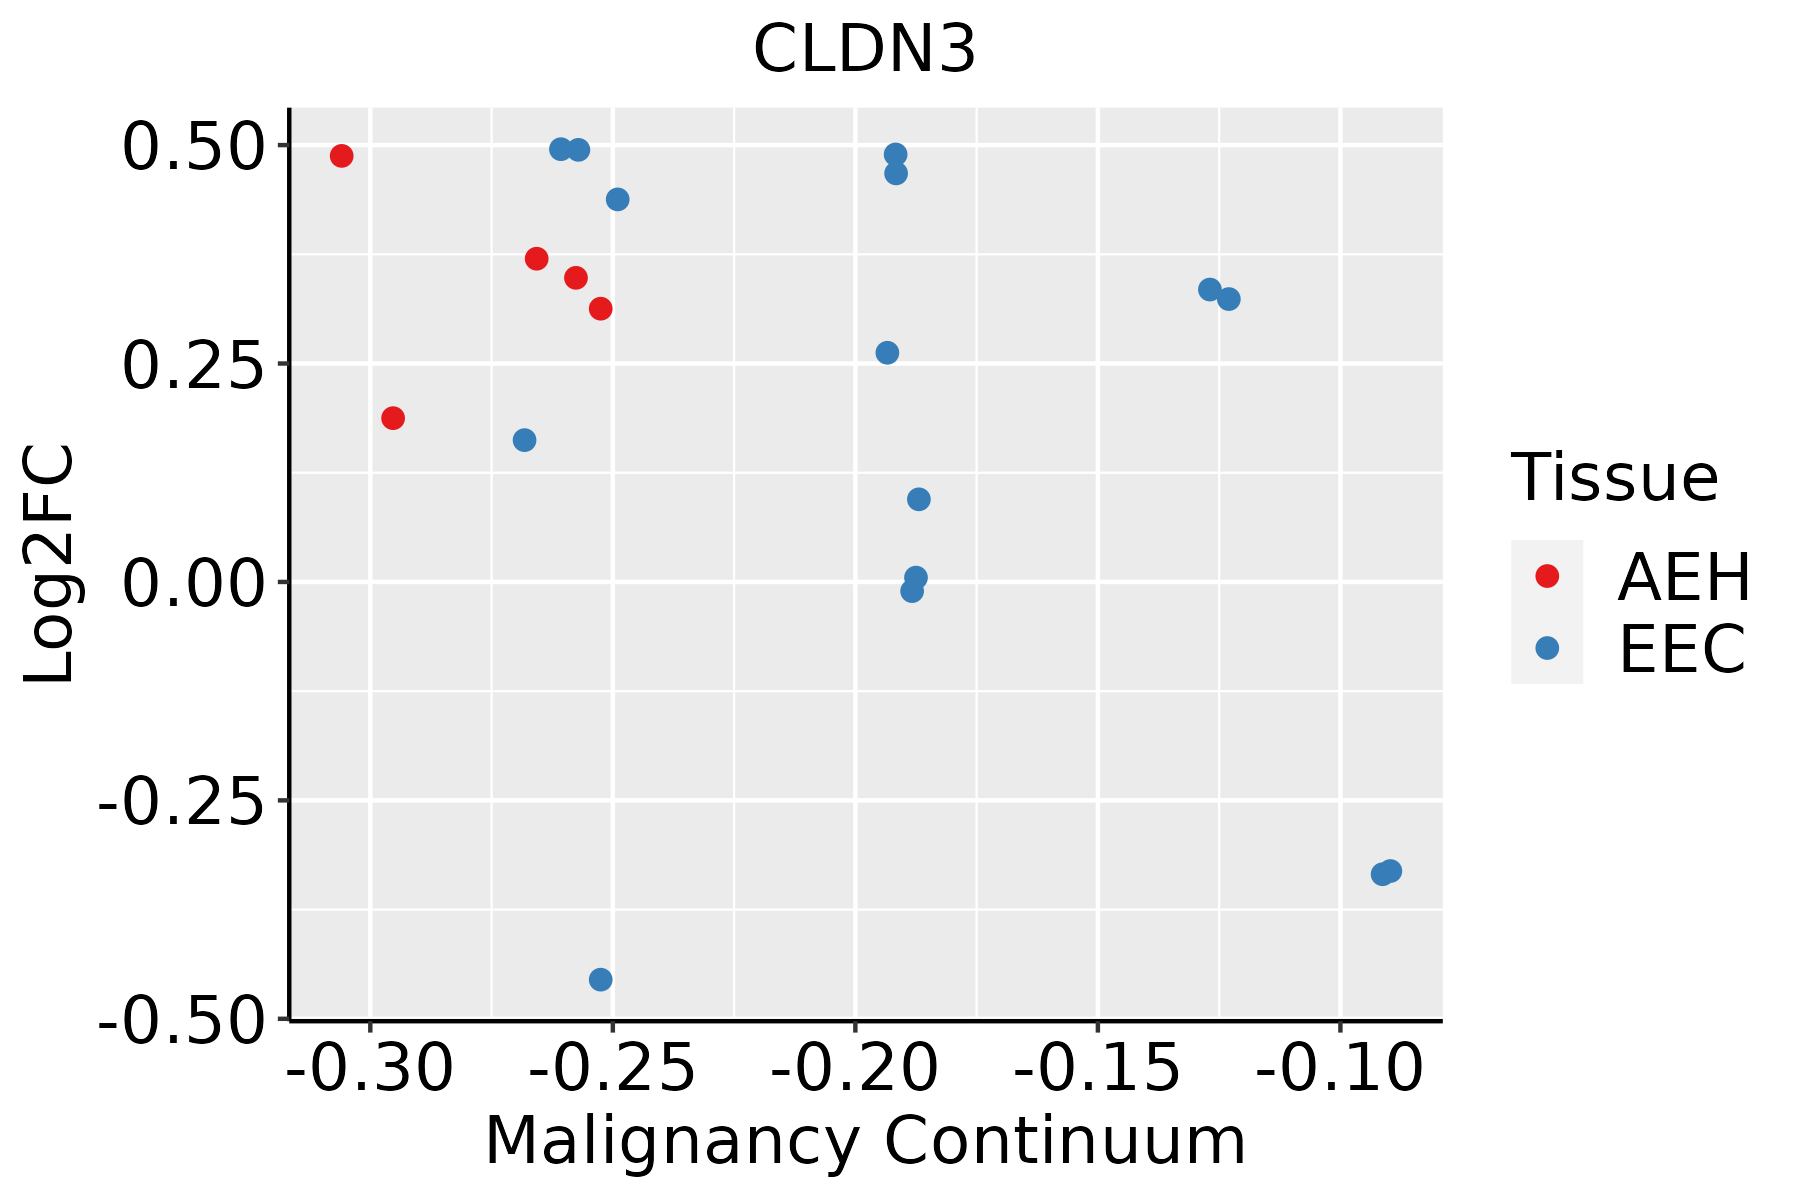 | AEH: Atypical endometrial hyperplasia |
| EEC: Endometrioid Cancer | ||
| Esophagus | 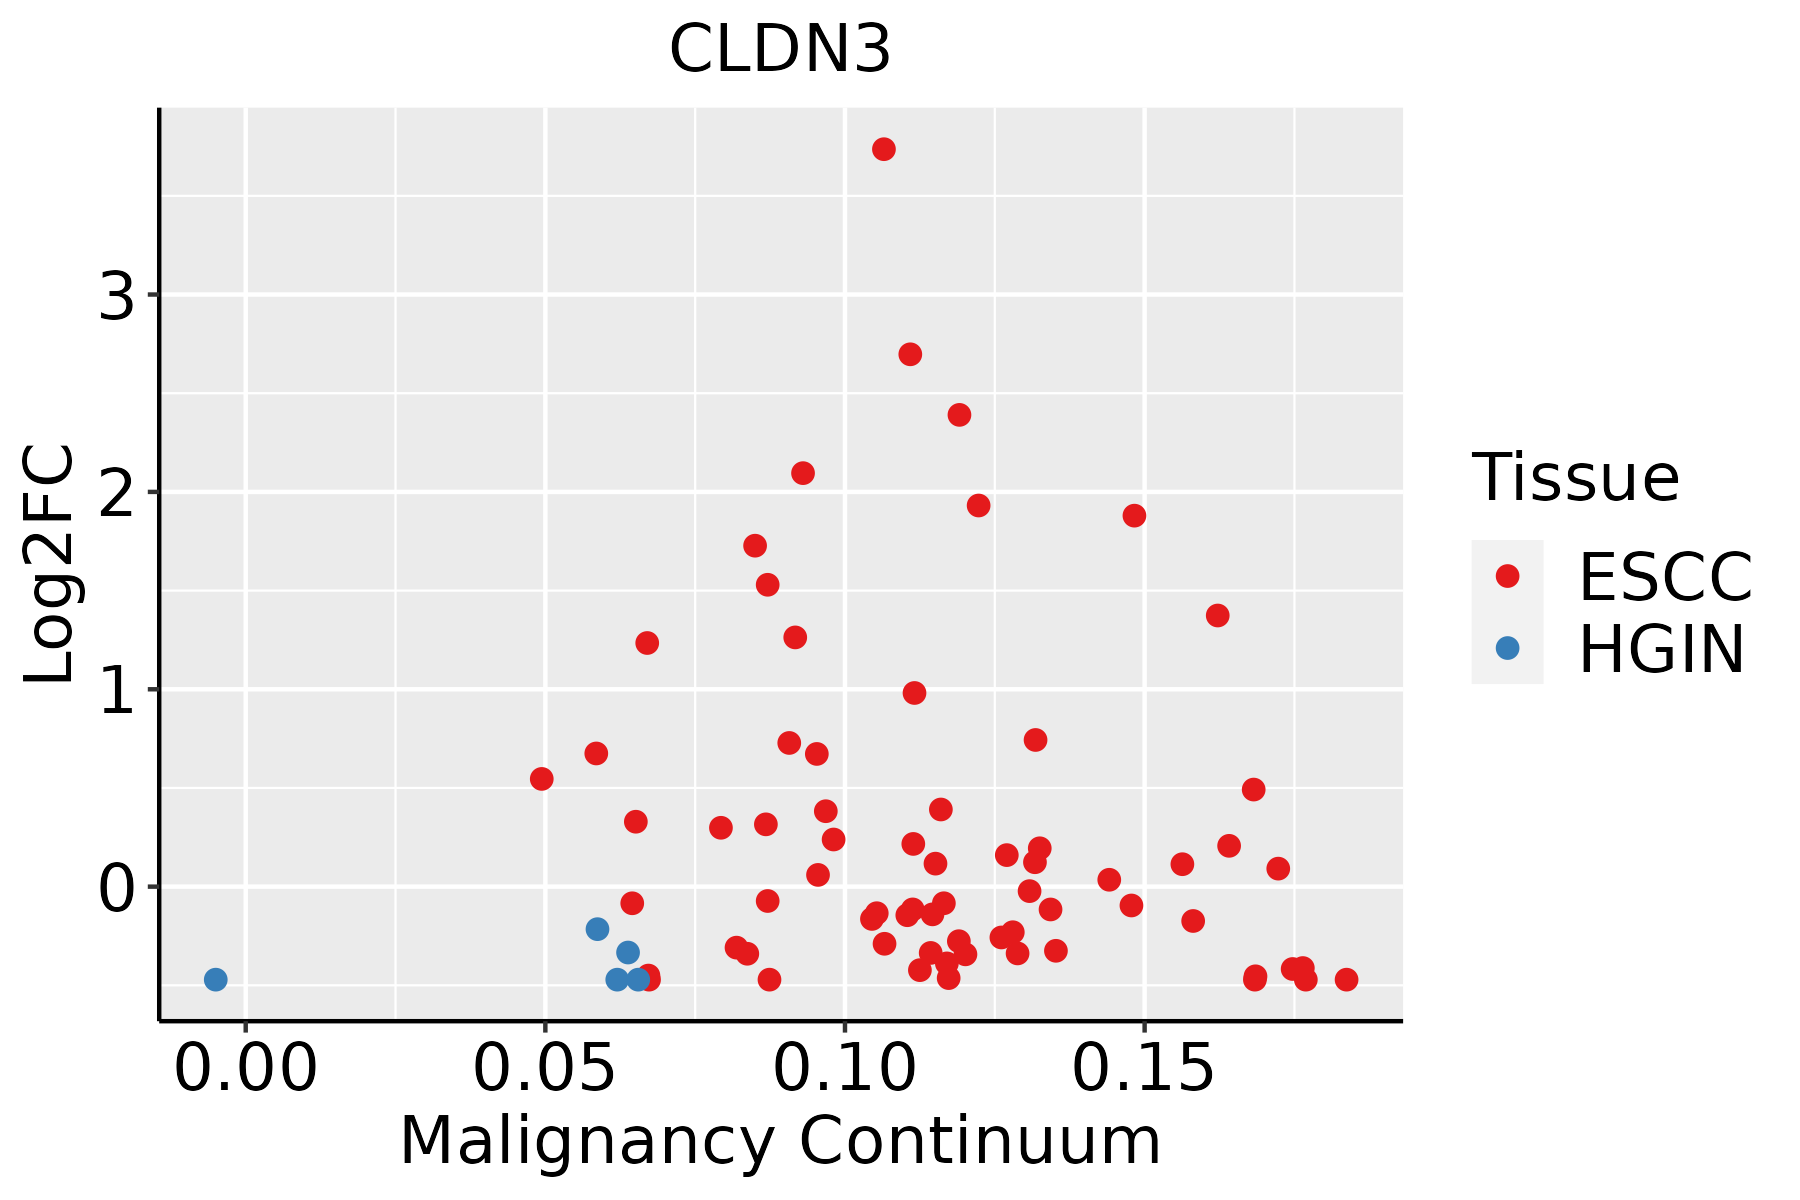 | ESCC: Esophageal squamous cell carcinoma |
| HGIN: High-grade intraepithelial neoplasias | ||
| LGIN: Low-grade intraepithelial neoplasias | ||
| GC | 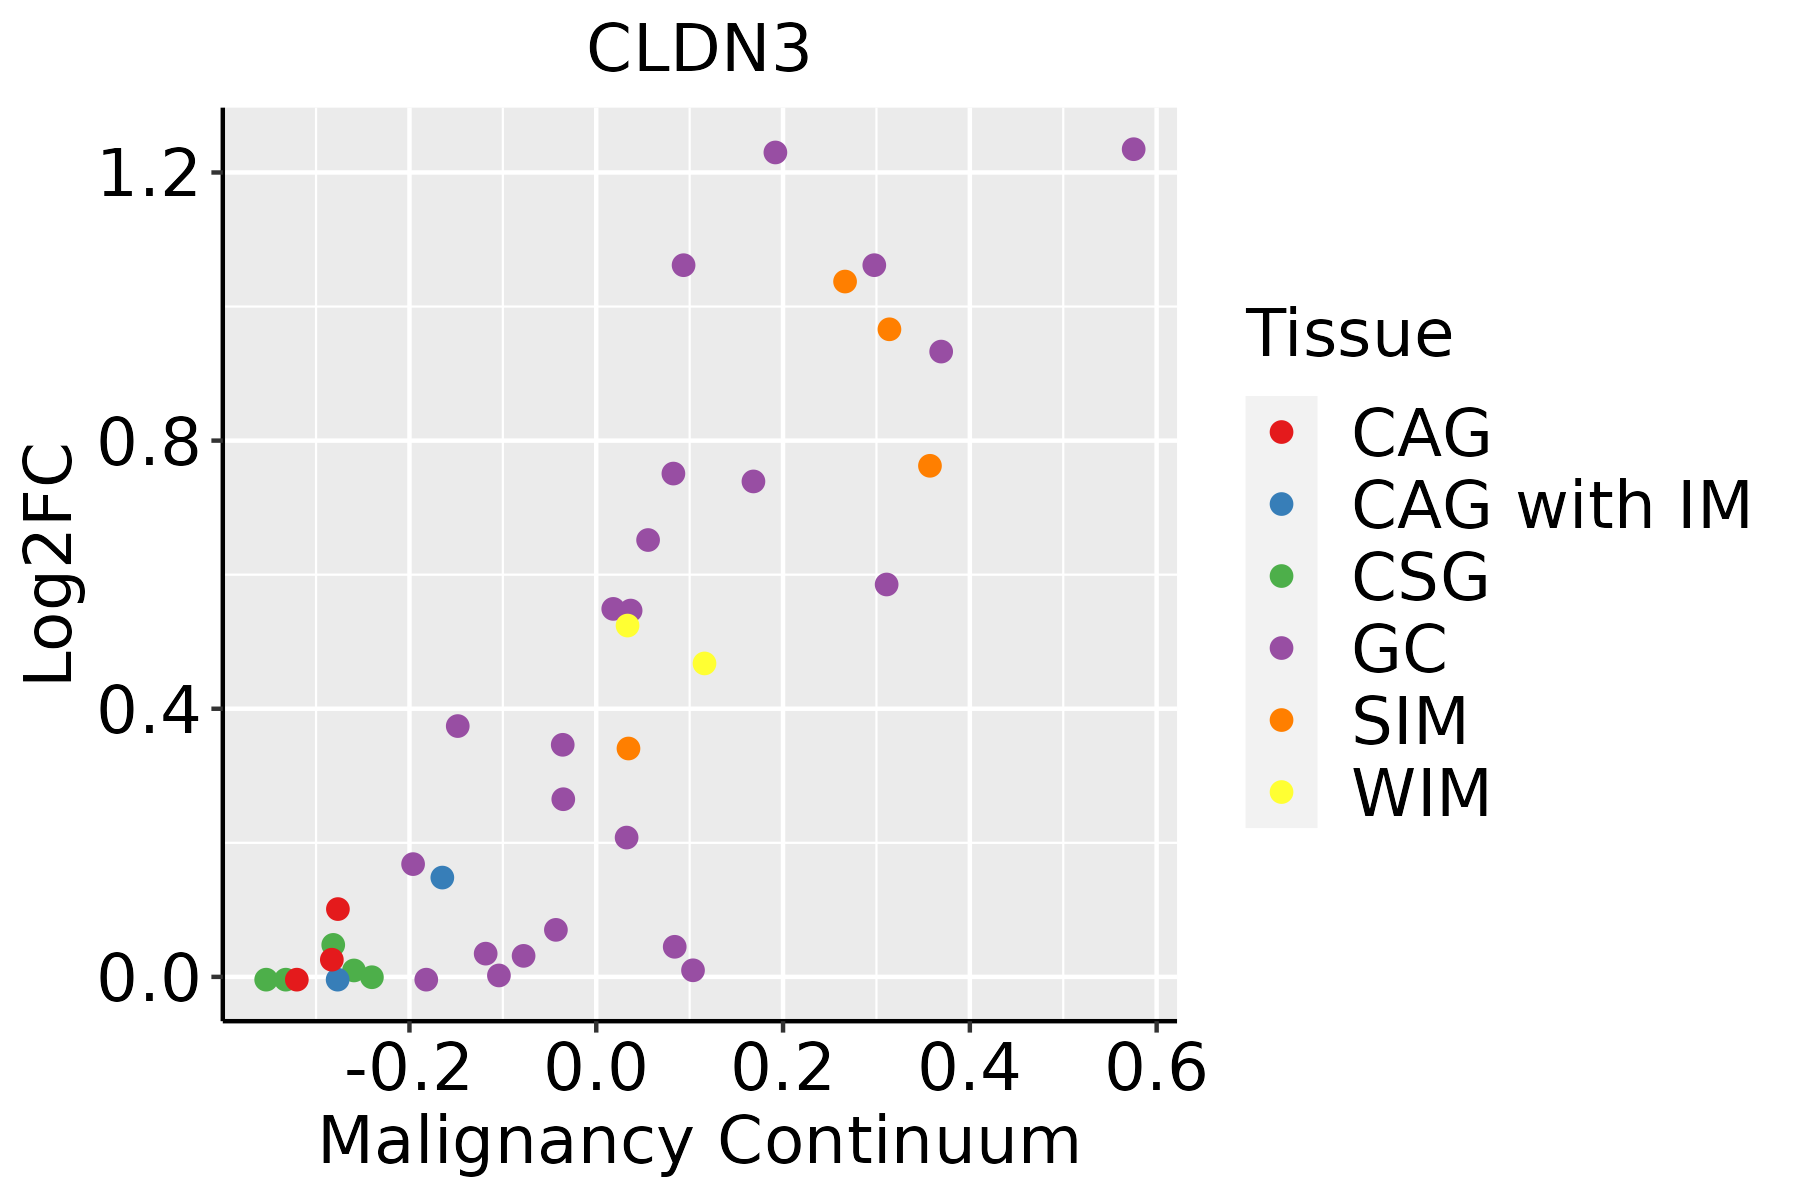 | CAG: Chronic atrophic gastritis |
| CAG with IM: Chronic atrophic gastritis with intestinal metaplasia | ||
| CSG: Chronic superficial gastritis | ||
| GC: Gastric cancer | ||
| SIM: Severe intestinal metaplasia | ||
| WIM: Wild intestinal metaplasia | ||
| Liver | 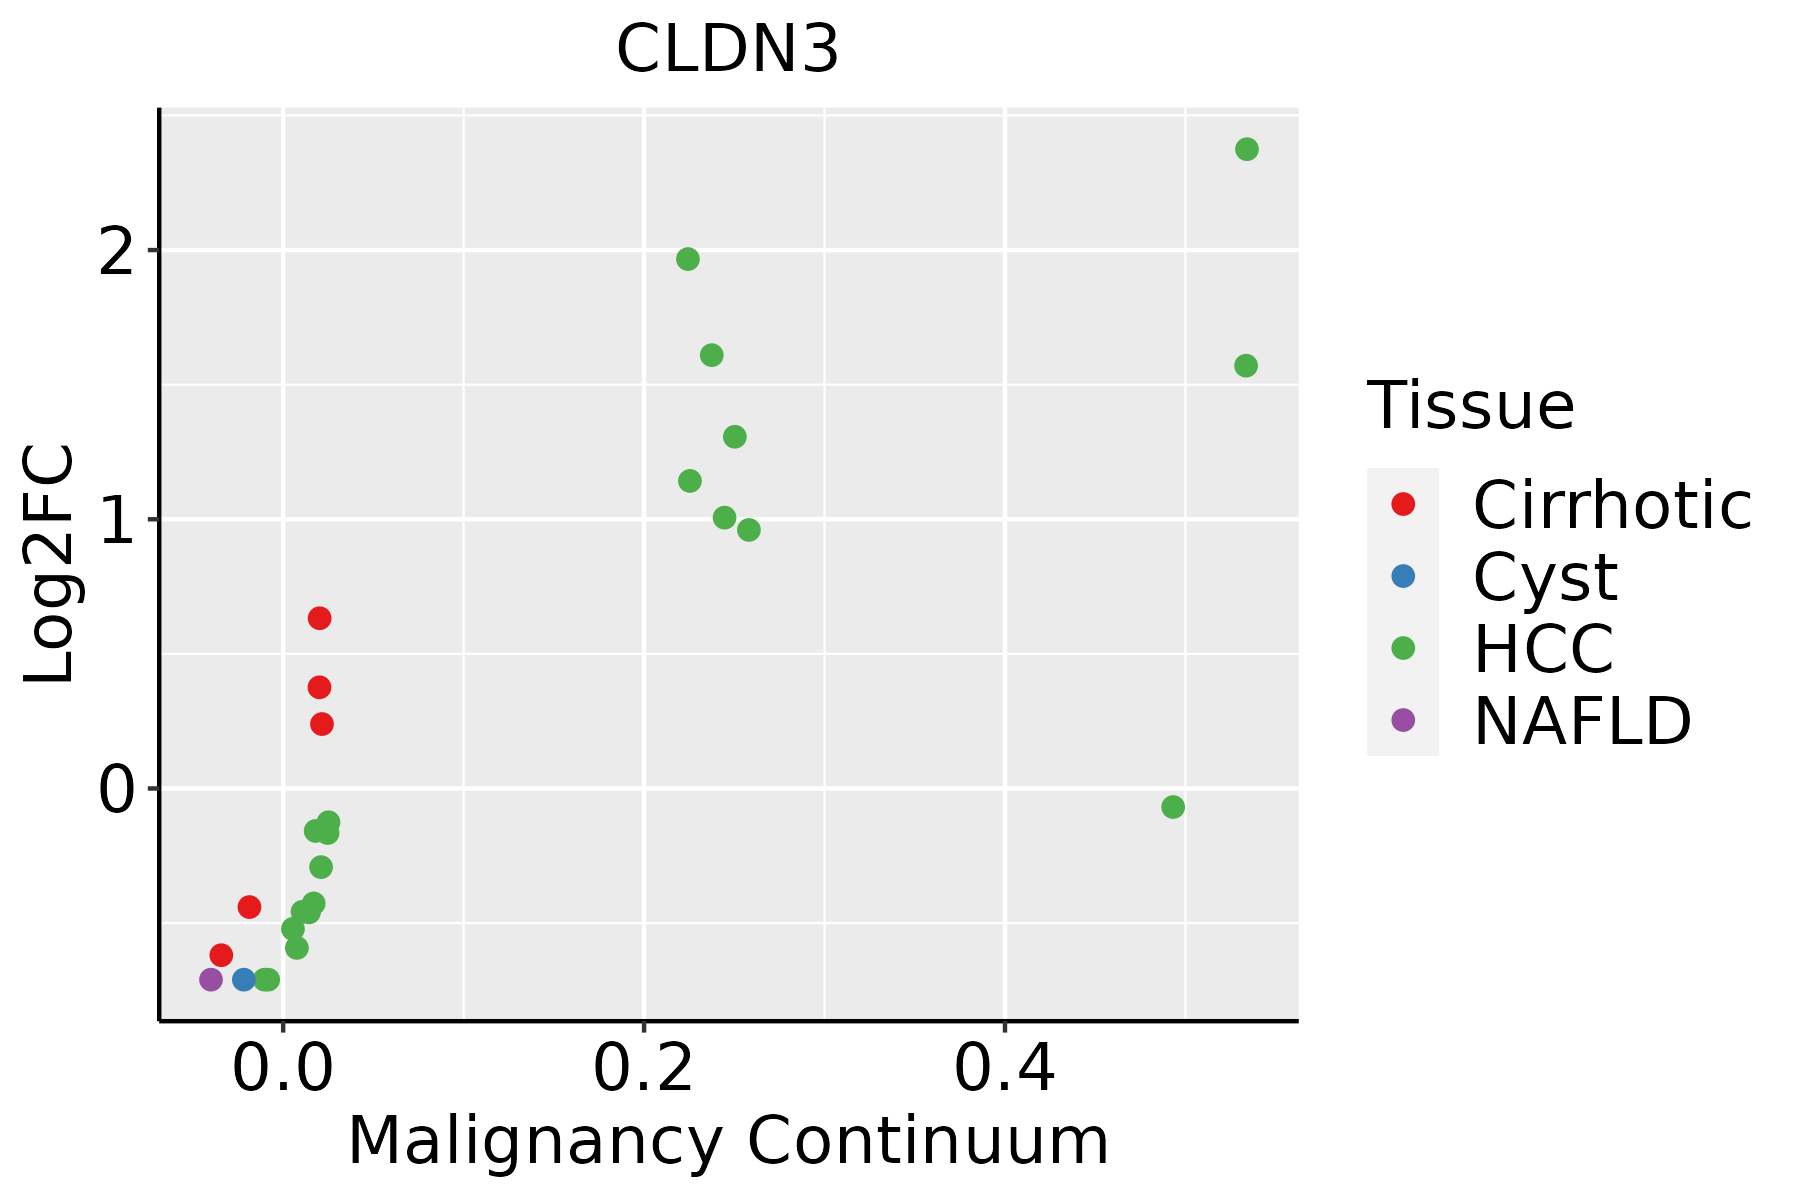 | HCC: Hepatocellular carcinoma |
| NAFLD: Non-alcoholic fatty liver disease | ||
| Lung | 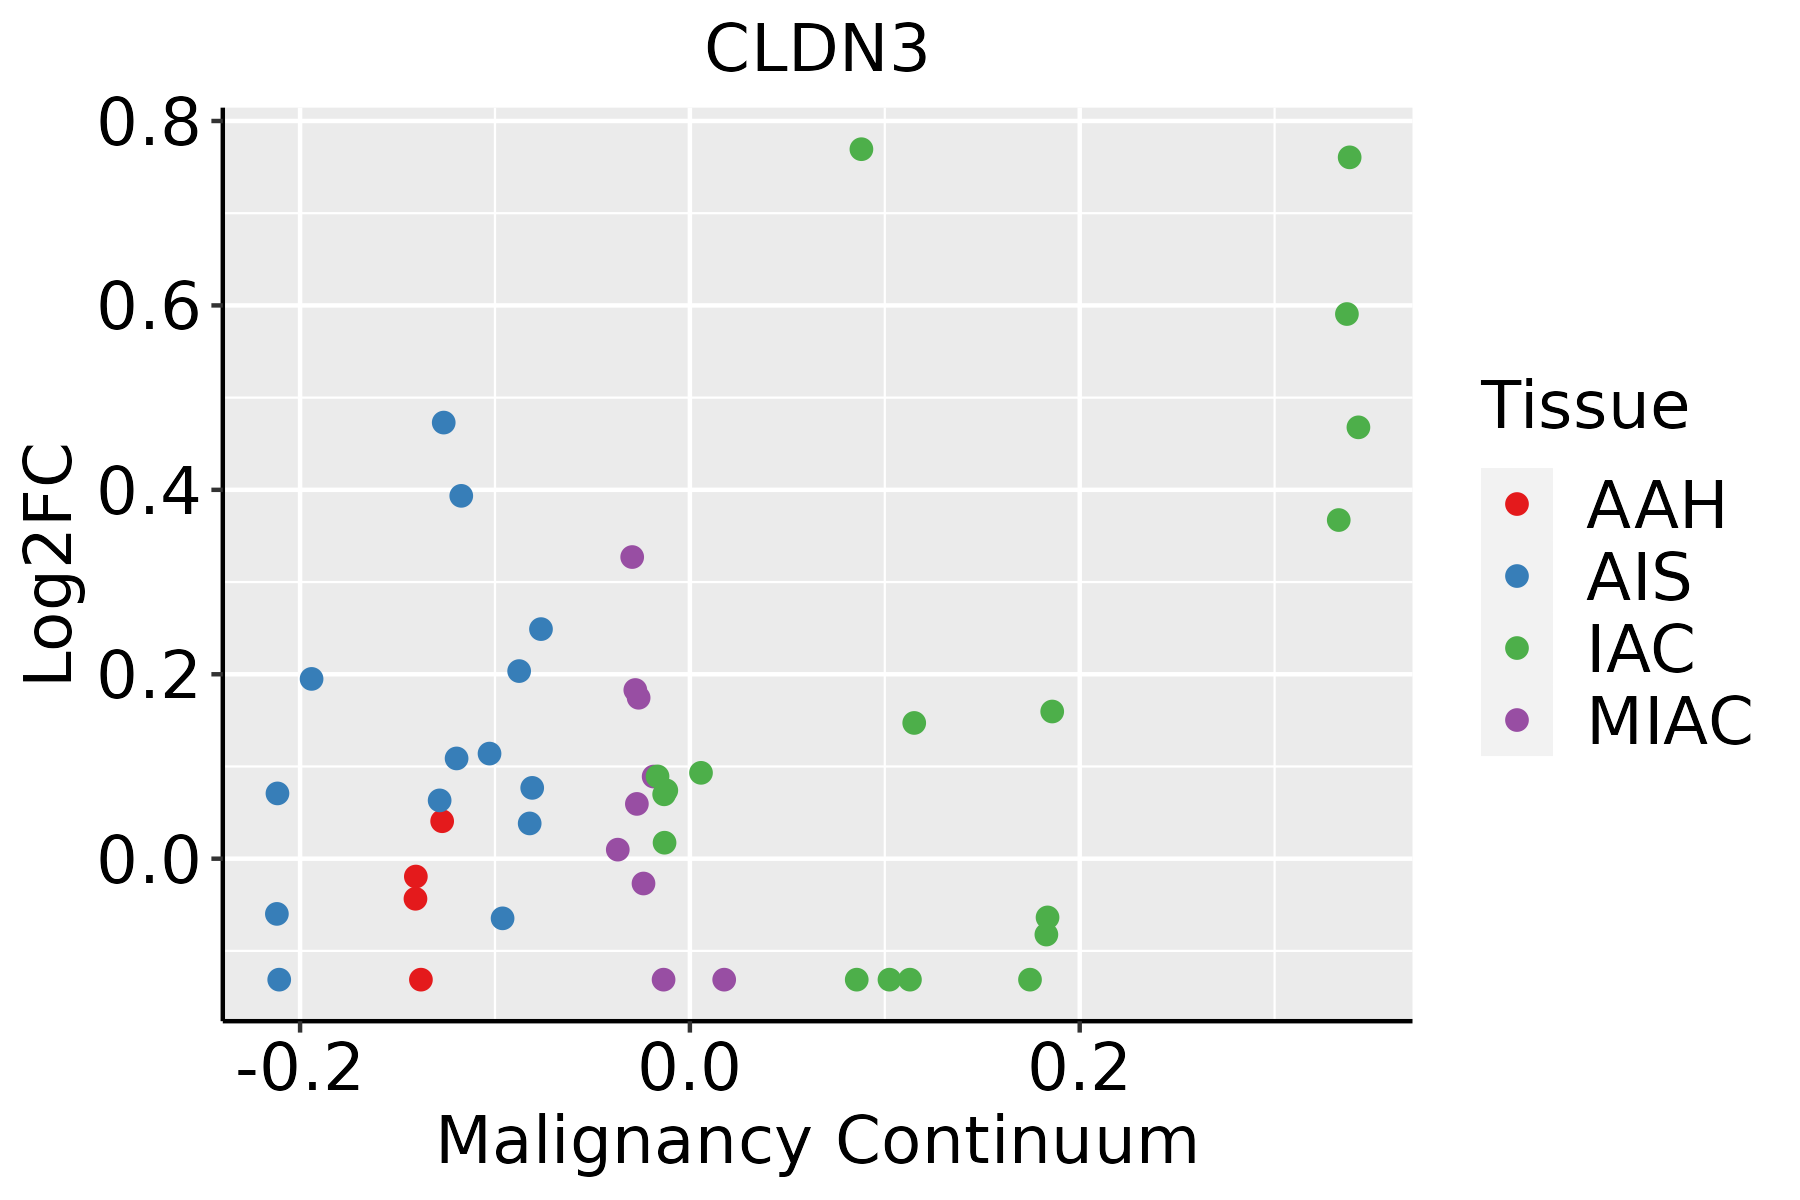 | AAH: Atypical adenomatous hyperplasia |
| AIS: Adenocarcinoma in situ | ||
| IAC: Invasive lung adenocarcinoma | ||
| MIA: Minimally invasive adenocarcinoma | ||
| Oral Cavity | 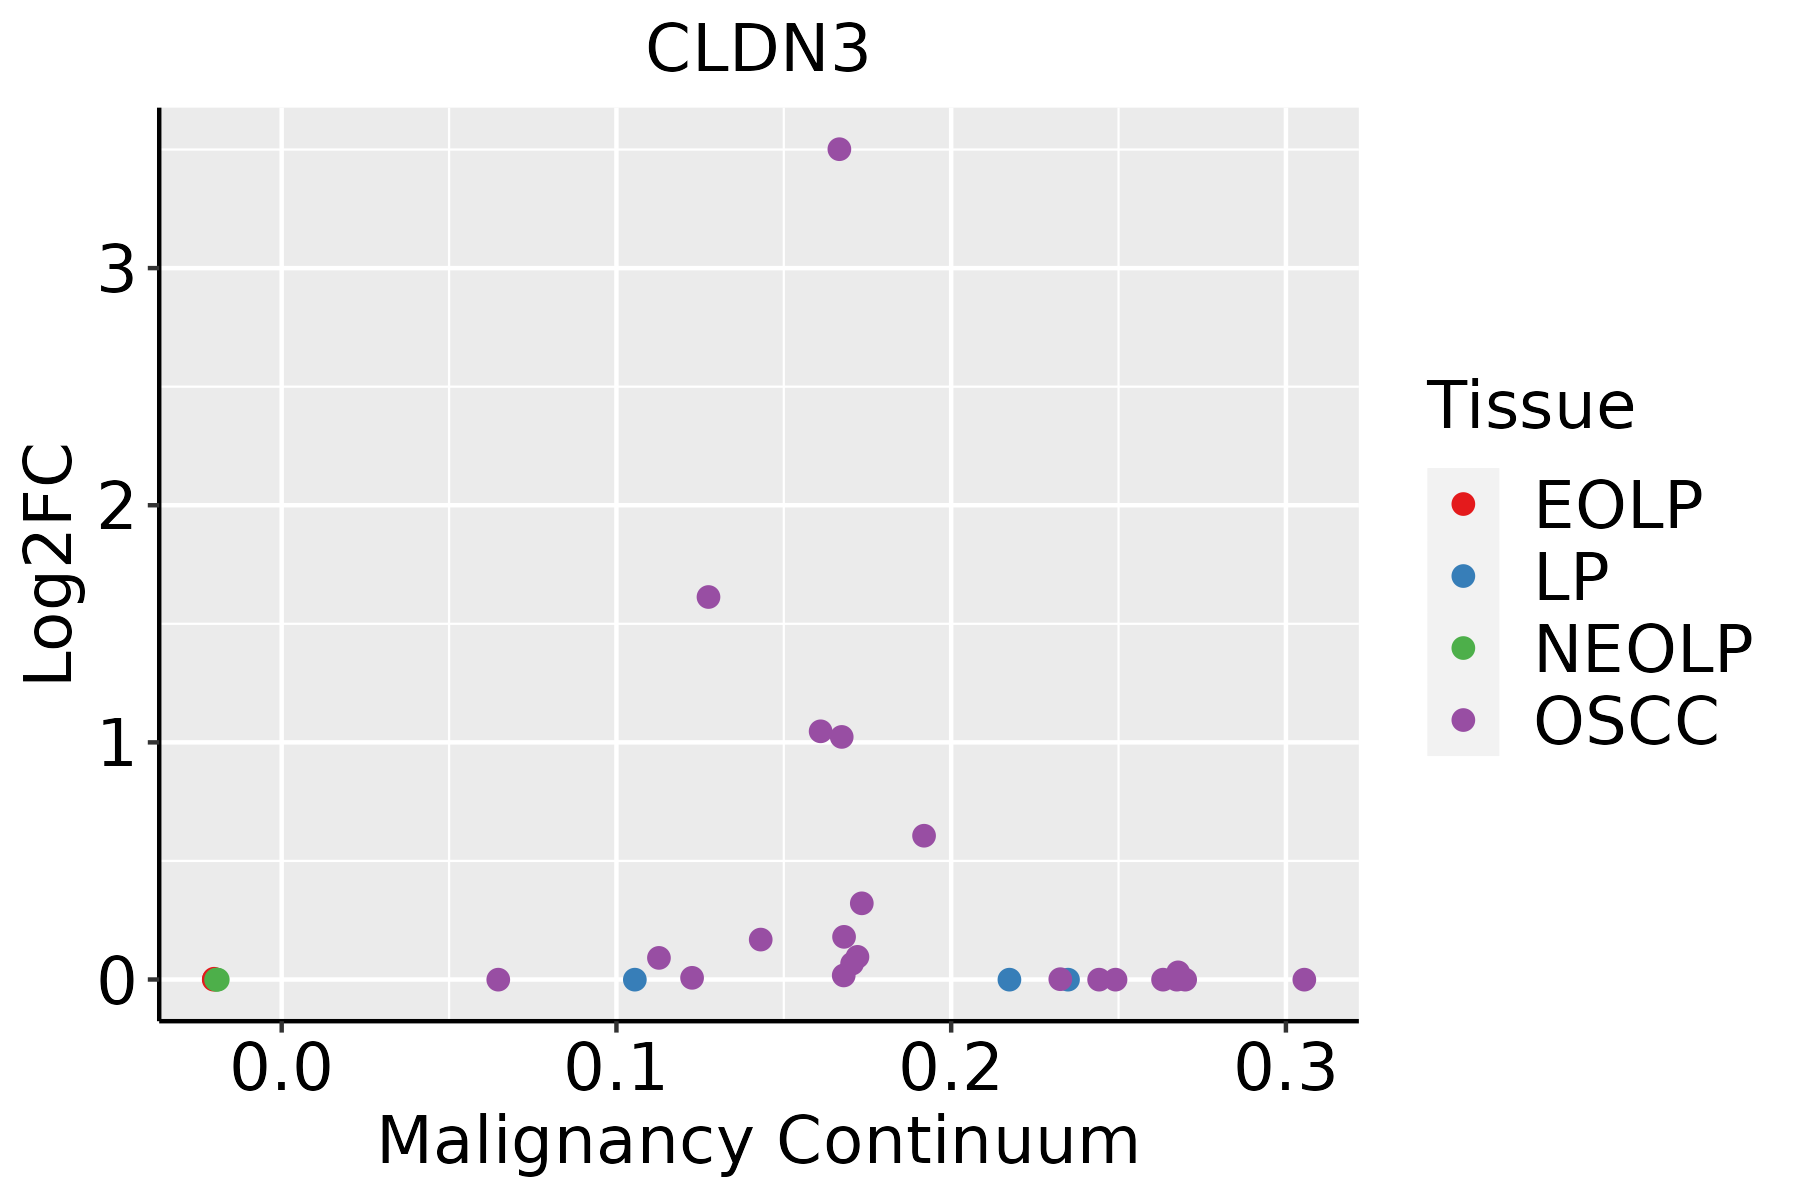 | EOLP: Erosive Oral lichen planus |
| LP: leukoplakia | ||
| NEOLP: Non-erosive oral lichen planus | ||
| OSCC: Oral squamous cell carcinoma | ||
| Prostate |  | BPH: Benign Prostatic Hyperplasia |
| Thyroid | 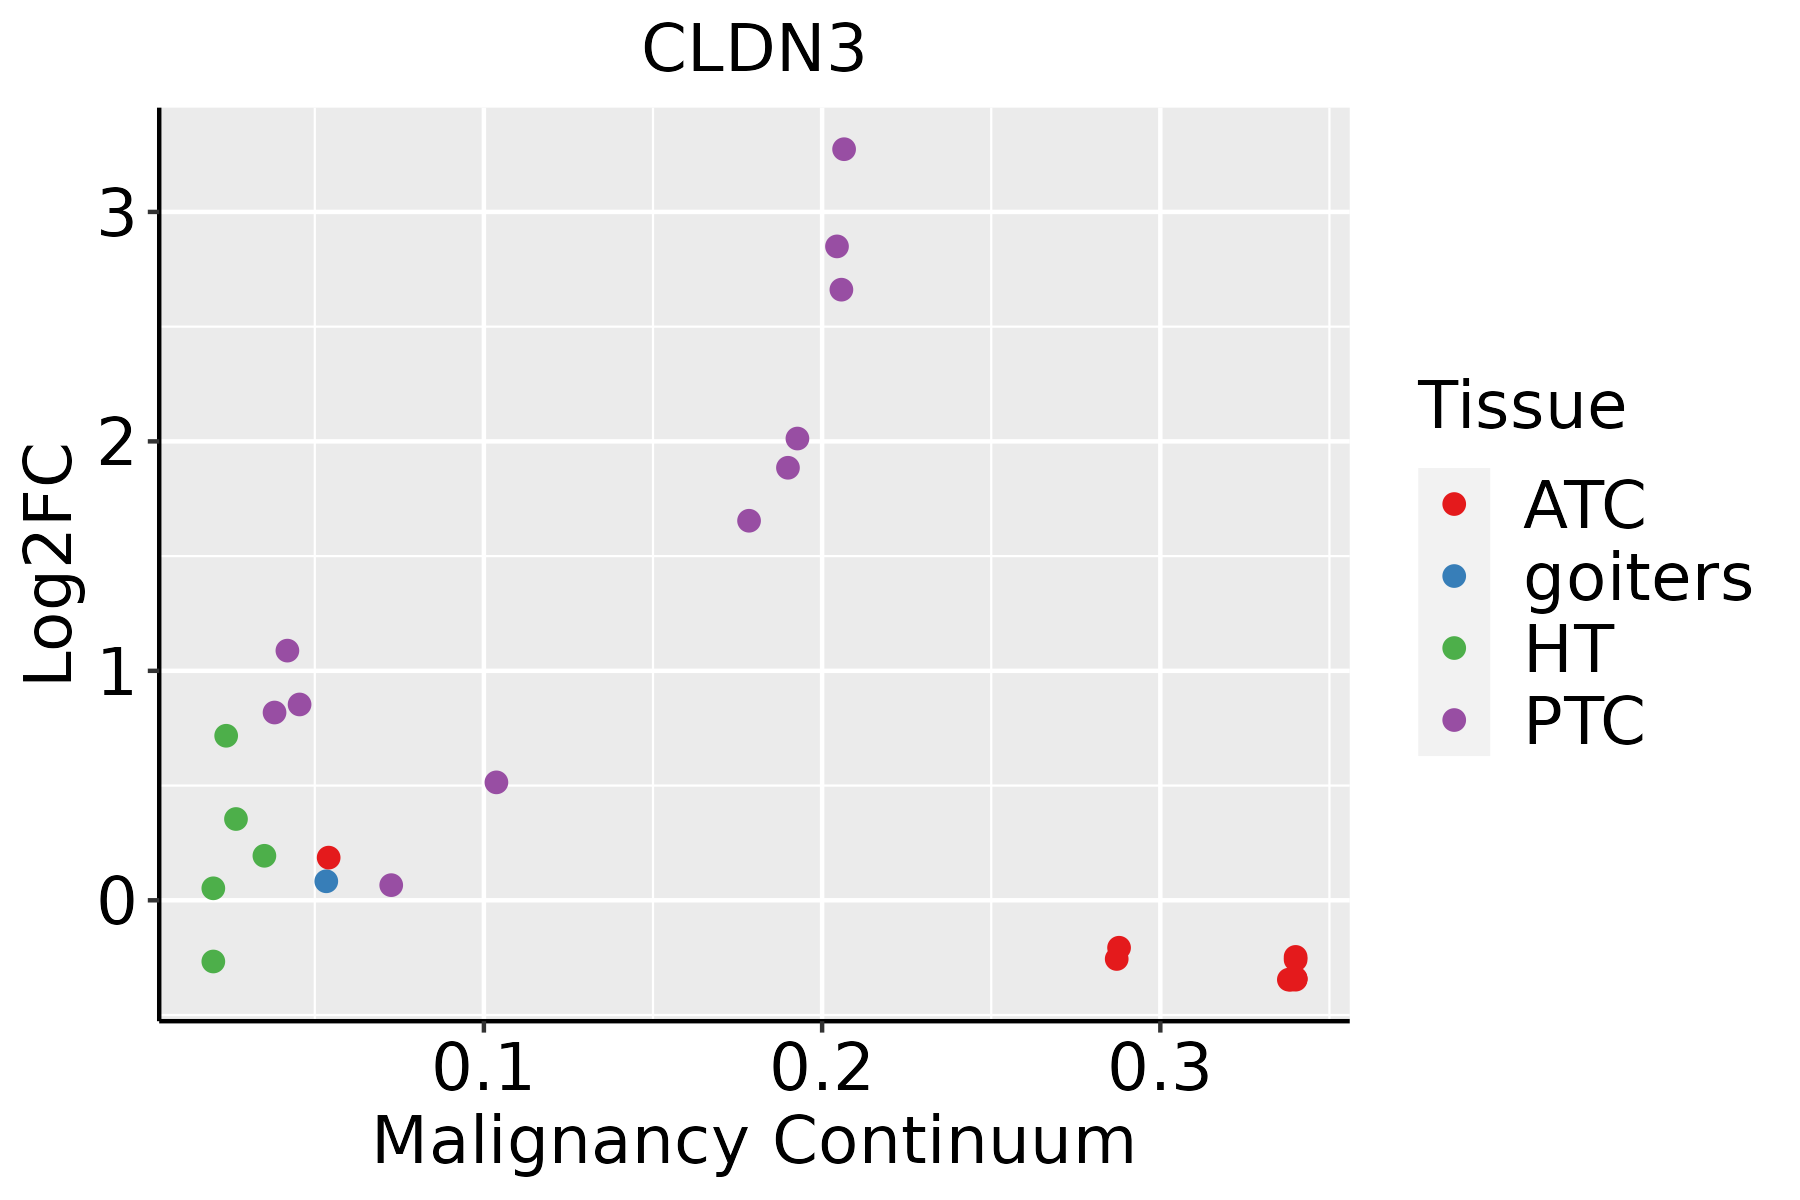 | ATC: Anaplastic thyroid cancer |
| HT: Hashimoto's thyroiditis | ||
| PTC: Papillary thyroid cancer |
| ∗log2FC in expression of this searched gene in stem-like cells from each diseased tissue sample relative to stem-like cells in normal samples in each tissue plotted against the malignancy continuum. Samples are colored based on if they are from different disease stage. |
Top |
Malignant transformation related pathway analysis |
| Find out the enriched GO biological processes and KEGG pathways involved in transition from healthy to precancer to cancer |
| Tissue | Disease Stage | Enriched GO biological Processes |
| Thyroid | PTC |  |
| Thyroid | goiters |  |
| Thyroid | ATC |  |
| ∗Top 15 enriched GO BP terms are showed in the bar plot of each disease state in each tissue. Each row represents a significant GO biological process which is colored according to the -log10(p.adjust). |
| Page: 1 2 3 4 5 6 7 8 9 |
| GO ID | Tissue | Disease Stage | Description | Gene Ratio | Bg Ratio | pvalue | p.adjust | Count |
| GO:00525479 | Breast | Precancer | regulation of peptidase activity | 71/1080 | 461/18723 | 2.72e-14 | 6.94e-12 | 71 |
| GO:00362939 | Breast | Precancer | response to decreased oxygen levels | 53/1080 | 322/18723 | 4.09e-12 | 6.84e-10 | 53 |
| GO:00016669 | Breast | Precancer | response to hypoxia | 51/1080 | 307/18723 | 7.33e-12 | 1.11e-09 | 51 |
| GO:00704829 | Breast | Precancer | response to oxygen levels | 55/1080 | 347/18723 | 7.47e-12 | 1.11e-09 | 55 |
| GO:00458629 | Breast | Precancer | positive regulation of proteolysis | 51/1080 | 372/18723 | 7.77e-09 | 5.70e-07 | 51 |
| GO:00109529 | Breast | Precancer | positive regulation of peptidase activity | 33/1080 | 197/18723 | 3.01e-08 | 1.89e-06 | 33 |
| GO:00420609 | Breast | Precancer | wound healing | 48/1080 | 422/18723 | 5.48e-06 | 1.63e-04 | 48 |
| GO:00905595 | Breast | Precancer | regulation of membrane permeability | 15/1080 | 78/18723 | 3.35e-05 | 7.29e-04 | 15 |
| GO:00356335 | Breast | Precancer | maintenance of blood-brain barrier | 8/1080 | 35/18723 | 6.95e-04 | 8.43e-03 | 8 |
| GO:19030367 | Breast | Precancer | positive regulation of response to wounding | 12/1080 | 72/18723 | 7.90e-04 | 9.30e-03 | 12 |
| GO:00903036 | Breast | Precancer | positive regulation of wound healing | 10/1080 | 59/18723 | 1.86e-03 | 1.81e-02 | 10 |
| GO:00018948 | Breast | Precancer | tissue homeostasis | 27/1080 | 268/18723 | 3.49e-03 | 2.90e-02 | 27 |
| GO:19030348 | Breast | Precancer | regulation of response to wounding | 19/1080 | 167/18723 | 3.60e-03 | 2.98e-02 | 19 |
| GO:00020649 | Breast | Precancer | epithelial cell development | 23/1080 | 220/18723 | 4.28e-03 | 3.35e-02 | 23 |
| GO:00973058 | Breast | Precancer | response to alcohol | 25/1080 | 253/18723 | 6.16e-03 | 4.35e-02 | 25 |
| GO:00226049 | Breast | Precancer | regulation of cell morphogenesis | 29/1080 | 309/18723 | 6.88e-03 | 4.67e-02 | 29 |
| GO:005254714 | Breast | IDC | regulation of peptidase activity | 96/1434 | 461/18723 | 7.58e-20 | 6.15e-17 | 96 |
| GO:007048214 | Breast | IDC | response to oxygen levels | 64/1434 | 347/18723 | 3.45e-11 | 5.57e-09 | 64 |
| GO:003629314 | Breast | IDC | response to decreased oxygen levels | 60/1434 | 322/18723 | 9.26e-11 | 1.25e-08 | 60 |
| GO:004586214 | Breast | IDC | positive regulation of proteolysis | 66/1434 | 372/18723 | 9.76e-11 | 1.29e-08 | 66 |
| Page: 1 2 3 4 5 6 7 8 9 10 11 12 13 14 15 16 17 18 19 20 21 22 23 24 25 26 27 28 29 30 31 32 |
| Pathway ID | Tissue | Disease Stage | Description | Gene Ratio | Bg Ratio | pvalue | p.adjust | qvalue | Count |
| hsa0513018 | Breast | Precancer | Pathogenic Escherichia coli infection | 38/684 | 197/8465 | 3.12e-07 | 5.81e-06 | 4.45e-06 | 38 |
| hsa0453018 | Breast | Precancer | Tight junction | 31/684 | 169/8465 | 1.13e-05 | 1.26e-04 | 9.64e-05 | 31 |
| hsa0467018 | Breast | Precancer | Leukocyte transendothelial migration | 20/684 | 114/8465 | 7.26e-04 | 5.33e-03 | 4.09e-03 | 20 |
| hsa0513019 | Breast | Precancer | Pathogenic Escherichia coli infection | 38/684 | 197/8465 | 3.12e-07 | 5.81e-06 | 4.45e-06 | 38 |
| hsa0453019 | Breast | Precancer | Tight junction | 31/684 | 169/8465 | 1.13e-05 | 1.26e-04 | 9.64e-05 | 31 |
| hsa0467019 | Breast | Precancer | Leukocyte transendothelial migration | 20/684 | 114/8465 | 7.26e-04 | 5.33e-03 | 4.09e-03 | 20 |
| hsa0453024 | Breast | IDC | Tight junction | 38/867 | 169/8465 | 2.07e-06 | 3.20e-05 | 2.39e-05 | 38 |
| hsa0513024 | Breast | IDC | Pathogenic Escherichia coli infection | 42/867 | 197/8465 | 2.66e-06 | 3.92e-05 | 2.94e-05 | 42 |
| hsa0467024 | Breast | IDC | Leukocyte transendothelial migration | 21/867 | 114/8465 | 5.41e-03 | 3.13e-02 | 2.34e-02 | 21 |
| hsa0453034 | Breast | IDC | Tight junction | 38/867 | 169/8465 | 2.07e-06 | 3.20e-05 | 2.39e-05 | 38 |
| hsa0513034 | Breast | IDC | Pathogenic Escherichia coli infection | 42/867 | 197/8465 | 2.66e-06 | 3.92e-05 | 2.94e-05 | 42 |
| hsa0467034 | Breast | IDC | Leukocyte transendothelial migration | 21/867 | 114/8465 | 5.41e-03 | 3.13e-02 | 2.34e-02 | 21 |
| hsa0513043 | Breast | DCIS | Pathogenic Escherichia coli infection | 42/846 | 197/8465 | 1.40e-06 | 2.15e-05 | 1.59e-05 | 42 |
| hsa0453044 | Breast | DCIS | Tight junction | 37/846 | 169/8465 | 3.07e-06 | 4.20e-05 | 3.09e-05 | 37 |
| hsa0467044 | Breast | DCIS | Leukocyte transendothelial migration | 21/846 | 114/8465 | 4.07e-03 | 2.31e-02 | 1.70e-02 | 21 |
| hsa0513053 | Breast | DCIS | Pathogenic Escherichia coli infection | 42/846 | 197/8465 | 1.40e-06 | 2.15e-05 | 1.59e-05 | 42 |
| hsa0453054 | Breast | DCIS | Tight junction | 37/846 | 169/8465 | 3.07e-06 | 4.20e-05 | 3.09e-05 | 37 |
| hsa0467054 | Breast | DCIS | Leukocyte transendothelial migration | 21/846 | 114/8465 | 4.07e-03 | 2.31e-02 | 1.70e-02 | 21 |
| hsa04530 | Colorectum | AD | Tight junction | 76/2092 | 169/8465 | 5.49e-09 | 9.69e-08 | 6.18e-08 | 76 |
| hsa05130 | Colorectum | AD | Pathogenic Escherichia coli infection | 79/2092 | 197/8465 | 1.05e-06 | 1.36e-05 | 8.65e-06 | 79 |
| Page: 1 2 3 4 5 6 7 |
Top |
Cell-cell communication analysis |
| Identification of potential cell-cell interactions between two cell types and their ligand-receptor pairs for different disease states |
| Ligand | Receptor | LRpair | Pathway | Tissue | Disease Stage |
| Page: 1 |
Top |
Single-cell gene regulatory network inference analysis |
| Find out the significant the regulons (TFs) and the target genes of each regulon across cell types for different disease states |
| TF | Cell Type | Tissue | Disease Stage | Target Gene | RSS | Regulon Activity |
| ∗The dot plots of a searched regulon are shown for all cell subpopulations in each disease state of each tissue based on the regulon specific score inferred using pySCENIC and by calculating the average expression. |
| Page: 1 |
Top |
Somatic mutation of malignant transformation related genes |
| Annotation of somatic variants for genes involved in malignant transformation |
| Hugo Symbol | Variant Class | Variant Classification | dbSNP RS | HGVSc | HGVSp | HGVSp Short | SWISSPROT | BIOTYPE | SIFT | PolyPhen | Tumor Sample Barcode | Tissue | Histology | Sex | Age | Stage | Therapy Types | Drugs | Outcome |
| CLDN3 | SNV | Missense_Mutation | rs782486517 | c.599N>T | p.Ala200Val | p.A200V | O15551 | protein_coding | tolerated(0.07) | benign(0.023) | TCGA-D1-A175-01 | Endometrium | uterine corpus endometrioid carcinoma | Female | <65 | I/II | Chemotherapy | paclitaxel | SD |
| CLDN3 | SNV | Missense_Mutation | rs781958238 | c.533N>T | p.Ala178Val | p.A178V | O15551 | protein_coding | deleterious(0.03) | possibly_damaging(0.631) | TCGA-D1-A2G6-01 | Endometrium | uterine corpus endometrioid carcinoma | Female | <65 | III/IV | Unknown | Unknown | PD |
| CLDN3 | SNV | Missense_Mutation | novel | c.134N>C | p.Ile45Thr | p.I45T | O15551 | protein_coding | tolerated(0.35) | benign(0.012) | TCGA-EY-A1GD-01 | Endometrium | uterine corpus endometrioid carcinoma | Female | <65 | I/II | Unknown | Unknown | SD |
| CLDN3 | SNV | Missense_Mutation | c.150G>T | p.Trp50Cys | p.W50C | O15551 | protein_coding | deleterious(0) | probably_damaging(1) | TCGA-39-5030-01 | Lung | lung squamous cell carcinoma | Female | >=65 | III/IV | Unknown | Unknown | SD | |
| CLDN3 | SNV | Missense_Mutation | c.163N>C | p.Val55Leu | p.V55L | O15551 | protein_coding | deleterious(0.01) | benign(0.329) | TCGA-BR-A4QL-01 | Stomach | stomach adenocarcinoma | Female | >=65 | III/IV | Chemotherapy | xeloda | CR | |
| CLDN3 | insertion | Frame_Shift_Ins | novel | c.77dupT | p.Leu26PhefsTer285 | p.L26Ffs*285 | O15551 | protein_coding | TCGA-CG-5726-01 | Stomach | stomach adenocarcinoma | Male | >=65 | I/II | Unknown | Unknown | SD |
| Page: 1 |
Top |
Related drugs of malignant transformation related genes |
| Identification of chemicals and drugs interact with genes involved in malignant transfromation |
| (DGIdb 4.0) |
| Entrez ID | Symbol | Category | Interaction Types | Drug Claim Name | Drug Name | PMIDs |
| Page: 1 |

Copyright 2023-Present -The University of Texas Health Science Center at Houston |