
|
|||||
|
 | |
| |
| |
| |
| |
| |
|
Gene: BTBD16 |
Gene summary for BTBD16 |
| Gene information | Species | Human | Gene symbol | BTBD16 | Gene ID | 118663 |
| Gene name | BTB domain containing 16 | |
| Gene Alias | C10orf87 | |
| Cytomap | 10q26.13 | |
| Gene Type | protein-coding | GO ID | NA | UniProtAcc | Q32M84 |
Top |
Malignant transformation analysis |
| Identification of the aberrant gene expression in precancerous and cancerous lesions by comparing the gene expression of stem-like cells in diseased tissues with normal stem cells |
| Entrez ID | Symbol | Replicates | Species | Organ | Tissue | Adj P-value | Log2FC | Malignancy |
| 118663 | BTBD16 | HCC1_Meng | Human | Liver | HCC | 3.44e-29 | 6.78e-02 | 0.0246 |
| 118663 | BTBD16 | S027 | Human | Liver | HCC | 8.84e-04 | 5.36e-01 | 0.2446 |
| 118663 | BTBD16 | S028 | Human | Liver | HCC | 1.36e-18 | 5.87e-01 | 0.2503 |
| 118663 | BTBD16 | S029 | Human | Liver | HCC | 1.18e-18 | 7.41e-01 | 0.2581 |
| Page: 1 |
| Tissue | Expression Dynamics | Abbreviation |
| Liver | 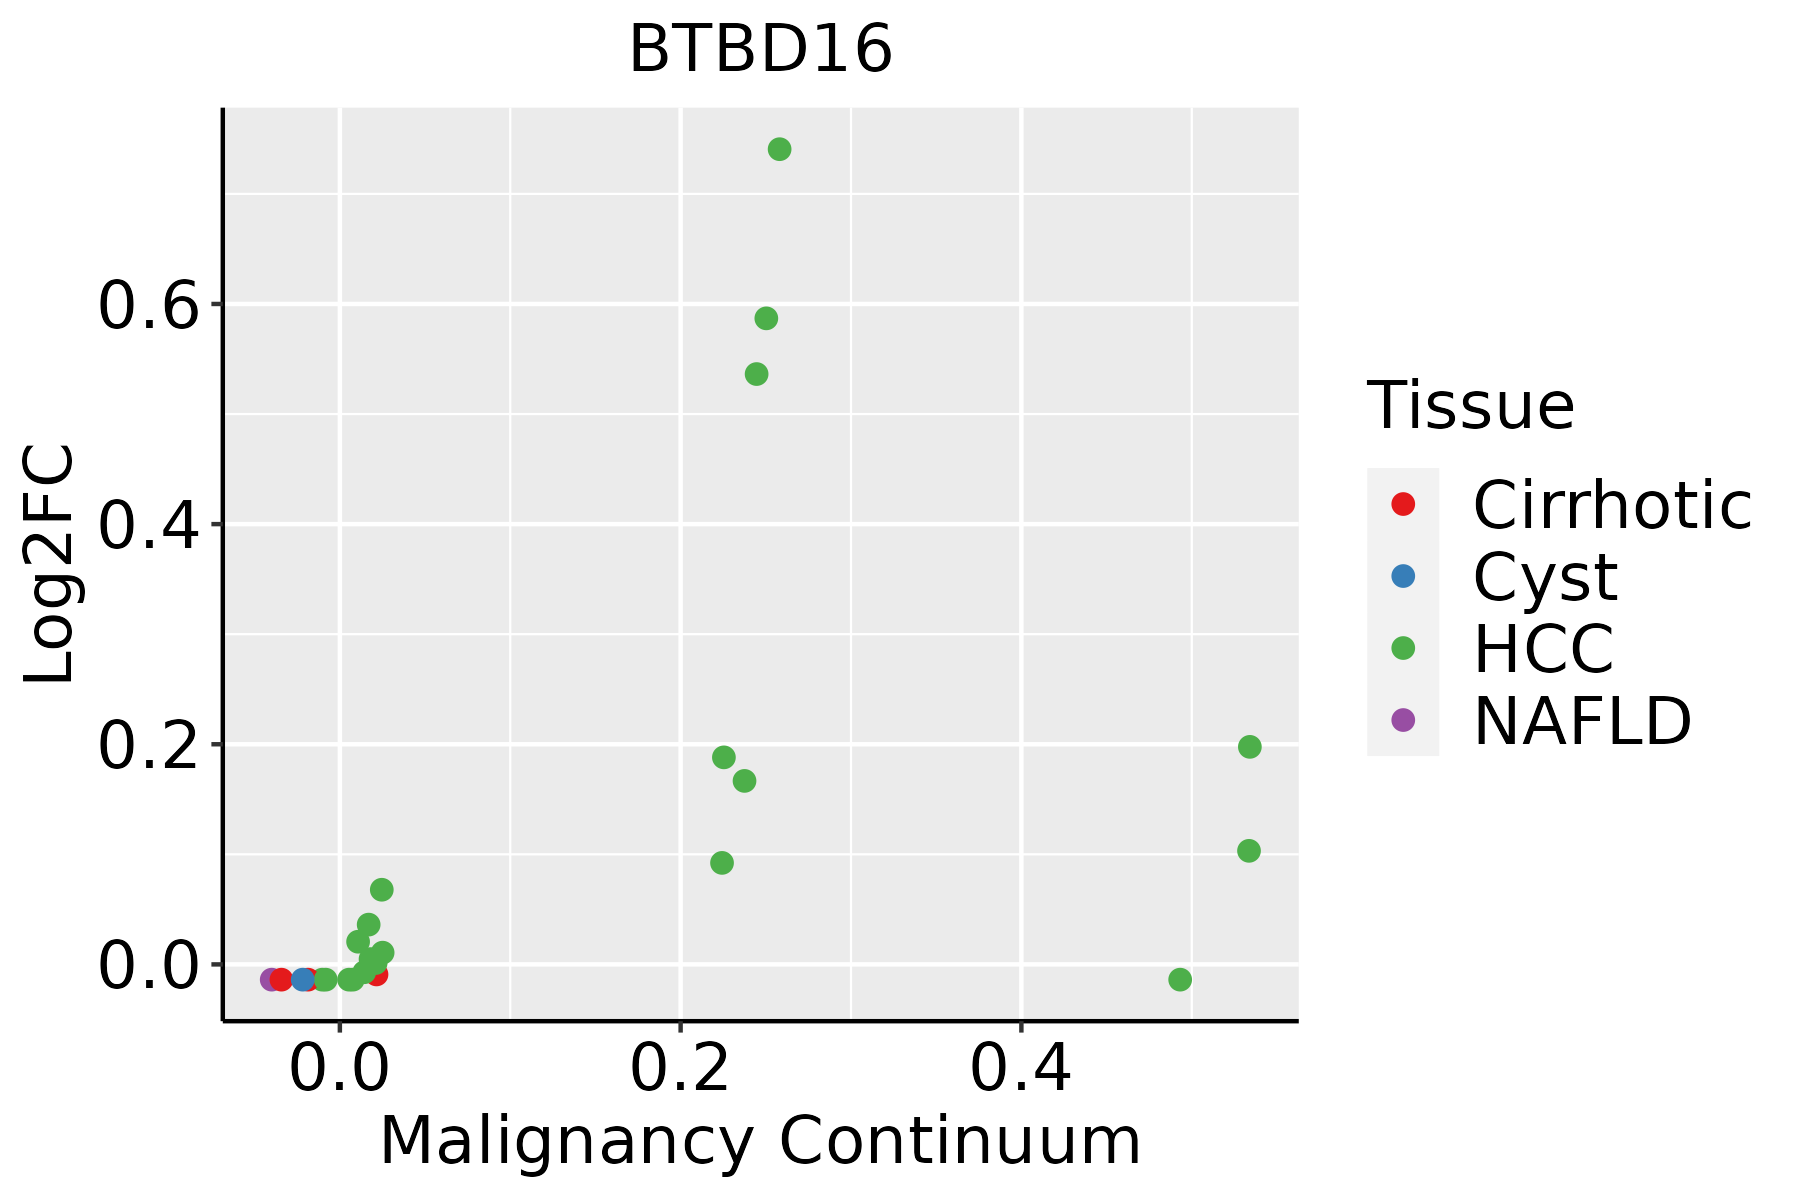 | HCC: Hepatocellular carcinoma |
| NAFLD: Non-alcoholic fatty liver disease |
| ∗log2FC in expression of this searched gene in stem-like cells from each diseased tissue sample relative to stem-like cells in normal samples in each tissue plotted against the malignancy continuum. Samples are colored based on if they are from different disease stage. |
Top |
Malignant transformation related pathway analysis |
| Find out the enriched GO biological processes and KEGG pathways involved in transition from healthy to precancer to cancer |
| Tissue | Disease Stage | Enriched GO biological Processes |
| Thyroid | PTC |  |
| Thyroid | goiters |  |
| Thyroid | ATC |  |
| ∗Top 15 enriched GO BP terms are showed in the bar plot of each disease state in each tissue. Each row represents a significant GO biological process which is colored according to the -log10(p.adjust). |
| Page: 1 2 3 4 5 6 7 8 9 |
| GO ID | Tissue | Disease Stage | Description | Gene Ratio | Bg Ratio | pvalue | p.adjust | Count |
| Page: 1 |
| Pathway ID | Tissue | Disease Stage | Description | Gene Ratio | Bg Ratio | pvalue | p.adjust | qvalue | Count |
| Page: 1 |
Top |
Cell-cell communication analysis |
| Identification of potential cell-cell interactions between two cell types and their ligand-receptor pairs for different disease states |
| Ligand | Receptor | LRpair | Pathway | Tissue | Disease Stage |
| Page: 1 |
Top |
Single-cell gene regulatory network inference analysis |
| Find out the significant the regulons (TFs) and the target genes of each regulon across cell types for different disease states |
| TF | Cell Type | Tissue | Disease Stage | Target Gene | RSS | Regulon Activity |
| ∗The dot plots of a searched regulon are shown for all cell subpopulations in each disease state of each tissue based on the regulon specific score inferred using pySCENIC and by calculating the average expression. |
| Page: 1 |
Top |
Somatic mutation of malignant transformation related genes |
| Annotation of somatic variants for genes involved in malignant transformation |
| Hugo Symbol | Variant Class | Variant Classification | dbSNP RS | HGVSc | HGVSp | HGVSp Short | SWISSPROT | BIOTYPE | SIFT | PolyPhen | Tumor Sample Barcode | Tissue | Histology | Sex | Age | Stage | Therapy Types | Drugs | Outcome |
| BTBD16 | SNV | Missense_Mutation | rs764340155 | c.1181N>T | p.Ser394Leu | p.S394L | Q32M84 | protein_coding | deleterious(0) | possibly_damaging(0.886) | TCGA-AN-A046-01 | Breast | breast invasive carcinoma | Female | >=65 | I/II | Unknown | Unknown | SD |
| BTBD16 | insertion | Nonsense_Mutation | novel | c.466_467insGTAGGATCGTTGGGGGAAGTTAGGCGAGGGATACGTGGGAACT | p.Thr156SerfsTer8 | p.T156Sfs*8 | Q32M84 | protein_coding | TCGA-BH-A0AW-01 | Breast | breast invasive carcinoma | Female | <65 | I/II | Chemotherapy | carboplatin | SD | ||
| BTBD16 | insertion | Frame_Shift_Ins | novel | c.1489_1490insT | p.Ser498LysfsTer33 | p.S498Kfs*33 | Q32M84 | protein_coding | TCGA-E2-A1IG-01 | Breast | breast invasive carcinoma | Female | <65 | I/II | Chemotherapy | cyclophosphamide | SD | ||
| BTBD16 | SNV | Missense_Mutation | c.1507T>G | p.Phe503Val | p.F503V | Q32M84 | protein_coding | deleterious(0) | probably_damaging(0.974) | TCGA-AZ-6598-01 | Colorectum | colon adenocarcinoma | Female | >=65 | I/II | Unknown | Unknown | SD | |
| BTBD16 | SNV | Missense_Mutation | rs764340155 | c.1181N>T | p.Ser394Leu | p.S394L | Q32M84 | protein_coding | deleterious(0) | possibly_damaging(0.886) | TCGA-CA-6717-01 | Colorectum | colon adenocarcinoma | Male | <65 | I/II | Chemotherapy | oxaliplatin | CR |
| BTBD16 | SNV | Missense_Mutation | rs747263313 | c.983N>A | p.Arg328His | p.R328H | Q32M84 | protein_coding | deleterious(0.01) | probably_damaging(0.999) | TCGA-D5-6530-01 | Colorectum | colon adenocarcinoma | Male | <65 | I/II | Unknown | Unknown | SD |
| BTBD16 | SNV | Missense_Mutation | novel | c.864N>T | p.Lys288Asn | p.K288N | Q32M84 | protein_coding | tolerated(0.14) | benign(0.006) | TCGA-AG-A002-01 | Colorectum | rectum adenocarcinoma | Male | <65 | I/II | Unknown | Unknown | SD |
| BTBD16 | SNV | Missense_Mutation | rs577596137 | c.1187N>T | p.Thr396Met | p.T396M | Q32M84 | protein_coding | tolerated(0.59) | benign(0.003) | TCGA-AG-A002-01 | Colorectum | rectum adenocarcinoma | Male | <65 | I/II | Unknown | Unknown | SD |
| BTBD16 | SNV | Missense_Mutation | rs749931706 | c.1297N>A | p.Ala433Thr | p.A433T | Q32M84 | protein_coding | tolerated(0.58) | benign(0.003) | TCGA-AG-A002-01 | Colorectum | rectum adenocarcinoma | Male | <65 | I/II | Unknown | Unknown | SD |
| BTBD16 | SNV | Missense_Mutation | c.1210N>C | p.Phe404Leu | p.F404L | Q32M84 | protein_coding | deleterious(0) | probably_damaging(0.998) | TCGA-AG-A02N-01 | Colorectum | rectum adenocarcinoma | Male | >=65 | I/II | Chemotherapy | folinic | CR |
| Page: 1 2 3 4 5 6 |
Top |
Related drugs of malignant transformation related genes |
| Identification of chemicals and drugs interact with genes involved in malignant transfromation |
| (DGIdb 4.0) |
| Entrez ID | Symbol | Category | Interaction Types | Drug Claim Name | Drug Name | PMIDs |
| Page: 1 |

Copyright 2023-Present -The University of Texas Health Science Center at Houston |