
|
|||||
|
 | |
| |
| |
| |
| |
| |
|
Gene: BEX3 |
Gene summary for BEX3 |
| Gene information | Species | Human | Gene symbol | BEX3 | Gene ID | 27018 |
| Gene name | brain expressed X-linked 3 | |
| Gene Alias | Bex | |
| Cytomap | Xq22.2 | |
| Gene Type | protein-coding | GO ID | GO:0006508 | UniProtAcc | Q00994 |
Top |
Malignant transformation analysis |
| Identification of the aberrant gene expression in precancerous and cancerous lesions by comparing the gene expression of stem-like cells in diseased tissues with normal stem cells |
| Entrez ID | Symbol | Replicates | Species | Organ | Tissue | Adj P-value | Log2FC | Malignancy |
| 27018 | BEX3 | GSM4909281 | Human | Breast | IDC | 9.73e-28 | 6.82e-01 | 0.21 |
| 27018 | BEX3 | GSM4909282 | Human | Breast | IDC | 6.27e-03 | 2.84e-01 | -0.0288 |
| 27018 | BEX3 | GSM4909285 | Human | Breast | IDC | 1.78e-30 | 5.81e-01 | 0.21 |
| 27018 | BEX3 | GSM4909286 | Human | Breast | IDC | 2.71e-07 | 9.73e-02 | 0.1081 |
| 27018 | BEX3 | GSM4909291 | Human | Breast | IDC | 3.23e-05 | 4.57e-01 | 0.1753 |
| 27018 | BEX3 | GSM4909293 | Human | Breast | IDC | 1.86e-21 | 5.41e-01 | 0.1581 |
| 27018 | BEX3 | GSM4909294 | Human | Breast | IDC | 2.63e-06 | -3.02e-01 | 0.2022 |
| 27018 | BEX3 | GSM4909296 | Human | Breast | IDC | 8.69e-07 | -3.49e-01 | 0.1524 |
| 27018 | BEX3 | GSM4909298 | Human | Breast | IDC | 2.62e-26 | 5.85e-01 | 0.1551 |
| 27018 | BEX3 | GSM4909299 | Human | Breast | IDC | 4.19e-06 | 2.71e-01 | 0.035 |
| 27018 | BEX3 | GSM4909301 | Human | Breast | IDC | 1.05e-08 | 4.83e-01 | 0.1577 |
| 27018 | BEX3 | GSM4909304 | Human | Breast | IDC | 1.03e-25 | 6.43e-01 | 0.1636 |
| 27018 | BEX3 | GSM4909305 | Human | Breast | IDC | 4.38e-05 | 3.46e-01 | 0.0436 |
| 27018 | BEX3 | GSM4909306 | Human | Breast | IDC | 4.80e-21 | 5.87e-01 | 0.1564 |
| 27018 | BEX3 | GSM4909307 | Human | Breast | IDC | 2.51e-25 | 7.25e-01 | 0.1569 |
| 27018 | BEX3 | GSM4909308 | Human | Breast | IDC | 6.09e-46 | 8.52e-01 | 0.158 |
| 27018 | BEX3 | GSM4909311 | Human | Breast | IDC | 4.08e-15 | 8.19e-02 | 0.1534 |
| 27018 | BEX3 | GSM4909312 | Human | Breast | IDC | 5.95e-06 | 3.36e-01 | 0.1552 |
| 27018 | BEX3 | GSM4909316 | Human | Breast | IDC | 2.11e-02 | 4.20e-01 | 0.21 |
| 27018 | BEX3 | GSM4909319 | Human | Breast | IDC | 3.23e-20 | 1.23e-02 | 0.1563 |
| Page: 1 2 3 4 5 6 7 8 9 |
| Tissue | Expression Dynamics | Abbreviation |
| Breast | 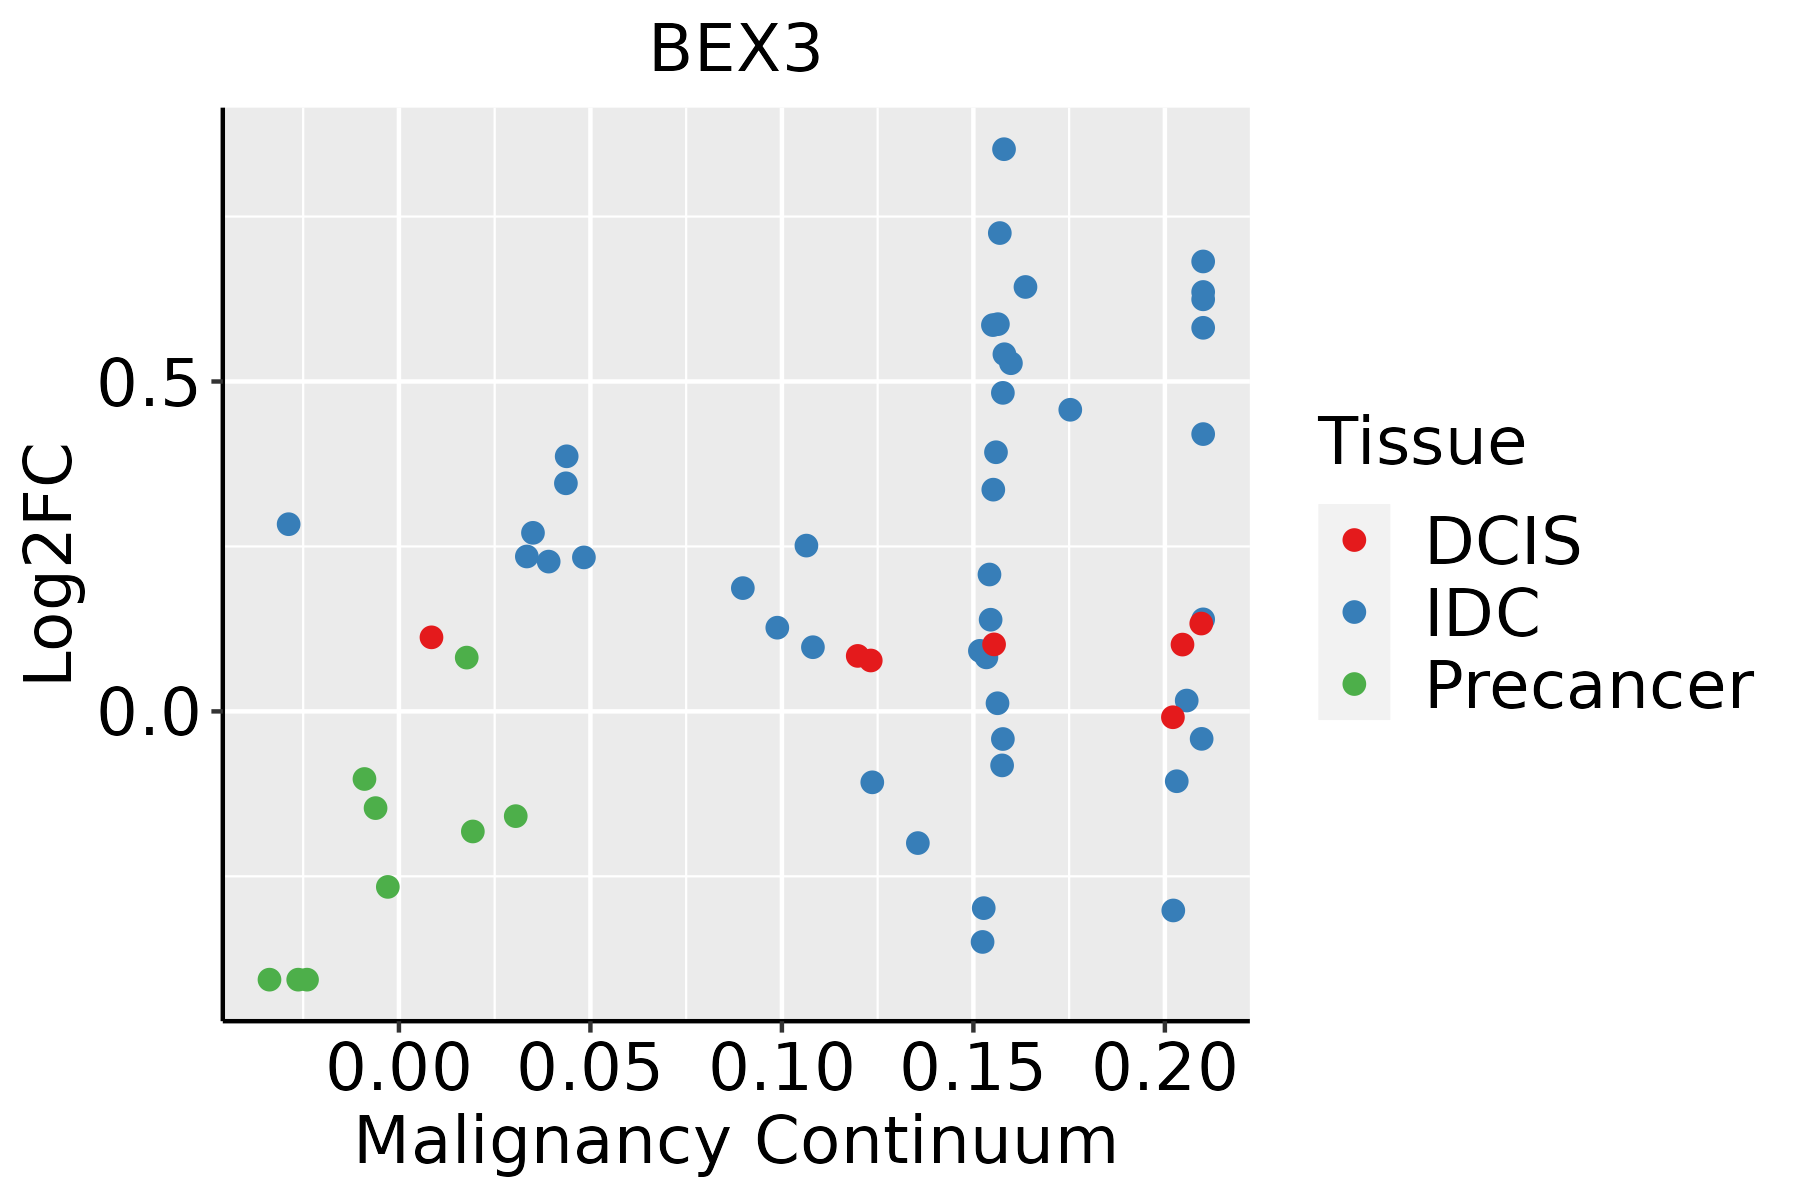 | IDC: Invasive ductal carcinoma |
| DCIS: Ductal carcinoma in situ | ||
| Precancer(BRCA1-mut): Precancerous lesion from BRCA1 mutation carriers | ||
| Cervix | 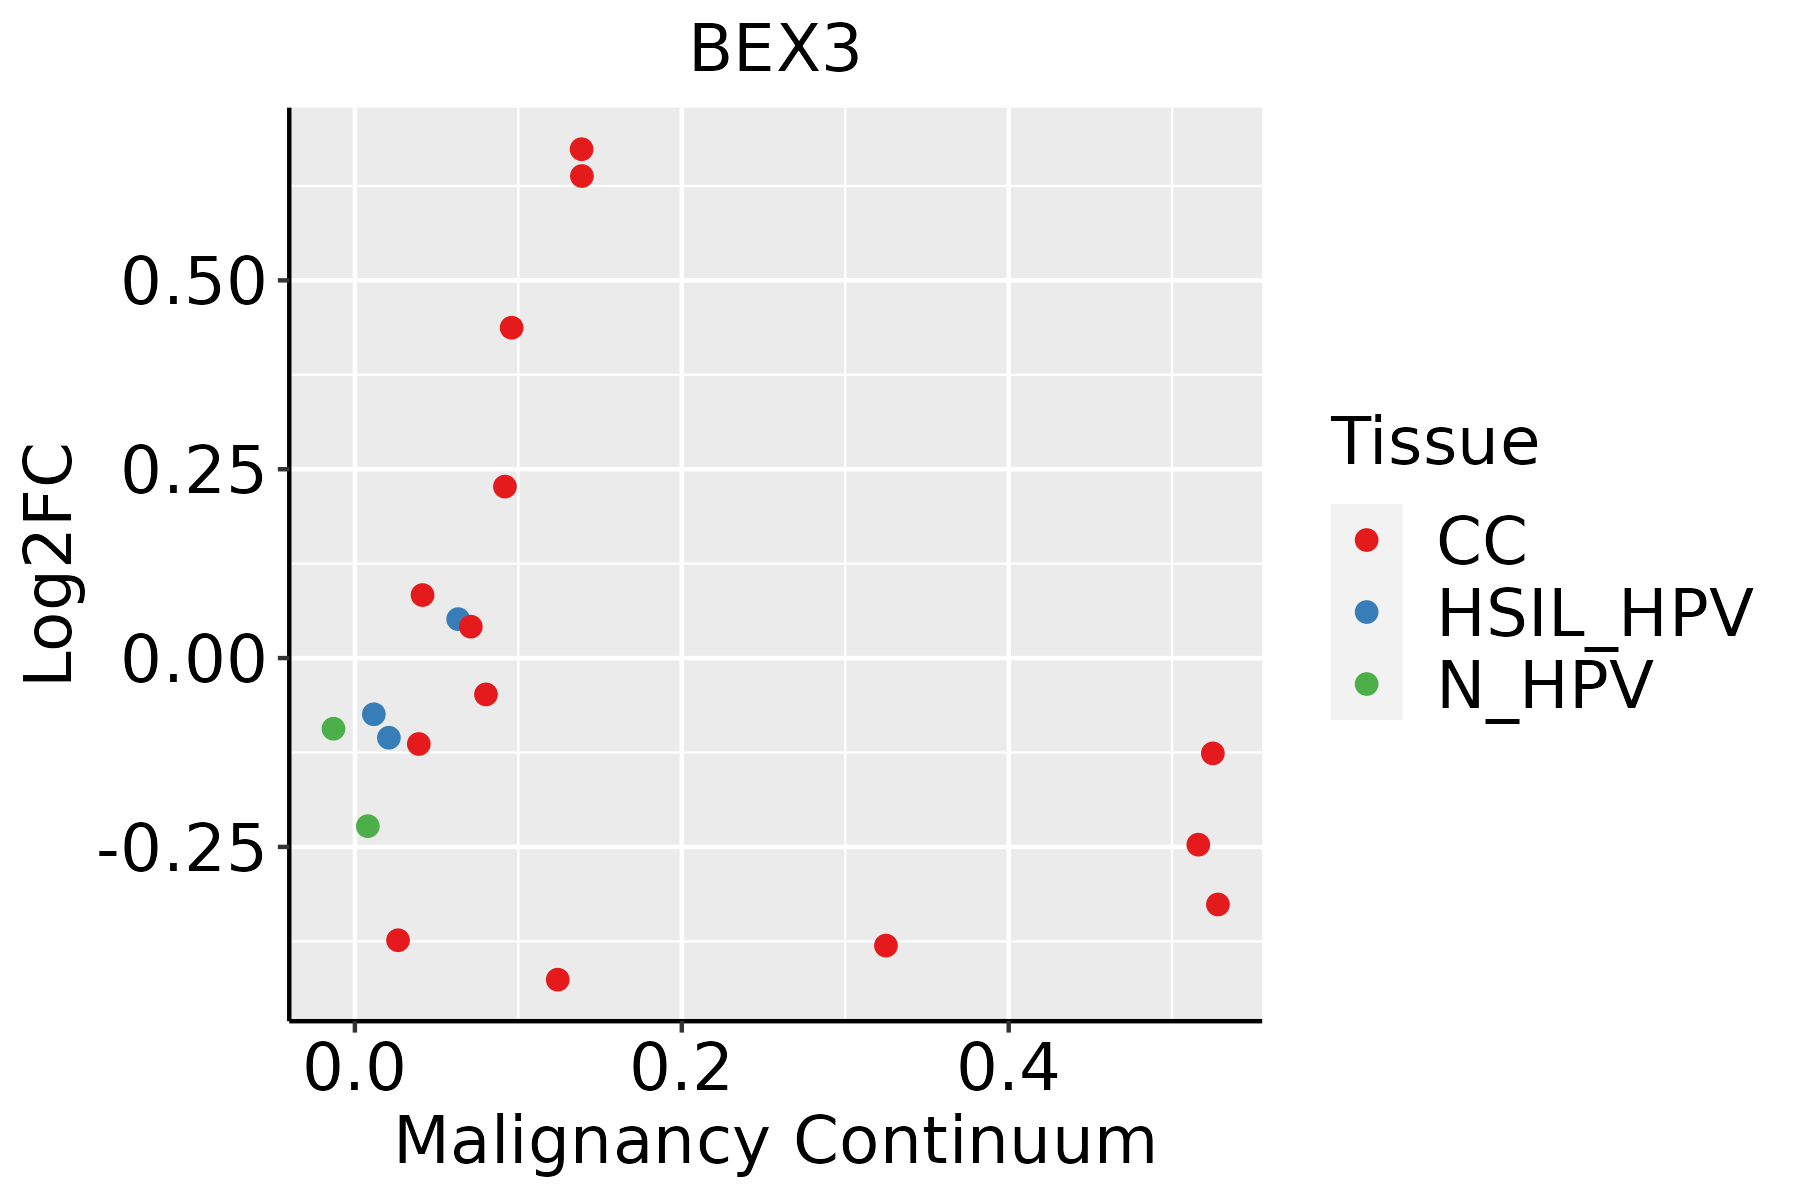 | CC: Cervix cancer |
| HSIL_HPV: HPV-infected high-grade squamous intraepithelial lesions | ||
| N_HPV: HPV-infected normal cervix | ||
| Colorectum (GSE201348) | 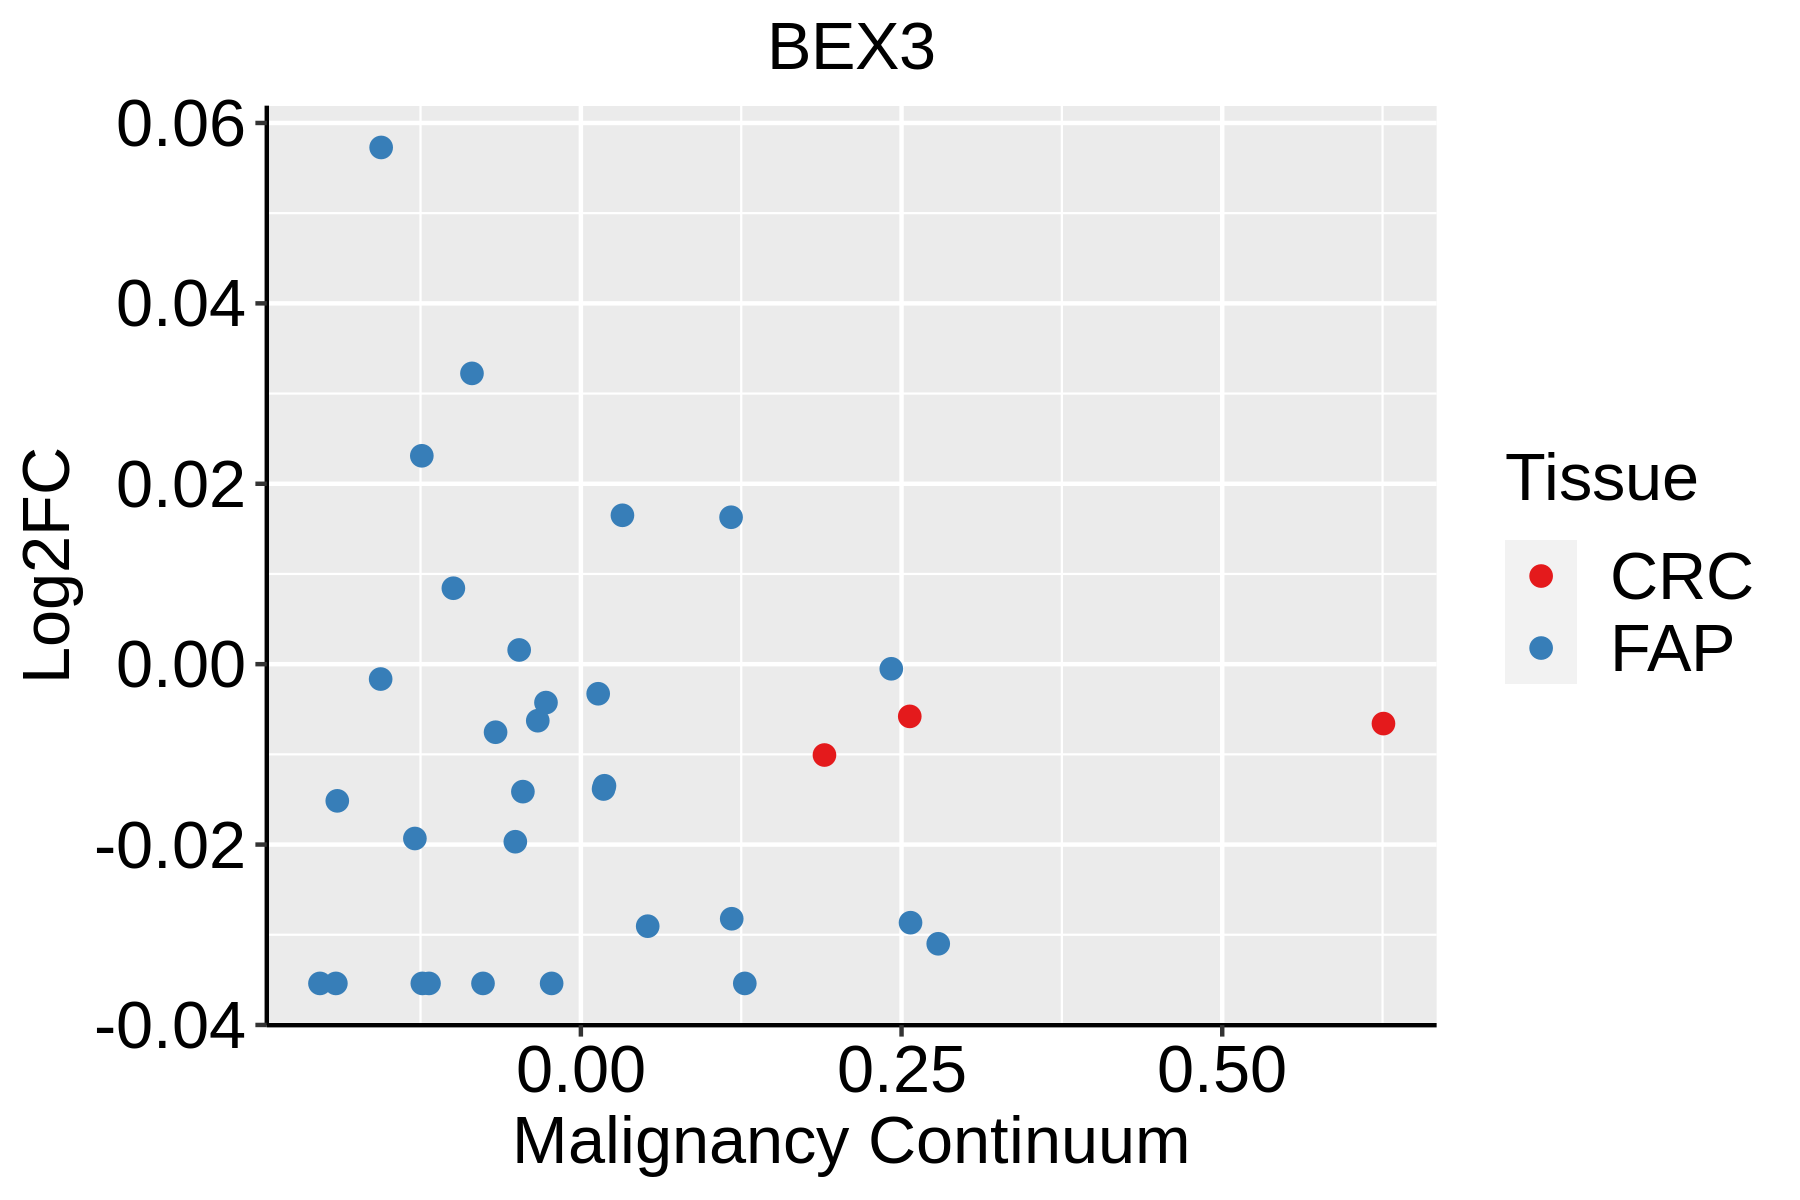 | FAP: Familial adenomatous polyposis |
| CRC: Colorectal cancer | ||
| Colorectum (HTA11) | 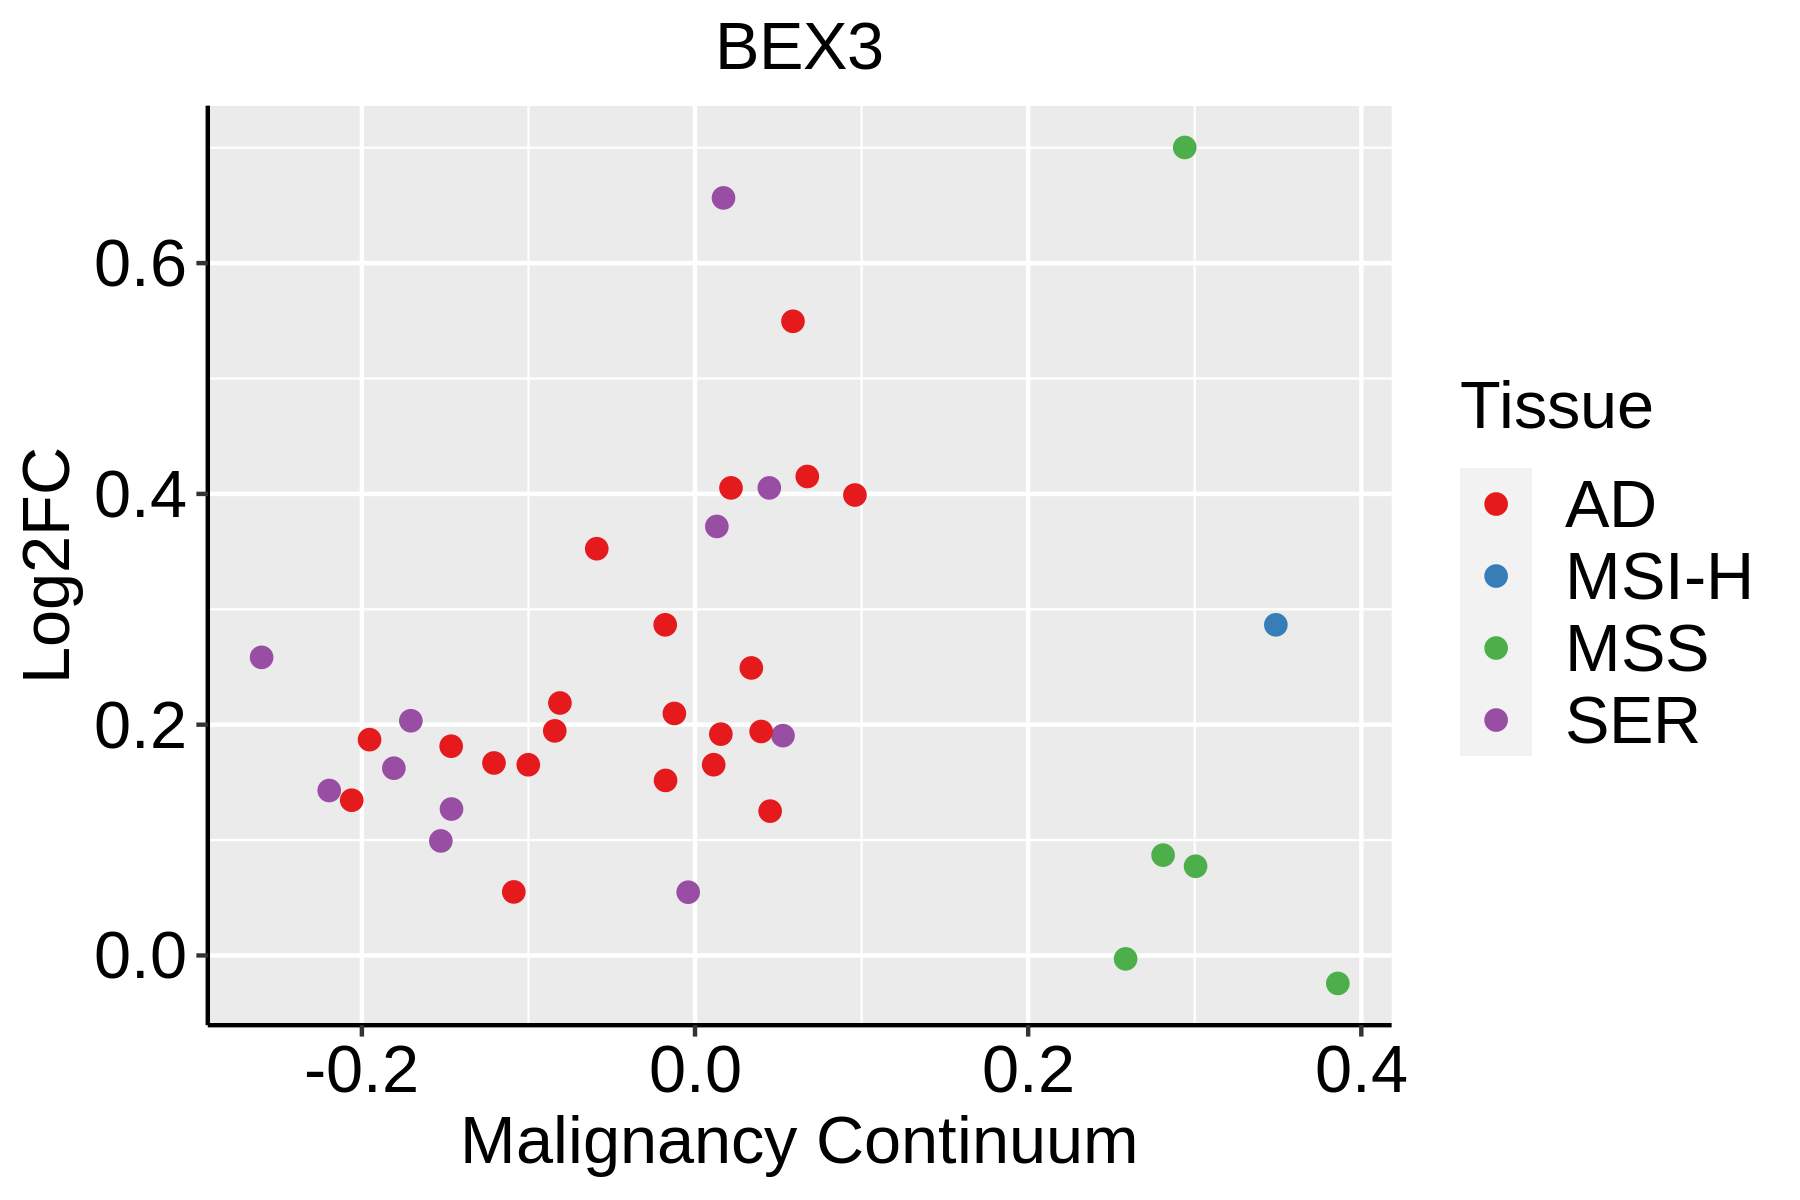 | AD: Adenomas |
| SER: Sessile serrated lesions | ||
| MSI-H: Microsatellite-high colorectal cancer | ||
| MSS: Microsatellite stable colorectal cancer | ||
| Endometrium |  | AEH: Atypical endometrial hyperplasia |
| EEC: Endometrioid Cancer | ||
| Esophagus | 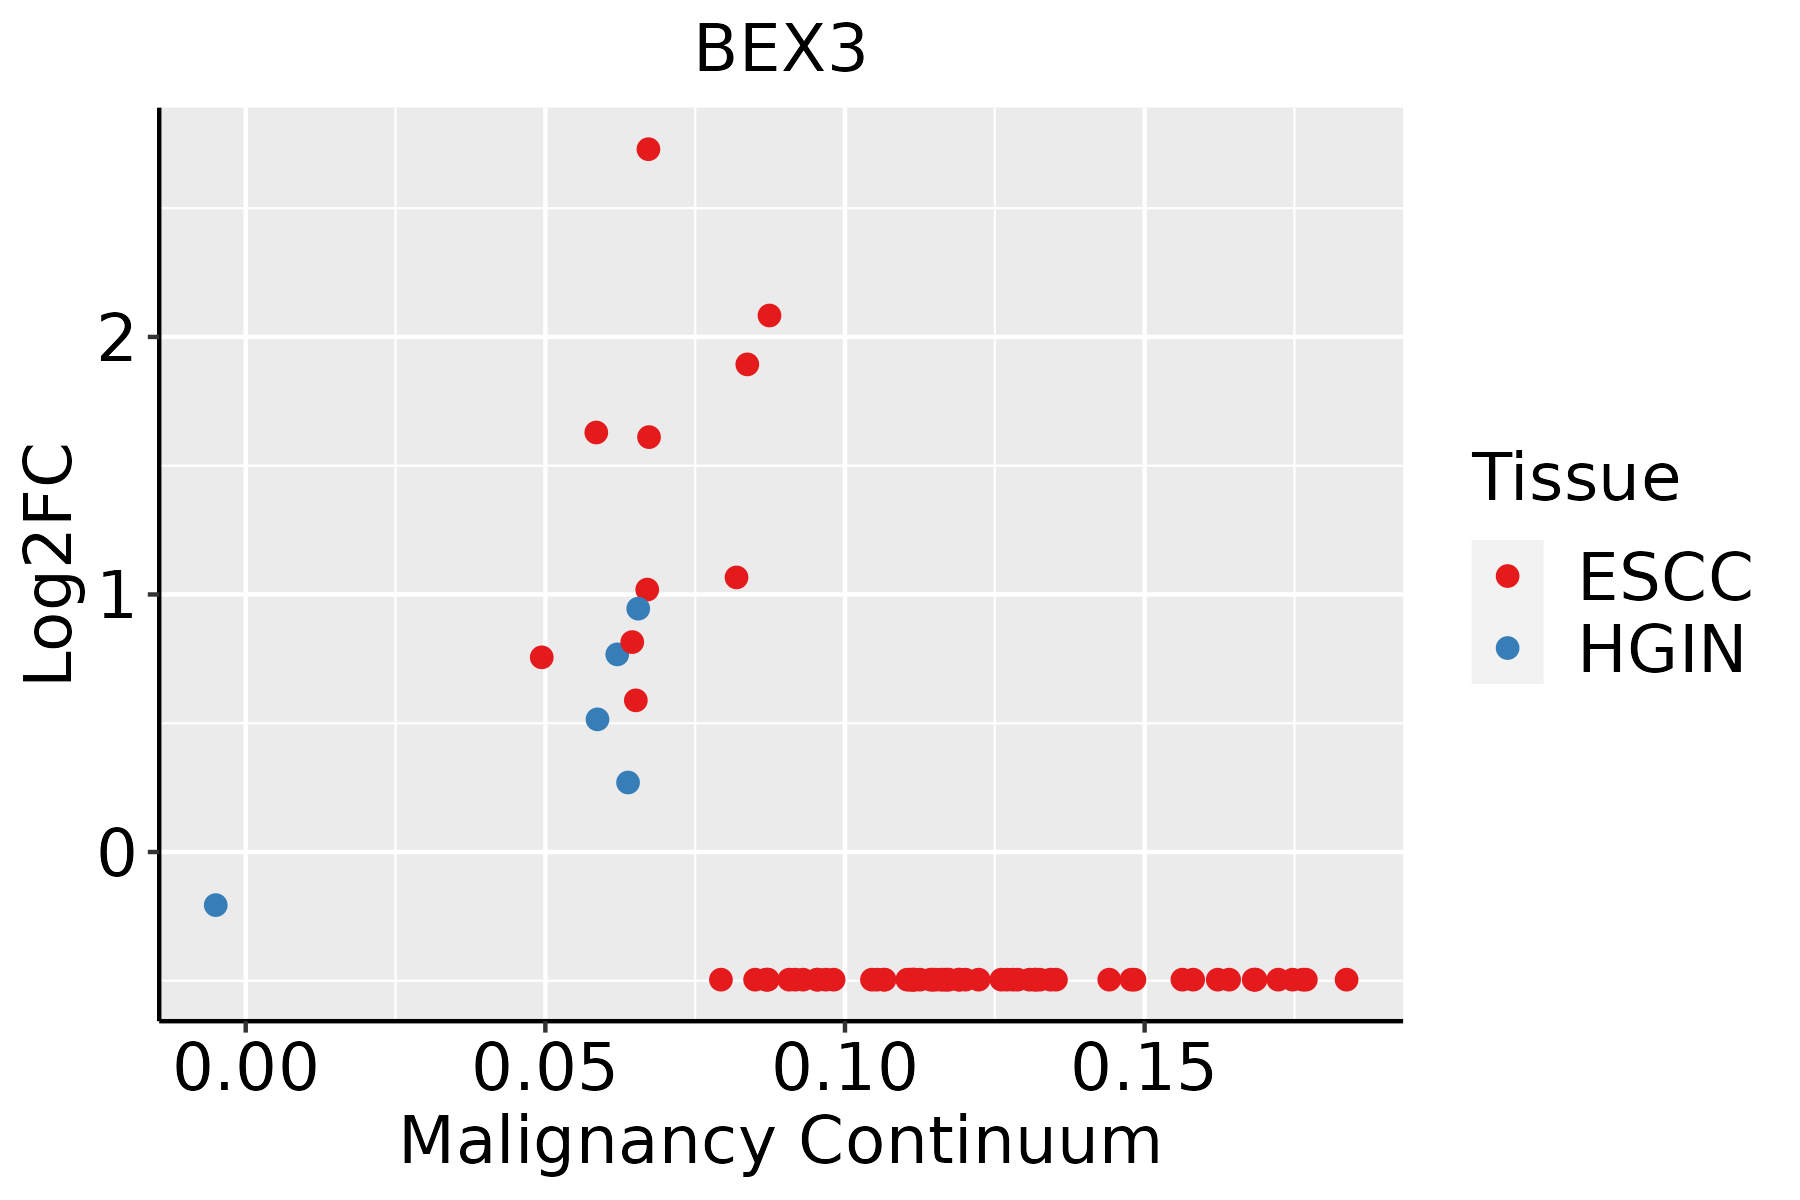 | ESCC: Esophageal squamous cell carcinoma |
| HGIN: High-grade intraepithelial neoplasias | ||
| LGIN: Low-grade intraepithelial neoplasias | ||
| Liver | 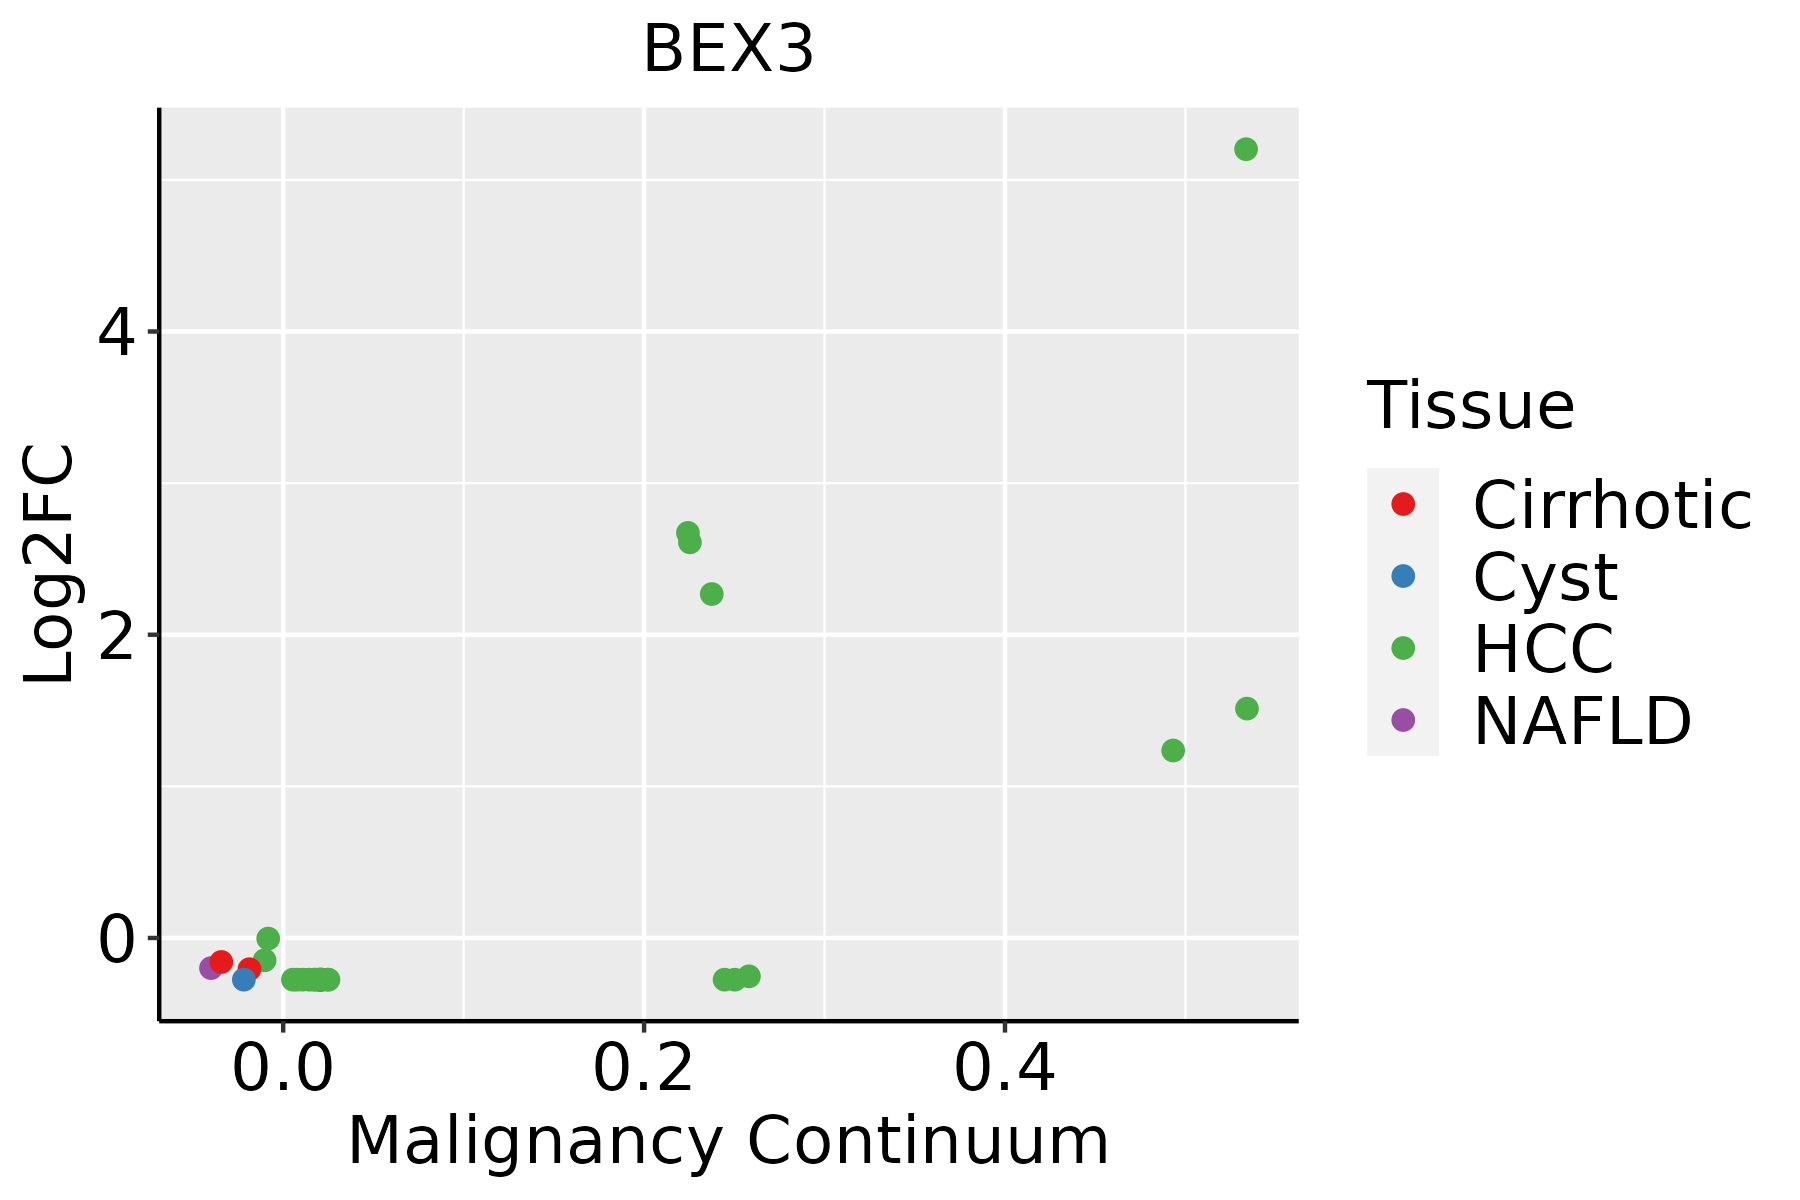 | HCC: Hepatocellular carcinoma |
| NAFLD: Non-alcoholic fatty liver disease | ||
| Prostate | 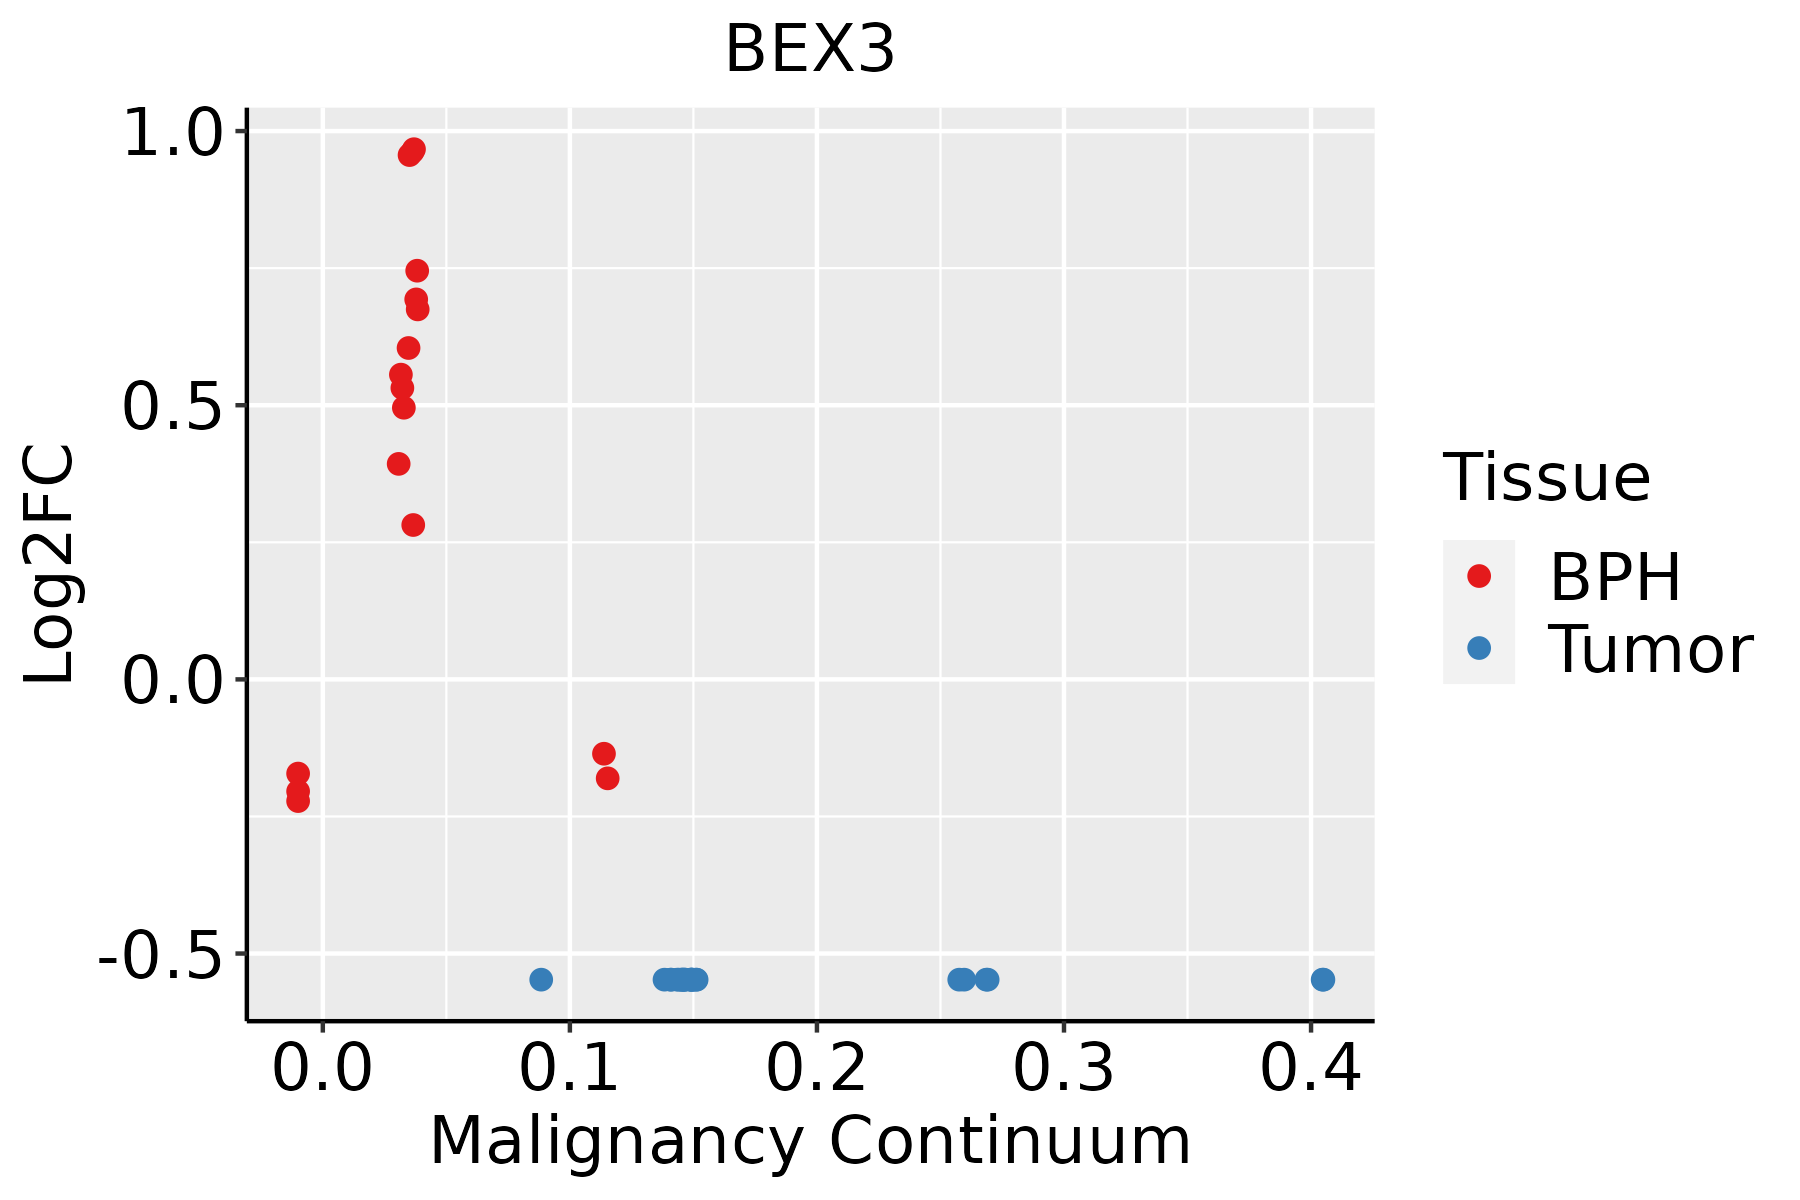 | BPH: Benign Prostatic Hyperplasia |
| Thyroid |  | ATC: Anaplastic thyroid cancer |
| HT: Hashimoto's thyroiditis | ||
| PTC: Papillary thyroid cancer |
| ∗log2FC in expression of this searched gene in stem-like cells from each diseased tissue sample relative to stem-like cells in normal samples in each tissue plotted against the malignancy continuum. Samples are colored based on if they are from different disease stage. |
Top |
Malignant transformation related pathway analysis |
| Find out the enriched GO biological processes and KEGG pathways involved in transition from healthy to precancer to cancer |
| Tissue | Disease Stage | Enriched GO biological Processes |
| Thyroid | PTC |  |
| Thyroid | goiters |  |
| Thyroid | ATC |  |
| ∗Top 15 enriched GO BP terms are showed in the bar plot of each disease state in each tissue. Each row represents a significant GO biological process which is colored according to the -log10(p.adjust). |
| Page: 1 2 3 4 5 6 7 8 9 |
| GO ID | Tissue | Disease Stage | Description | Gene Ratio | Bg Ratio | pvalue | p.adjust | Count |
| GO:00525479 | Breast | Precancer | regulation of peptidase activity | 71/1080 | 461/18723 | 2.72e-14 | 6.94e-12 | 71 |
| GO:00525489 | Breast | Precancer | regulation of endopeptidase activity | 67/1080 | 432/18723 | 1.06e-13 | 2.36e-11 | 67 |
| GO:20001169 | Breast | Precancer | regulation of cysteine-type endopeptidase activity | 43/1080 | 235/18723 | 1.30e-11 | 1.83e-09 | 43 |
| GO:00432819 | Breast | Precancer | regulation of cysteine-type endopeptidase activity involved in apoptotic process | 40/1080 | 209/18723 | 1.59e-11 | 2.07e-09 | 40 |
| GO:00458629 | Breast | Precancer | positive regulation of proteolysis | 51/1080 | 372/18723 | 7.77e-09 | 5.70e-07 | 51 |
| GO:00109529 | Breast | Precancer | positive regulation of peptidase activity | 33/1080 | 197/18723 | 3.01e-08 | 1.89e-06 | 33 |
| GO:00432808 | Breast | Precancer | positive regulation of cysteine-type endopeptidase activity involved in apoptotic process | 24/1080 | 129/18723 | 3.13e-07 | 1.50e-05 | 24 |
| GO:00109509 | Breast | Precancer | positive regulation of endopeptidase activity | 29/1080 | 179/18723 | 4.23e-07 | 1.90e-05 | 29 |
| GO:20010568 | Breast | Precancer | positive regulation of cysteine-type endopeptidase activity | 25/1080 | 148/18723 | 1.19e-06 | 4.60e-05 | 25 |
| GO:00971919 | Breast | Precancer | extrinsic apoptotic signaling pathway | 30/1080 | 219/18723 | 9.42e-06 | 2.50e-04 | 30 |
| GO:00069193 | Breast | Precancer | activation of cysteine-type endopeptidase activity involved in apoptotic process | 14/1080 | 78/18723 | 1.33e-04 | 2.31e-03 | 14 |
| GO:00086258 | Breast | Precancer | extrinsic apoptotic signaling pathway via death domain receptors | 11/1080 | 82/18723 | 7.29e-03 | 4.88e-02 | 11 |
| GO:005254714 | Breast | IDC | regulation of peptidase activity | 96/1434 | 461/18723 | 7.58e-20 | 6.15e-17 | 96 |
| GO:005254814 | Breast | IDC | regulation of endopeptidase activity | 88/1434 | 432/18723 | 1.20e-17 | 4.85e-15 | 88 |
| GO:200011614 | Breast | IDC | regulation of cysteine-type endopeptidase activity | 55/1434 | 235/18723 | 4.25e-14 | 1.21e-11 | 55 |
| GO:004328114 | Breast | IDC | regulation of cysteine-type endopeptidase activity involved in apoptotic process | 50/1434 | 209/18723 | 2.49e-13 | 6.14e-11 | 50 |
| GO:004586214 | Breast | IDC | positive regulation of proteolysis | 66/1434 | 372/18723 | 9.76e-11 | 1.29e-08 | 66 |
| GO:001095214 | Breast | IDC | positive regulation of peptidase activity | 40/1434 | 197/18723 | 1.04e-08 | 7.67e-07 | 40 |
| GO:009719114 | Breast | IDC | extrinsic apoptotic signaling pathway | 42/1434 | 219/18723 | 2.56e-08 | 1.73e-06 | 42 |
| GO:004328013 | Breast | IDC | positive regulation of cysteine-type endopeptidase activity involved in apoptotic process | 29/1434 | 129/18723 | 1.10e-07 | 6.35e-06 | 29 |
| Page: 1 2 3 4 5 6 7 8 9 10 11 |
| Pathway ID | Tissue | Disease Stage | Description | Gene Ratio | Bg Ratio | pvalue | p.adjust | qvalue | Count |
| hsa04722 | Colorectum | AD | Neurotrophin signaling pathway | 50/2092 | 119/8465 | 2.28e-05 | 2.24e-04 | 1.43e-04 | 50 |
| hsa047221 | Colorectum | AD | Neurotrophin signaling pathway | 50/2092 | 119/8465 | 2.28e-05 | 2.24e-04 | 1.43e-04 | 50 |
| hsa047222 | Colorectum | SER | Neurotrophin signaling pathway | 35/1580 | 119/8465 | 2.80e-03 | 2.02e-02 | 1.47e-02 | 35 |
| hsa047223 | Colorectum | SER | Neurotrophin signaling pathway | 35/1580 | 119/8465 | 2.80e-03 | 2.02e-02 | 1.47e-02 | 35 |
| hsa047224 | Colorectum | MSS | Neurotrophin signaling pathway | 45/1875 | 119/8465 | 7.04e-05 | 6.55e-04 | 4.02e-04 | 45 |
| hsa047225 | Colorectum | MSS | Neurotrophin signaling pathway | 45/1875 | 119/8465 | 7.04e-05 | 6.55e-04 | 4.02e-04 | 45 |
| hsa0472216 | Endometrium | AEH | Neurotrophin signaling pathway | 31/1197 | 119/8465 | 4.07e-04 | 3.07e-03 | 2.25e-03 | 31 |
| hsa0472217 | Endometrium | AEH | Neurotrophin signaling pathway | 31/1197 | 119/8465 | 4.07e-04 | 3.07e-03 | 2.25e-03 | 31 |
| hsa0472222 | Endometrium | EEC | Neurotrophin signaling pathway | 30/1237 | 119/8465 | 1.54e-03 | 9.55e-03 | 7.12e-03 | 30 |
| hsa0472232 | Endometrium | EEC | Neurotrophin signaling pathway | 30/1237 | 119/8465 | 1.54e-03 | 9.55e-03 | 7.12e-03 | 30 |
| hsa0472225 | Esophagus | ESCC | Neurotrophin signaling pathway | 80/4205 | 119/8465 | 7.33e-05 | 3.07e-04 | 1.57e-04 | 80 |
| hsa04722111 | Esophagus | ESCC | Neurotrophin signaling pathway | 80/4205 | 119/8465 | 7.33e-05 | 3.07e-04 | 1.57e-04 | 80 |
| hsa0472210 | Liver | HCC | Neurotrophin signaling pathway | 74/4020 | 119/8465 | 8.27e-04 | 3.26e-03 | 1.81e-03 | 74 |
| hsa0472211 | Liver | HCC | Neurotrophin signaling pathway | 74/4020 | 119/8465 | 8.27e-04 | 3.26e-03 | 1.81e-03 | 74 |
| hsa0472218 | Prostate | BPH | Neurotrophin signaling pathway | 38/1718 | 119/8465 | 1.76e-03 | 7.16e-03 | 4.43e-03 | 38 |
| hsa0472219 | Prostate | BPH | Neurotrophin signaling pathway | 38/1718 | 119/8465 | 1.76e-03 | 7.16e-03 | 4.43e-03 | 38 |
| hsa0472223 | Prostate | Tumor | Neurotrophin signaling pathway | 39/1791 | 119/8465 | 2.01e-03 | 8.10e-03 | 5.02e-03 | 39 |
| hsa0472233 | Prostate | Tumor | Neurotrophin signaling pathway | 39/1791 | 119/8465 | 2.01e-03 | 8.10e-03 | 5.02e-03 | 39 |
| Page: 1 |
Top |
Cell-cell communication analysis |
| Identification of potential cell-cell interactions between two cell types and their ligand-receptor pairs for different disease states |
| Ligand | Receptor | LRpair | Pathway | Tissue | Disease Stage |
| Page: 1 |
Top |
Single-cell gene regulatory network inference analysis |
| Find out the significant the regulons (TFs) and the target genes of each regulon across cell types for different disease states |
| TF | Cell Type | Tissue | Disease Stage | Target Gene | RSS | Regulon Activity |
| ∗The dot plots of a searched regulon are shown for all cell subpopulations in each disease state of each tissue based on the regulon specific score inferred using pySCENIC and by calculating the average expression. |
| Page: 1 |
Top |
Somatic mutation of malignant transformation related genes |
| Annotation of somatic variants for genes involved in malignant transformation |
| Hugo Symbol | Variant Class | Variant Classification | dbSNP RS | HGVSc | HGVSp | HGVSp Short | SWISSPROT | BIOTYPE | SIFT | PolyPhen | Tumor Sample Barcode | Tissue | Histology | Sex | Age | Stage | Therapy Types | Drugs | Outcome |
| BEX3 | SNV | Missense_Mutation | c.271N>T | p.Arg91Cys | p.R91C | Q00994 | protein_coding | tolerated(0.08) | benign(0) | TCGA-A8-A09Z-01 | Breast | breast invasive carcinoma | Female | >=65 | I/II | Unknown | Unknown | SD | |
| BEX3 | SNV | Missense_Mutation | c.222N>A | p.Met74Ile | p.M74I | Q00994 | protein_coding | tolerated(0.05) | benign(0) | TCGA-C8-A1HE-01 | Breast | breast invasive carcinoma | Female | <65 | I/II | Unknown | Unknown | SD | |
| BEX3 | SNV | Missense_Mutation | c.149N>T | p.Ala50Val | p.A50V | Q00994 | protein_coding | tolerated(0.13) | benign(0) | TCGA-D8-A1XK-01 | Breast | breast invasive carcinoma | Female | <65 | I/II | Chemotherapy | doxorubicine+cyclophosphamide | SD | |
| BEX3 | SNV | Missense_Mutation | c.222N>A | p.Met74Ile | p.M74I | Q00994 | protein_coding | tolerated(0.05) | benign(0) | TCGA-ZJ-AAXU-01 | Cervix | cervical & endocervical cancer | Female | <65 | I/II | Unknown | Unknown | SD | |
| BEX3 | SNV | Missense_Mutation | c.211A>G | p.Met71Val | p.M71V | Q00994 | protein_coding | tolerated(1) | possibly_damaging(0.621) | TCGA-CK-5913-01 | Colorectum | colon adenocarcinoma | Female | <65 | I/II | Unknown | Unknown | SD | |
| BEX3 | SNV | Missense_Mutation | c.313N>A | p.Asp105Asn | p.D105N | Q00994 | protein_coding | deleterious(0.04) | benign(0) | TCGA-AG-3890-01 | Colorectum | rectum adenocarcinoma | Male | <65 | I/II | Unknown | Unknown | SD | |
| BEX3 | SNV | Missense_Mutation | c.196N>T | p.Asp66Tyr | p.D66Y | Q00994 | protein_coding | deleterious(0) | probably_damaging(0.988) | TCGA-F5-6814-01 | Colorectum | rectum adenocarcinoma | Male | <65 | I/II | Unknown | Unknown | SD | |
| BEX3 | SNV | Missense_Mutation | c.307N>T | p.His103Tyr | p.H103Y | Q00994 | protein_coding | deleterious(0) | probably_damaging(0.913) | TCGA-AP-A0LM-01 | Endometrium | uterine corpus endometrioid carcinoma | Female | <65 | III/IV | Chemotherapy | cisplatin | SD | |
| BEX3 | SNV | Missense_Mutation | c.271N>T | p.Arg91Cys | p.R91C | Q00994 | protein_coding | tolerated(0.08) | benign(0) | TCGA-AP-A1DV-01 | Endometrium | uterine corpus endometrioid carcinoma | Female | <65 | I/II | Unknown | Unknown | SD | |
| BEX3 | SNV | Missense_Mutation | c.280N>G | p.Met94Val | p.M94V | Q00994 | protein_coding | tolerated(0.19) | benign(0.013) | TCGA-BG-A18B-01 | Endometrium | uterine corpus endometrioid carcinoma | Female | <65 | I/II | Unknown | Unknown | SD |
| Page: 1 2 |
Top |
Related drugs of malignant transformation related genes |
| Identification of chemicals and drugs interact with genes involved in malignant transfromation |
| (DGIdb 4.0) |
| Entrez ID | Symbol | Category | Interaction Types | Drug Claim Name | Drug Name | PMIDs |
| Page: 1 |

Copyright 2023-Present -The University of Texas Health Science Center at Houston |