
|
|||||
|
 | |
| |
| |
| |
| |
| |
|
Gene: AGAP3 |
Gene summary for AGAP3 |
| Gene information | Species | Human | Gene symbol | AGAP3 | Gene ID | 116988 |
| Gene name | ArfGAP with GTPase domain, ankyrin repeat and PH domain 3 | |
| Gene Alias | AGAP-3 | |
| Cytomap | 7q36.1 | |
| Gene Type | protein-coding | GO ID | GO:0000302 | UniProtAcc | Q86ST5 |
Top |
Malignant transformation analysis |
| Identification of the aberrant gene expression in precancerous and cancerous lesions by comparing the gene expression of stem-like cells in diseased tissues with normal stem cells |
| Entrez ID | Symbol | Replicates | Species | Organ | Tissue | Adj P-value | Log2FC | Malignancy |
| 116988 | AGAP3 | HTA11_2487_2000001011 | Human | Colorectum | SER | 2.39e-03 | 3.08e-01 | -0.1808 |
| 116988 | AGAP3 | HTA11_696_2000001011 | Human | Colorectum | AD | 2.03e-03 | 1.96e-01 | -0.1464 |
| 116988 | AGAP3 | HTA11_1391_2000001011 | Human | Colorectum | AD | 3.90e-04 | 3.60e-01 | -0.059 |
| 116988 | AGAP3 | HTA11_7696_3000711011 | Human | Colorectum | AD | 1.85e-04 | 2.57e-01 | 0.0674 |
| 116988 | AGAP3 | HTA11_6818_2000001021 | Human | Colorectum | AD | 1.13e-04 | 2.87e-01 | 0.0588 |
| 116988 | AGAP3 | HTA11_99999970781_79442 | Human | Colorectum | MSS | 1.57e-06 | 2.62e-01 | 0.294 |
| 116988 | AGAP3 | HTA11_99999971662_82457 | Human | Colorectum | MSS | 1.28e-26 | 7.51e-01 | 0.3859 |
| 116988 | AGAP3 | HTA11_99999973899_84307 | Human | Colorectum | MSS | 1.62e-05 | 5.18e-01 | 0.2585 |
| 116988 | AGAP3 | HTA11_99999974143_84620 | Human | Colorectum | MSS | 5.26e-10 | 4.57e-01 | 0.3005 |
| 116988 | AGAP3 | A002-C-116 | Human | Colorectum | FAP | 3.32e-03 | -1.68e-01 | -0.0452 |
| 116988 | AGAP3 | LZE7T | Human | Esophagus | ESCC | 4.37e-04 | 2.15e-01 | 0.0667 |
| 116988 | AGAP3 | LZE24T | Human | Esophagus | ESCC | 1.02e-06 | 1.12e-02 | 0.0596 |
| 116988 | AGAP3 | P1T-E | Human | Esophagus | ESCC | 1.84e-11 | 2.96e-01 | 0.0875 |
| 116988 | AGAP3 | P2T-E | Human | Esophagus | ESCC | 5.58e-09 | -3.55e-03 | 0.1177 |
| 116988 | AGAP3 | P4T-E | Human | Esophagus | ESCC | 2.88e-10 | 6.75e-02 | 0.1323 |
| 116988 | AGAP3 | P5T-E | Human | Esophagus | ESCC | 1.26e-10 | 1.10e-01 | 0.1327 |
| 116988 | AGAP3 | P8T-E | Human | Esophagus | ESCC | 1.74e-20 | 2.19e-01 | 0.0889 |
| 116988 | AGAP3 | P9T-E | Human | Esophagus | ESCC | 7.30e-09 | 7.99e-02 | 0.1131 |
| 116988 | AGAP3 | P10T-E | Human | Esophagus | ESCC | 8.72e-12 | 9.39e-02 | 0.116 |
| 116988 | AGAP3 | P11T-E | Human | Esophagus | ESCC | 7.28e-04 | 9.02e-02 | 0.1426 |
| Page: 1 2 3 4 5 |
| Tissue | Expression Dynamics | Abbreviation |
| Colorectum (GSE201348) |  | FAP: Familial adenomatous polyposis |
| CRC: Colorectal cancer | ||
| Colorectum (HTA11) |  | AD: Adenomas |
| SER: Sessile serrated lesions | ||
| MSI-H: Microsatellite-high colorectal cancer | ||
| MSS: Microsatellite stable colorectal cancer | ||
| Esophagus |  | ESCC: Esophageal squamous cell carcinoma |
| HGIN: High-grade intraepithelial neoplasias | ||
| LGIN: Low-grade intraepithelial neoplasias | ||
| Liver | 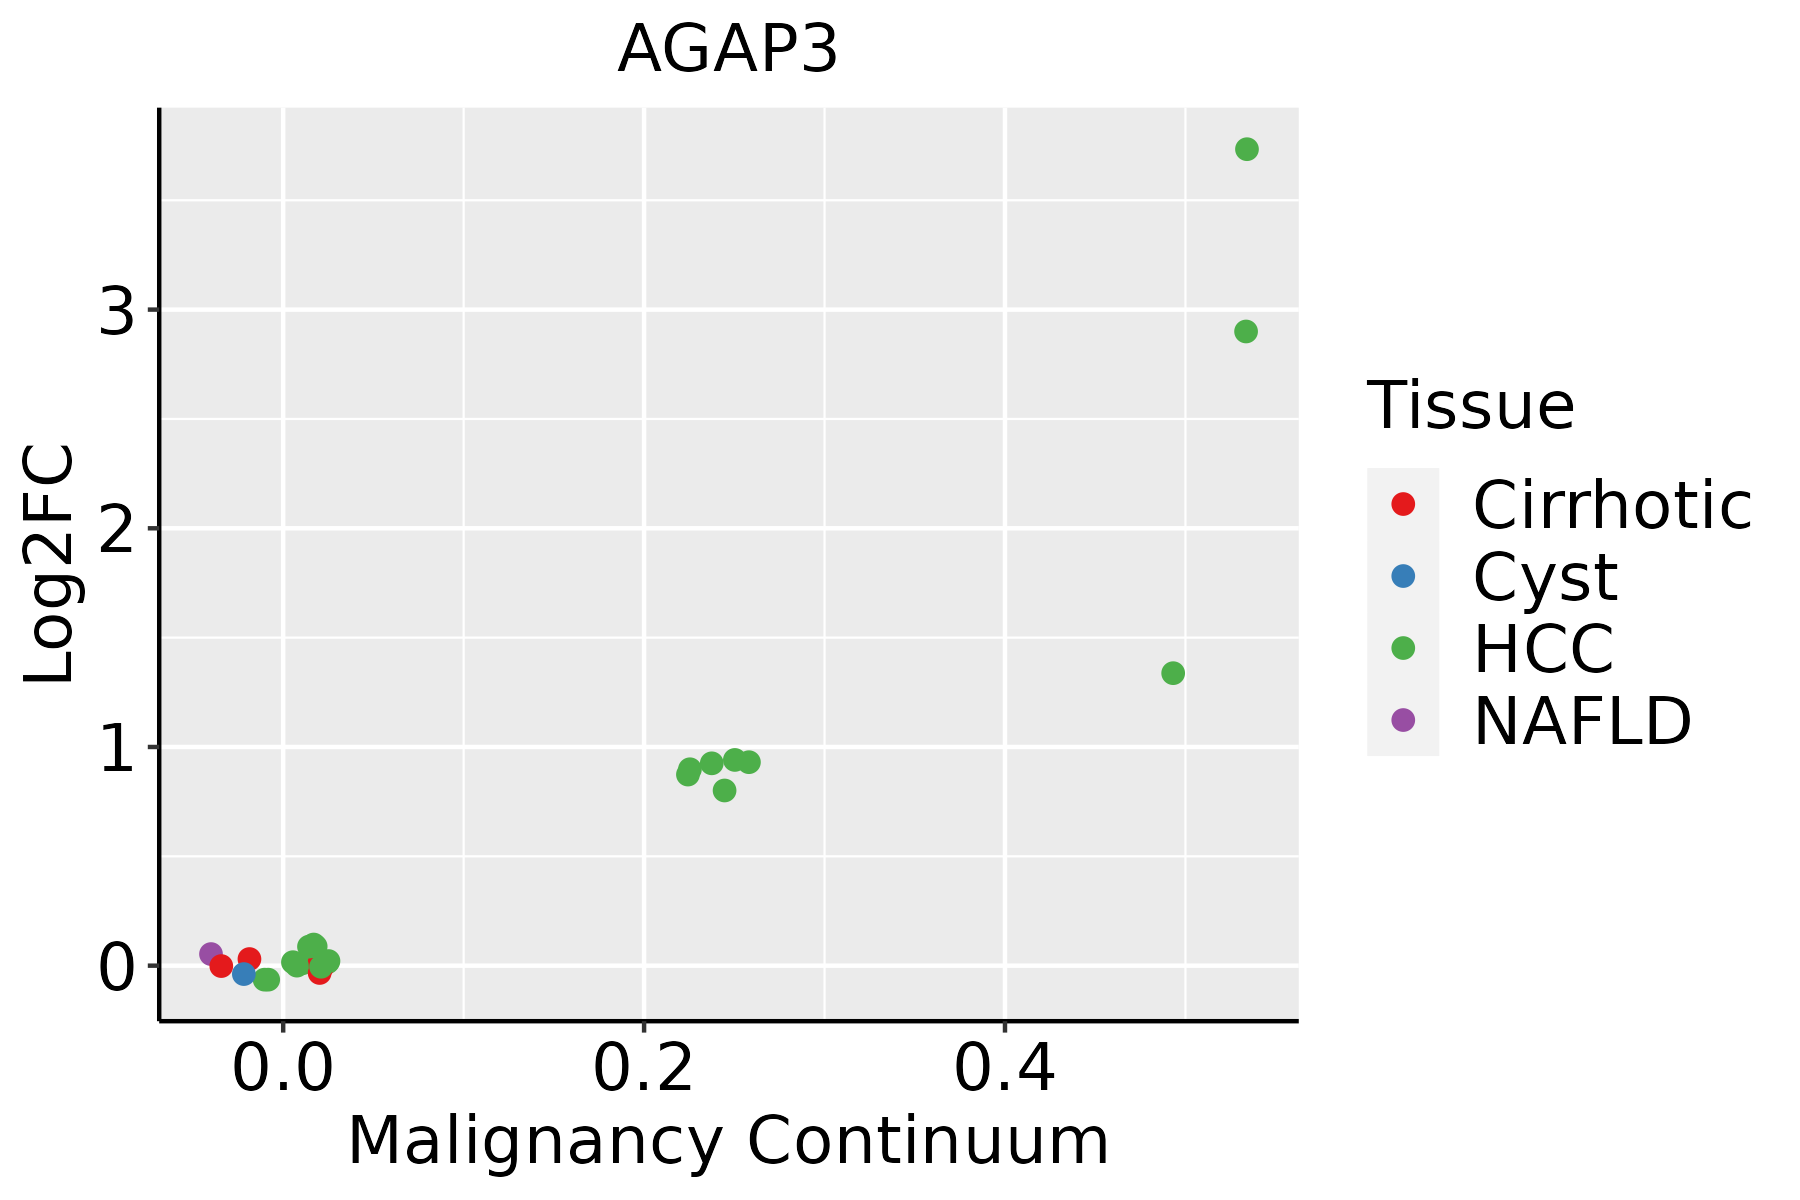 | HCC: Hepatocellular carcinoma |
| NAFLD: Non-alcoholic fatty liver disease | ||
| Oral Cavity |  | EOLP: Erosive Oral lichen planus |
| LP: leukoplakia | ||
| NEOLP: Non-erosive oral lichen planus | ||
| OSCC: Oral squamous cell carcinoma | ||
| Thyroid | 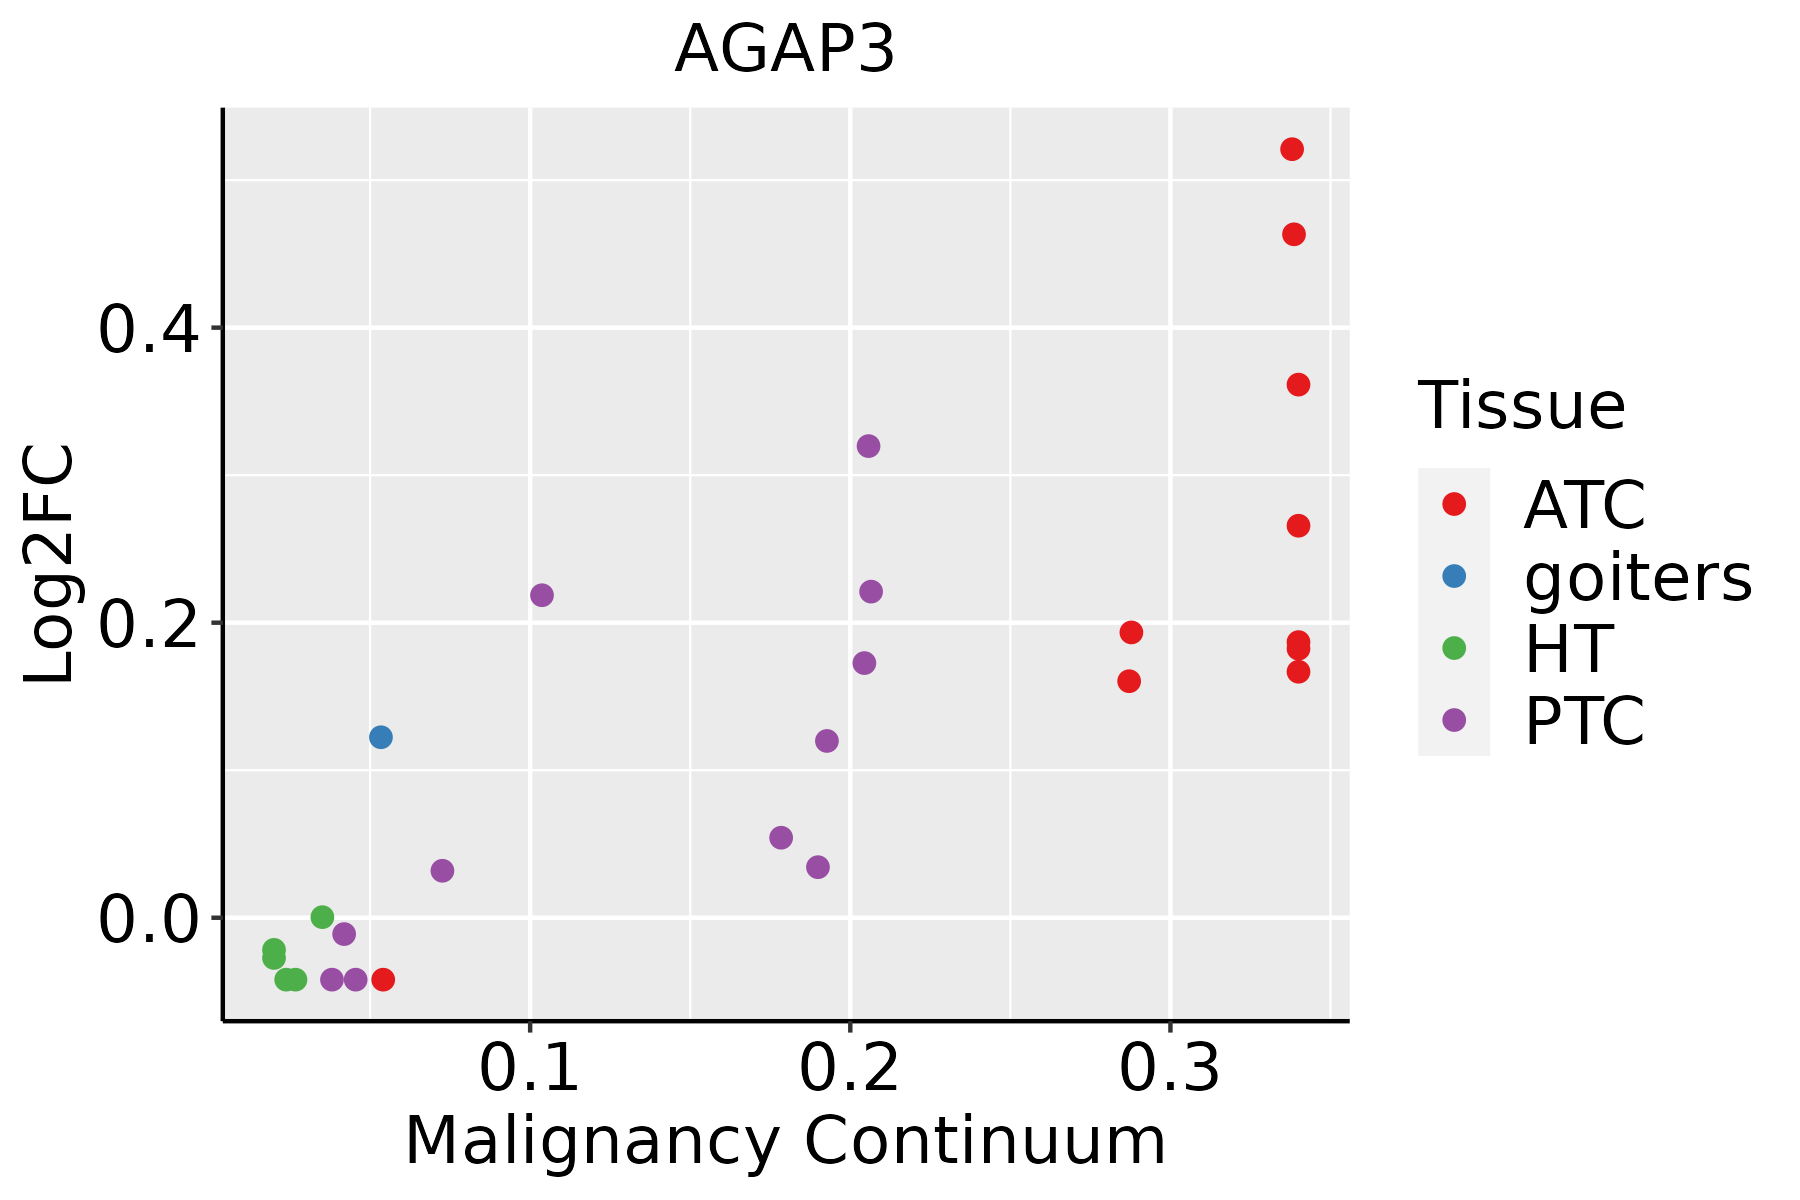 | ATC: Anaplastic thyroid cancer |
| HT: Hashimoto's thyroiditis | ||
| PTC: Papillary thyroid cancer |
| ∗log2FC in expression of this searched gene in stem-like cells from each diseased tissue sample relative to stem-like cells in normal samples in each tissue plotted against the malignancy continuum. Samples are colored based on if they are from different disease stage. |
Top |
Malignant transformation related pathway analysis |
| Find out the enriched GO biological processes and KEGG pathways involved in transition from healthy to precancer to cancer |
| Tissue | Disease Stage | Enriched GO biological Processes |
| Thyroid | PTC |  |
| Thyroid | goiters |  |
| Thyroid | ATC |  |
| ∗Top 15 enriched GO BP terms are showed in the bar plot of each disease state in each tissue. Each row represents a significant GO biological process which is colored according to the -log10(p.adjust). |
| Page: 1 2 3 4 5 6 7 8 9 |
| GO ID | Tissue | Disease Stage | Description | Gene Ratio | Bg Ratio | pvalue | p.adjust | Count |
| GO:0010498 | Colorectum | AD | proteasomal protein catabolic process | 174/3918 | 490/18723 | 3.18e-14 | 7.66e-12 | 174 |
| GO:0043161 | Colorectum | AD | proteasome-mediated ubiquitin-dependent protein catabolic process | 141/3918 | 412/18723 | 1.77e-10 | 1.68e-08 | 141 |
| GO:0006979 | Colorectum | AD | response to oxidative stress | 145/3918 | 446/18723 | 5.16e-09 | 3.23e-07 | 145 |
| GO:0062197 | Colorectum | AD | cellular response to chemical stress | 109/3918 | 337/18723 | 5.33e-07 | 1.95e-05 | 109 |
| GO:0000302 | Colorectum | AD | response to reactive oxygen species | 78/3918 | 222/18723 | 6.17e-07 | 2.21e-05 | 78 |
| GO:0034599 | Colorectum | AD | cellular response to oxidative stress | 94/3918 | 288/18723 | 2.03e-06 | 6.02e-05 | 94 |
| GO:0034614 | Colorectum | AD | cellular response to reactive oxygen species | 50/3918 | 155/18723 | 6.25e-04 | 6.49e-03 | 50 |
| GO:00104981 | Colorectum | SER | proteasomal protein catabolic process | 132/2897 | 490/18723 | 3.08e-11 | 5.55e-09 | 132 |
| GO:00069791 | Colorectum | SER | response to oxidative stress | 114/2897 | 446/18723 | 1.75e-08 | 1.28e-06 | 114 |
| GO:00431611 | Colorectum | SER | proteasome-mediated ubiquitin-dependent protein catabolic process | 105/2897 | 412/18723 | 7.48e-08 | 4.70e-06 | 105 |
| GO:00003021 | Colorectum | SER | response to reactive oxygen species | 65/2897 | 222/18723 | 1.21e-07 | 7.29e-06 | 65 |
| GO:00621971 | Colorectum | SER | cellular response to chemical stress | 87/2897 | 337/18723 | 5.33e-07 | 2.59e-05 | 87 |
| GO:00345991 | Colorectum | SER | cellular response to oxidative stress | 73/2897 | 288/18723 | 8.52e-06 | 2.86e-04 | 73 |
| GO:00346141 | Colorectum | SER | cellular response to reactive oxygen species | 41/2897 | 155/18723 | 2.89e-04 | 4.74e-03 | 41 |
| GO:00104982 | Colorectum | MSS | proteasomal protein catabolic process | 157/3467 | 490/18723 | 2.39e-13 | 5.25e-11 | 157 |
| GO:00431612 | Colorectum | MSS | proteasome-mediated ubiquitin-dependent protein catabolic process | 127/3467 | 412/18723 | 7.70e-10 | 6.32e-08 | 127 |
| GO:00069792 | Colorectum | MSS | response to oxidative stress | 128/3467 | 446/18723 | 7.65e-08 | 3.81e-06 | 128 |
| GO:00621972 | Colorectum | MSS | cellular response to chemical stress | 102/3467 | 337/18723 | 9.73e-08 | 4.71e-06 | 102 |
| GO:00345992 | Colorectum | MSS | cellular response to oxidative stress | 88/3467 | 288/18723 | 4.58e-07 | 1.77e-05 | 88 |
| GO:00003022 | Colorectum | MSS | response to reactive oxygen species | 67/3467 | 222/18723 | 1.60e-05 | 3.60e-04 | 67 |
| Page: 1 2 3 4 |
| Pathway ID | Tissue | Disease Stage | Description | Gene Ratio | Bg Ratio | pvalue | p.adjust | qvalue | Count |
| hsa04144 | Colorectum | AD | Endocytosis | 111/2092 | 251/8465 | 5.95e-12 | 1.42e-10 | 9.08e-11 | 111 |
| hsa041441 | Colorectum | AD | Endocytosis | 111/2092 | 251/8465 | 5.95e-12 | 1.42e-10 | 9.08e-11 | 111 |
| hsa041444 | Colorectum | MSS | Endocytosis | 102/1875 | 251/8465 | 1.85e-11 | 4.43e-10 | 2.71e-10 | 102 |
| hsa041445 | Colorectum | MSS | Endocytosis | 102/1875 | 251/8465 | 1.85e-11 | 4.43e-10 | 2.71e-10 | 102 |
| hsa041446 | Colorectum | FAP | Endocytosis | 78/1404 | 251/8465 | 6.20e-09 | 2.96e-07 | 1.80e-07 | 78 |
| hsa041447 | Colorectum | FAP | Endocytosis | 78/1404 | 251/8465 | 6.20e-09 | 2.96e-07 | 1.80e-07 | 78 |
| hsa04144210 | Esophagus | ESCC | Endocytosis | 186/4205 | 251/8465 | 9.74e-16 | 4.66e-14 | 2.39e-14 | 186 |
| hsa0414437 | Esophagus | ESCC | Endocytosis | 186/4205 | 251/8465 | 9.74e-16 | 4.66e-14 | 2.39e-14 | 186 |
| hsa0414422 | Liver | HCC | Endocytosis | 178/4020 | 251/8465 | 2.03e-14 | 5.22e-13 | 2.91e-13 | 178 |
| hsa0414432 | Liver | HCC | Endocytosis | 178/4020 | 251/8465 | 2.03e-14 | 5.22e-13 | 2.91e-13 | 178 |
| hsa0414427 | Oral cavity | OSCC | Endocytosis | 174/3704 | 251/8465 | 9.42e-17 | 4.51e-15 | 2.29e-15 | 174 |
| hsa04144112 | Oral cavity | OSCC | Endocytosis | 174/3704 | 251/8465 | 9.42e-17 | 4.51e-15 | 2.29e-15 | 174 |
| Page: 1 |
Top |
Cell-cell communication analysis |
| Identification of potential cell-cell interactions between two cell types and their ligand-receptor pairs for different disease states |
| Ligand | Receptor | LRpair | Pathway | Tissue | Disease Stage |
| Page: 1 |
Top |
Single-cell gene regulatory network inference analysis |
| Find out the significant the regulons (TFs) and the target genes of each regulon across cell types for different disease states |
| TF | Cell Type | Tissue | Disease Stage | Target Gene | RSS | Regulon Activity |
| ∗The dot plots of a searched regulon are shown for all cell subpopulations in each disease state of each tissue based on the regulon specific score inferred using pySCENIC and by calculating the average expression. |
| Page: 1 |
Top |
Somatic mutation of malignant transformation related genes |
| Annotation of somatic variants for genes involved in malignant transformation |
| Hugo Symbol | Variant Class | Variant Classification | dbSNP RS | HGVSc | HGVSp | HGVSp Short | SWISSPROT | BIOTYPE | SIFT | PolyPhen | Tumor Sample Barcode | Tissue | Histology | Sex | Age | Stage | Therapy Types | Drugs | Outcome |
| AGAP3 | SNV | Missense_Mutation | novel | c.2249N>T | p.Ser750Phe | p.S750F | Q96P47 | protein_coding | tolerated(0.05) | benign(0.251) | TCGA-AC-A5XS-01 | Breast | breast invasive carcinoma | Female | >=65 | I/II | Hormone Therapy | femara | SD |
| AGAP3 | SNV | Missense_Mutation | c.2641G>A | p.Gly881Arg | p.G881R | Q96P47 | protein_coding | tolerated(0.23) | benign(0.164) | TCGA-BH-A208-01 | Breast | breast invasive carcinoma | Female | <65 | I/II | Unknown | Unknown | SD | |
| AGAP3 | SNV | Missense_Mutation | c.335N>T | p.Ser112Leu | p.S112L | Q96P47 | protein_coding | deleterious(0) | benign(0.241) | TCGA-E2-A10C-01 | Breast | breast invasive carcinoma | Female | <65 | I/II | Chemotherapy | cytoxan | SD | |
| AGAP3 | SNV | Missense_Mutation | novel | c.519N>G | p.Ser173Arg | p.S173R | Q96P47 | protein_coding | deleterious(0) | probably_damaging(0.997) | TCGA-GM-A2DO-01 | Breast | breast invasive carcinoma | Female | <65 | I/II | Hormone Therapy | tamoxiphen | CR |
| AGAP3 | insertion | Nonsense_Mutation | novel | c.1941_1942insGCGCTCTAATTGACAGTAATTAGGCAGCTCCCTGATTGTTTCTAATT | p.Arg648AlafsTer3 | p.R648Afs*3 | Q96P47 | protein_coding | TCGA-A2-A0D1-01 | Breast | breast invasive carcinoma | Female | >=65 | I/II | Chemotherapy | taxotere | SD | ||
| AGAP3 | insertion | Frame_Shift_Ins | novel | c.755_756insGAAGGACACAGGGCCGAAAC | p.Leu254AspfsTer12 | p.L254Dfs*12 | Q96P47 | protein_coding | TCGA-A2-A0EY-01 | Breast | breast invasive carcinoma | Female | <65 | I/II | Chemotherapy | adriamycin | SD | ||
| AGAP3 | SNV | Missense_Mutation | novel | c.721G>A | p.Ala241Thr | p.A241T | Q96P47 | protein_coding | tolerated(0.92) | benign(0.007) | TCGA-2W-A8YY-01 | Cervix | cervical & endocervical cancer | Female | <65 | I/II | Chemotherapy | cisplatin | CR |
| AGAP3 | SNV | Missense_Mutation | novel | c.299A>C | p.Asn100Thr | p.N100T | Q96P47 | protein_coding | tolerated(0.21) | possibly_damaging(0.685) | TCGA-DS-A1OB-01 | Cervix | cervical & endocervical cancer | Female | <65 | I/II | Chemotherapy | carboplatin | PD |
| AGAP3 | SNV | Missense_Mutation | novel | c.463N>C | p.Glu155Gln | p.E155Q | Q96P47 | protein_coding | tolerated(0.08) | probably_damaging(0.993) | TCGA-EA-A3HU-01 | Cervix | cervical & endocervical cancer | Female | <65 | I/II | Unknown | Unknown | SD |
| AGAP3 | SNV | Missense_Mutation | c.613N>A | p.Glu205Lys | p.E205K | Q96P47 | protein_coding | deleterious(0) | possibly_damaging(0.617) | TCGA-IR-A3LH-01 | Cervix | cervical & endocervical cancer | Female | <65 | I/II | Chemotherapy | cisplatin | CR |
| Page: 1 2 3 4 5 6 7 8 9 |
Top |
Related drugs of malignant transformation related genes |
| Identification of chemicals and drugs interact with genes involved in malignant transfromation |
| (DGIdb 4.0) |
| Entrez ID | Symbol | Category | Interaction Types | Drug Claim Name | Drug Name | PMIDs |
| Page: 1 |

Copyright 2023-Present -The University of Texas Health Science Center at Houston |