
|
|||||
|
 | |
| |
| |
| |
| |
| |
|
Gene: TMEM250 |
Gene summary for TMEM250 |
| Gene information | Species | Human | Gene symbol | TMEM250 | Gene ID | 90120 |
| Gene name | transmembrane protein 250 | |
| Gene Alias | C9orf69 | |
| Cytomap | 9q34.3 | |
| Gene Type | protein-coding | GO ID | GO:0000910 | UniProtAcc | H0YL14 |
Top |
Malignant transformation analysis |
| Identification of the aberrant gene expression in precancerous and cancerous lesions by comparing the gene expression of stem-like cells in diseased tissues with normal stem cells |
| Entrez ID | Symbol | Replicates | Species | Organ | Tissue | Adj P-value | Log2FC | Malignancy |
| 90120 | TMEM250 | HTA11_2487_2000001011 | Human | Colorectum | SER | 1.52e-02 | 2.51e-01 | -0.1808 |
| 90120 | TMEM250 | HTA11_347_2000001011 | Human | Colorectum | AD | 1.50e-05 | 1.86e-01 | -0.1954 |
| 90120 | TMEM250 | HTA11_696_2000001011 | Human | Colorectum | AD | 2.43e-09 | 2.43e-01 | -0.1464 |
| 90120 | TMEM250 | HTA11_866_2000001011 | Human | Colorectum | AD | 9.59e-07 | 1.80e-01 | -0.1001 |
| 90120 | TMEM250 | HTA11_1391_2000001011 | Human | Colorectum | AD | 1.02e-07 | 2.51e-01 | -0.059 |
| 90120 | TMEM250 | HTA11_5212_2000001011 | Human | Colorectum | AD | 4.62e-03 | 2.81e-01 | -0.2061 |
| 90120 | TMEM250 | HTA11_6801_2000001011 | Human | Colorectum | SER | 6.42e-05 | 5.32e-01 | 0.0171 |
| 90120 | TMEM250 | HTA11_10711_2000001011 | Human | Colorectum | AD | 1.41e-02 | 1.62e-01 | 0.0338 |
| 90120 | TMEM250 | HTA11_7696_3000711011 | Human | Colorectum | AD | 5.89e-12 | 2.55e-01 | 0.0674 |
| 90120 | TMEM250 | HTA11_7469_2000001011 | Human | Colorectum | AD | 3.04e-02 | 4.52e-01 | -0.0124 |
| 90120 | TMEM250 | S014 | Human | Liver | HCC | 3.33e-15 | 3.89e-01 | 0.2254 |
| 90120 | TMEM250 | S015 | Human | Liver | HCC | 1.12e-16 | 5.14e-01 | 0.2375 |
| 90120 | TMEM250 | S016 | Human | Liver | HCC | 1.64e-18 | 4.18e-01 | 0.2243 |
| 90120 | TMEM250 | S027 | Human | Liver | HCC | 2.39e-12 | 4.95e-01 | 0.2446 |
| 90120 | TMEM250 | S028 | Human | Liver | HCC | 2.23e-23 | 5.80e-01 | 0.2503 |
| 90120 | TMEM250 | S029 | Human | Liver | HCC | 3.10e-20 | 5.73e-01 | 0.2581 |
| Page: 1 |
| Tissue | Expression Dynamics | Abbreviation |
| Colorectum (GSE201348) |  | FAP: Familial adenomatous polyposis |
| CRC: Colorectal cancer | ||
| Colorectum (HTA11) |  | AD: Adenomas |
| SER: Sessile serrated lesions | ||
| MSI-H: Microsatellite-high colorectal cancer | ||
| MSS: Microsatellite stable colorectal cancer | ||
| Liver | 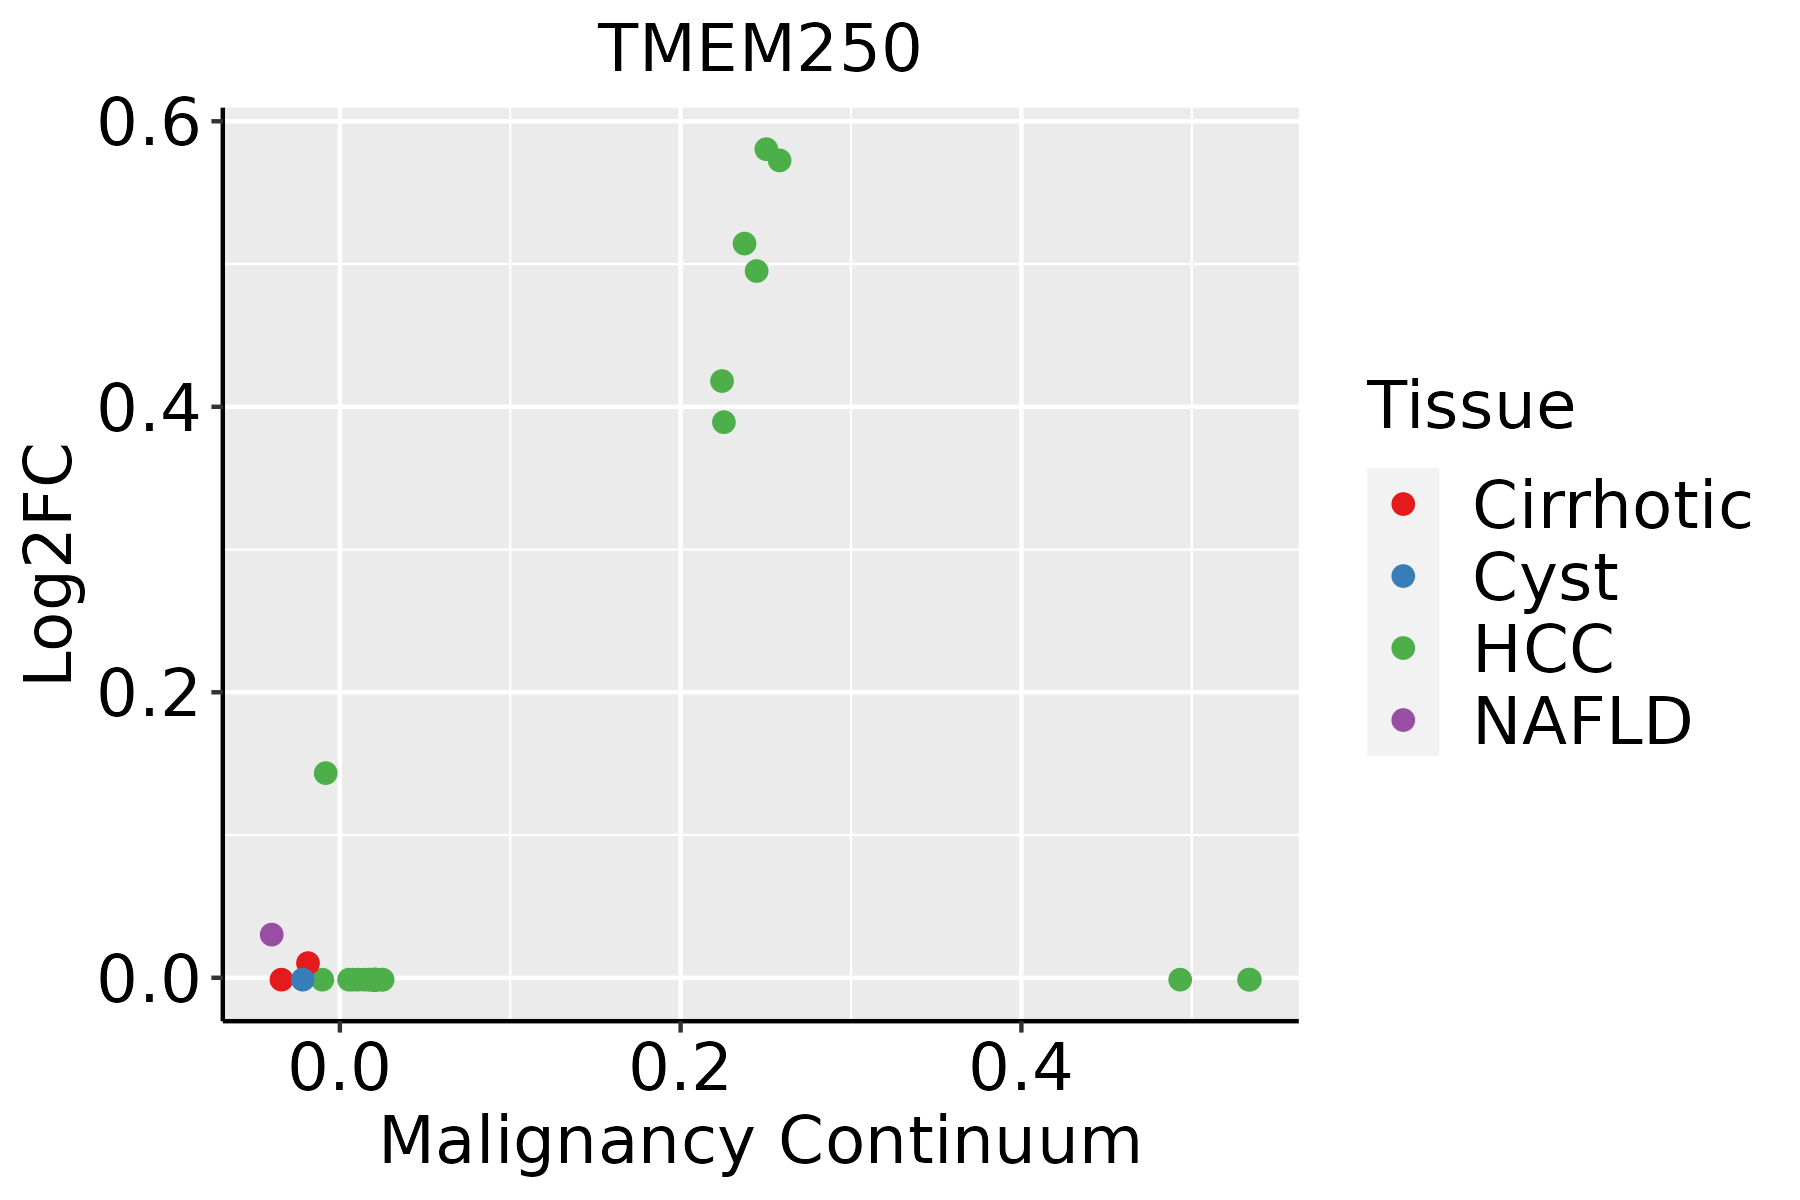 | HCC: Hepatocellular carcinoma |
| NAFLD: Non-alcoholic fatty liver disease |
| ∗log2FC in expression of this searched gene in stem-like cells from each diseased tissue sample relative to stem-like cells in normal samples in each tissue plotted against the malignancy continuum. Samples are colored based on if they are from different disease stage. |
Top |
Malignant transformation related pathway analysis |
| Find out the enriched GO biological processes and KEGG pathways involved in transition from healthy to precancer to cancer |
| Tissue | Disease Stage | Enriched GO biological Processes |
| Esophagus | ESCC |  |
| Skin | AK |  |
| Skin | SCCIS |  |
| Skin | cSCC |  |
| Thyroid | HT |  |
| ∗Top 15 enriched GO BP terms are showed in the bar plot of each disease state in each tissue. Each row represents a significant GO biological process which is colored according to the -log10(p.adjust). |
| Page: 1 2 3 4 5 6 7 8 9 |
| GO ID | Tissue | Disease Stage | Description | Gene Ratio | Bg Ratio | pvalue | p.adjust | Count |
| GO:0016032 | Colorectum | AD | viral process | 168/3918 | 415/18723 | 4.67e-20 | 3.66e-17 | 168 |
| GO:0048524 | Colorectum | AD | positive regulation of viral process | 31/3918 | 65/18723 | 1.33e-06 | 4.23e-05 | 31 |
| GO:0050792 | Colorectum | AD | regulation of viral process | 59/3918 | 164/18723 | 5.95e-06 | 1.52e-04 | 59 |
| GO:0000910 | Colorectum | AD | cytokinesis | 59/3918 | 173/18723 | 3.74e-05 | 6.75e-04 | 59 |
| GO:0061640 | Colorectum | AD | cytoskeleton-dependent cytokinesis | 37/3918 | 100/18723 | 1.58e-04 | 2.20e-03 | 37 |
| GO:00160321 | Colorectum | SER | viral process | 118/2897 | 415/18723 | 8.36e-12 | 1.65e-09 | 118 |
| GO:00009101 | Colorectum | SER | cytokinesis | 45/2897 | 173/18723 | 2.28e-04 | 3.93e-03 | 45 |
| GO:00507921 | Colorectum | SER | regulation of viral process | 43/2897 | 164/18723 | 2.57e-04 | 4.31e-03 | 43 |
| GO:00616401 | Colorectum | SER | cytoskeleton-dependent cytokinesis | 29/2897 | 100/18723 | 4.25e-04 | 6.25e-03 | 29 |
| GO:00485241 | Colorectum | SER | positive regulation of viral process | 21/2897 | 65/18723 | 5.39e-04 | 7.57e-03 | 21 |
| GO:001603222 | Liver | HCC | viral process | 286/7958 | 415/18723 | 4.41e-28 | 1.86e-25 | 286 |
| GO:005079212 | Liver | HCC | regulation of viral process | 109/7958 | 164/18723 | 4.52e-10 | 1.45e-08 | 109 |
| GO:004852411 | Liver | HCC | positive regulation of viral process | 52/7958 | 65/18723 | 6.70e-10 | 2.11e-08 | 52 |
| GO:000091011 | Liver | HCC | cytokinesis | 100/7958 | 173/18723 | 3.38e-05 | 3.39e-04 | 100 |
| GO:006164011 | Liver | HCC | cytoskeleton-dependent cytokinesis | 60/7958 | 100/18723 | 3.09e-04 | 2.20e-03 | 60 |
| Page: 1 |
| Pathway ID | Tissue | Disease Stage | Description | Gene Ratio | Bg Ratio | pvalue | p.adjust | qvalue | Count |
| Page: 1 |
Top |
Cell-cell communication analysis |
| Identification of potential cell-cell interactions between two cell types and their ligand-receptor pairs for different disease states |
| Ligand | Receptor | LRpair | Pathway | Tissue | Disease Stage |
| Page: 1 |
Top |
Single-cell gene regulatory network inference analysis |
| Find out the significant the regulons (TFs) and the target genes of each regulon across cell types for different disease states |
| TF | Cell Type | Tissue | Disease Stage | Target Gene | RSS | Regulon Activity |
| ∗The dot plots of a searched regulon are shown for all cell subpopulations in each disease state of each tissue based on the regulon specific score inferred using pySCENIC and by calculating the average expression. |
| Page: 1 |
Top |
Somatic mutation of malignant transformation related genes |
| Annotation of somatic variants for genes involved in malignant transformation |
| Hugo Symbol | Variant Class | Variant Classification | dbSNP RS | HGVSc | HGVSp | HGVSp Short | SWISSPROT | BIOTYPE | SIFT | PolyPhen | Tumor Sample Barcode | Tissue | Histology | Sex | Age | Stage | Therapy Types | Drugs | Outcome |
| Page: 1 |
Top |
Related drugs of malignant transformation related genes |
| Identification of chemicals and drugs interact with genes involved in malignant transfromation |
| (DGIdb 4.0) |
| Entrez ID | Symbol | Category | Interaction Types | Drug Claim Name | Drug Name | PMIDs |
| Page: 1 |

Copyright 2023-Present -The University of Texas Health Science Center at Houston |