
|
|||||
|
 | |
| |
| |
| |
| |
| |
|
Gene: TMEM100 |
Gene summary for TMEM100 |
| Gene information | Species | Human | Gene symbol | TMEM100 | Gene ID | 55273 |
| Gene name | transmembrane protein 100 | |
| Gene Alias | TMEM100 | |
| Cytomap | 17q22 | |
| Gene Type | protein-coding | GO ID | GO:0001525 | UniProtAcc | Q9NV29 |
Top |
Malignant transformation analysis |
| Identification of the aberrant gene expression in precancerous and cancerous lesions by comparing the gene expression of stem-like cells in diseased tissues with normal stem cells |
| Entrez ID | Symbol | Replicates | Species | Organ | Tissue | Adj P-value | Log2FC | Malignancy |
| 55273 | TMEM100 | male-WTA | Human | Thyroid | PTC | 4.82e-02 | 6.71e-02 | 0.1037 |
| 55273 | TMEM100 | female-WTA | Human | Thyroid | PTC | 4.92e-03 | 2.57e-01 | 0.0726 |
| 55273 | TMEM100 | PTC01 | Human | Thyroid | PTC | 5.96e-08 | 2.75e-01 | 0.1899 |
| 55273 | TMEM100 | PTC04 | Human | Thyroid | PTC | 2.74e-06 | 3.12e-01 | 0.1927 |
| 55273 | TMEM100 | PTC06 | Human | Thyroid | PTC | 5.27e-24 | 8.78e-01 | 0.2057 |
| 55273 | TMEM100 | PTC07 | Human | Thyroid | PTC | 1.68e-15 | 3.85e-01 | 0.2044 |
| 55273 | TMEM100 | ATC13 | Human | Thyroid | ATC | 8.28e-20 | 4.83e-01 | 0.34 |
| 55273 | TMEM100 | ATC5 | Human | Thyroid | ATC | 1.21e-24 | 5.23e-01 | 0.34 |
| Page: 1 |
| Tissue | Expression Dynamics | Abbreviation |
| Thyroid | 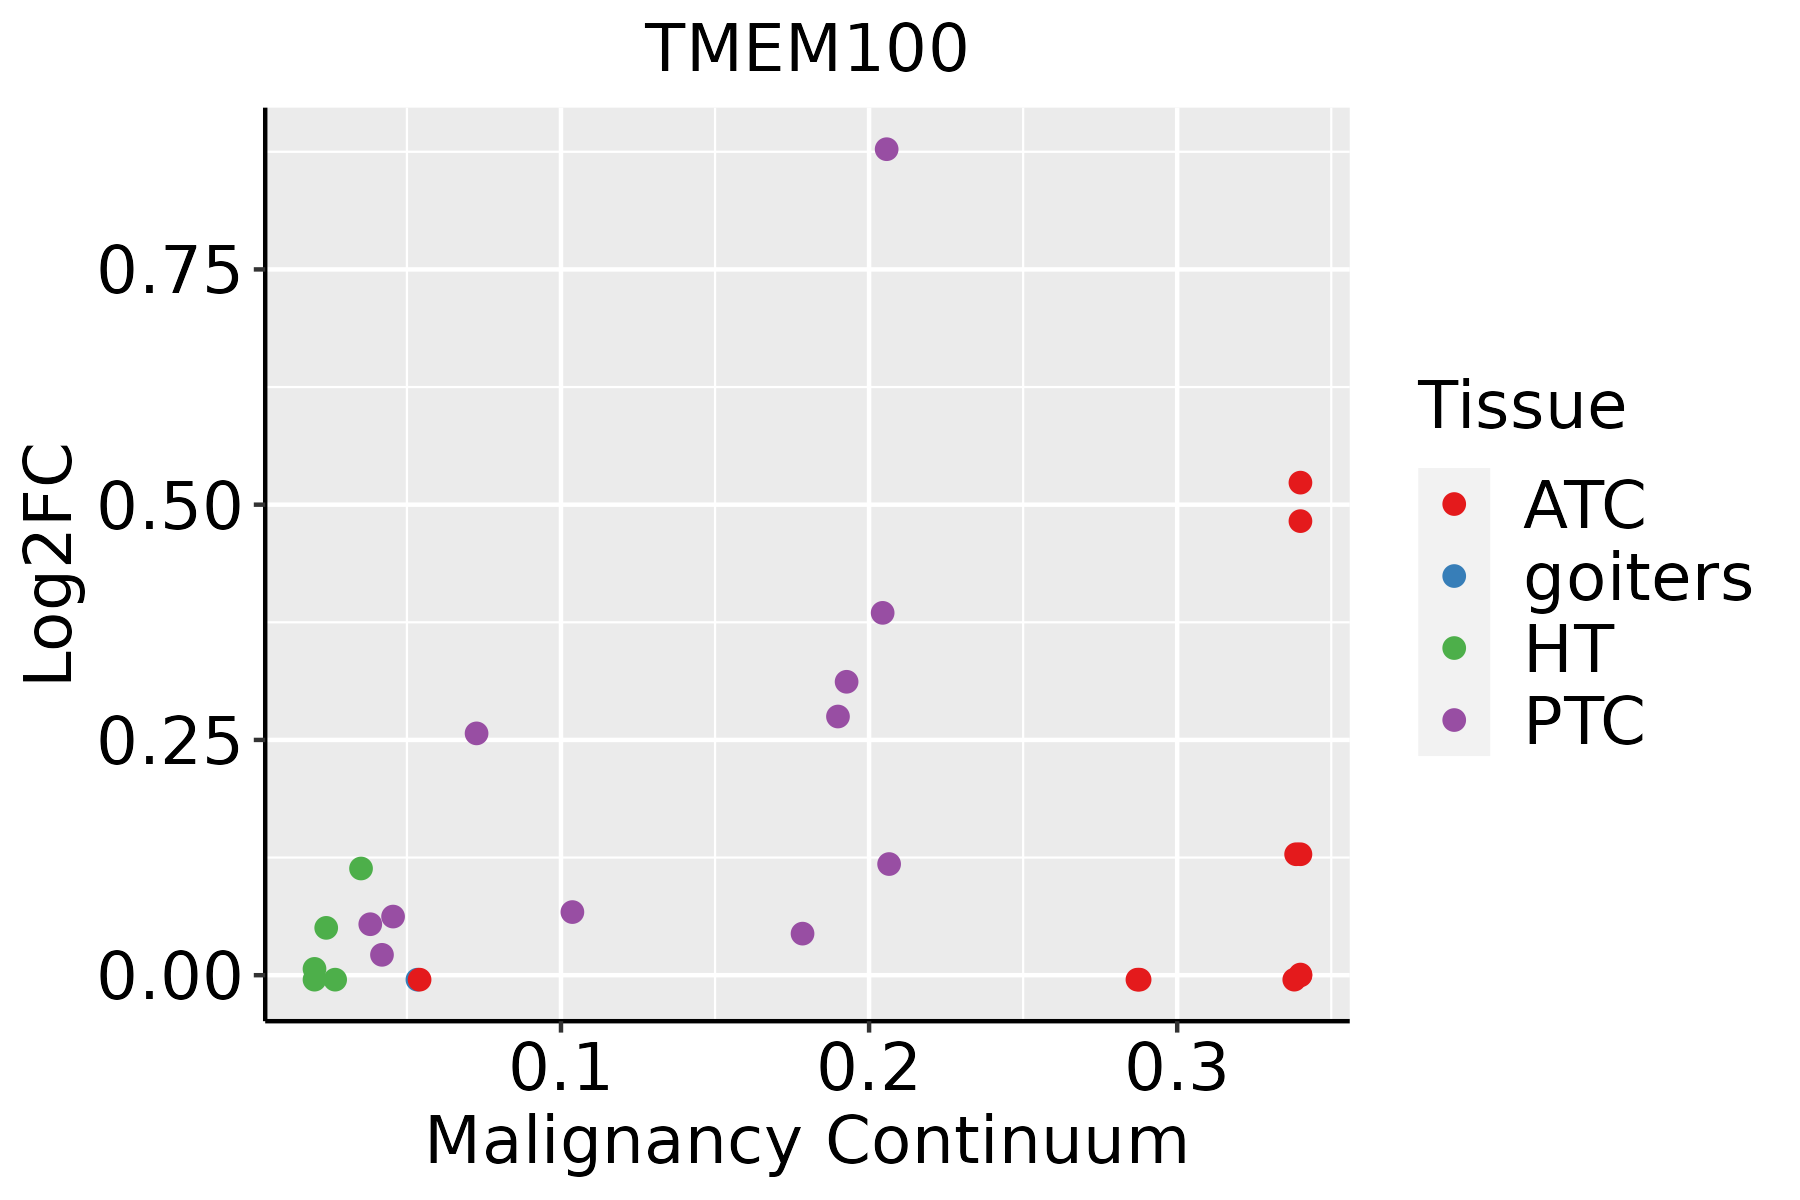 | ATC: Anaplastic thyroid cancer |
| HT: Hashimoto's thyroiditis | ||
| PTC: Papillary thyroid cancer |
| ∗log2FC in expression of this searched gene in stem-like cells from each diseased tissue sample relative to stem-like cells in normal samples in each tissue plotted against the malignancy continuum. Samples are colored based on if they are from different disease stage. |
Top |
Malignant transformation related pathway analysis |
| Find out the enriched GO biological processes and KEGG pathways involved in transition from healthy to precancer to cancer |
| Tissue | Disease Stage | Enriched GO biological Processes |
| Esophagus | ESCC |  |
| Skin | AK |  |
| Skin | SCCIS |  |
| Skin | cSCC |  |
| Thyroid | HT |  |
| ∗Top 15 enriched GO BP terms are showed in the bar plot of each disease state in each tissue. Each row represents a significant GO biological process which is colored according to the -log10(p.adjust). |
| Page: 1 2 3 4 5 6 7 8 9 |
| GO ID | Tissue | Disease Stage | Description | Gene Ratio | Bg Ratio | pvalue | p.adjust | Count |
| GO:0001701111 | Thyroid | PTC | in utero embryonic development | 175/5968 | 367/18723 | 1.40e-10 | 4.73e-09 | 175 |
| GO:000717819 | Thyroid | PTC | transmembrane receptor protein serine/threonine kinase signaling pathway | 156/5968 | 355/18723 | 1.02e-06 | 1.51e-05 | 156 |
| GO:000183715 | Thyroid | PTC | epithelial to mesenchymal transition | 76/5968 | 157/18723 | 1.10e-05 | 1.21e-04 | 76 |
| GO:0003158111 | Thyroid | PTC | endothelium development | 62/5968 | 136/18723 | 5.45e-04 | 3.48e-03 | 62 |
| GO:004544619 | Thyroid | PTC | endothelial cell differentiation | 55/5968 | 118/18723 | 5.64e-04 | 3.59e-03 | 55 |
| GO:004876215 | Thyroid | PTC | mesenchymal cell differentiation | 99/5968 | 236/18723 | 6.72e-04 | 4.22e-03 | 99 |
| GO:00434918 | Thyroid | PTC | protein kinase B signaling | 88/5968 | 211/18723 | 1.59e-03 | 8.81e-03 | 88 |
| GO:0060317 | Thyroid | PTC | cardiac epithelial to mesenchymal transition | 18/5968 | 32/18723 | 3.72e-03 | 1.79e-02 | 18 |
| GO:00072199 | Thyroid | PTC | Notch signaling pathway | 70/5968 | 172/18723 | 8.82e-03 | 3.67e-02 | 70 |
| GO:000157011 | Thyroid | PTC | vasculogenesis | 36/5968 | 80/18723 | 9.35e-03 | 3.85e-02 | 36 |
| GO:006048514 | Thyroid | PTC | mesenchyme development | 112/5968 | 291/18723 | 9.48e-03 | 3.90e-02 | 112 |
| GO:000170126 | Thyroid | ATC | in utero embryonic development | 183/6293 | 367/18723 | 6.62e-11 | 2.11e-09 | 183 |
| GO:000717823 | Thyroid | ATC | transmembrane receptor protein serine/threonine kinase signaling pathway | 170/6293 | 355/18723 | 1.40e-08 | 2.87e-07 | 170 |
| GO:000183722 | Thyroid | ATC | epithelial to mesenchymal transition | 87/6293 | 157/18723 | 1.50e-08 | 3.06e-07 | 87 |
| GO:004876221 | Thyroid | ATC | mesenchymal cell differentiation | 116/6293 | 236/18723 | 5.08e-07 | 7.30e-06 | 116 |
| GO:006048521 | Thyroid | ATC | mesenchyme development | 136/6293 | 291/18723 | 2.04e-06 | 2.43e-05 | 136 |
| GO:00603171 | Thyroid | ATC | cardiac epithelial to mesenchymal transition | 22/6293 | 32/18723 | 5.14e-05 | 3.99e-04 | 22 |
| GO:00030075 | Thyroid | ATC | heart morphogenesis | 110/6293 | 246/18723 | 1.76e-04 | 1.20e-03 | 110 |
| GO:000315825 | Thyroid | ATC | endothelium development | 66/6293 | 136/18723 | 2.16e-04 | 1.42e-03 | 66 |
| GO:0072132 | Thyroid | ATC | mesenchyme morphogenesis | 30/6293 | 52/18723 | 3.08e-04 | 1.94e-03 | 30 |
| Page: 1 2 |
| Pathway ID | Tissue | Disease Stage | Description | Gene Ratio | Bg Ratio | pvalue | p.adjust | qvalue | Count |
| Page: 1 |
Top |
Cell-cell communication analysis |
| Identification of potential cell-cell interactions between two cell types and their ligand-receptor pairs for different disease states |
| Ligand | Receptor | LRpair | Pathway | Tissue | Disease Stage |
| Page: 1 |
Top |
Single-cell gene regulatory network inference analysis |
| Find out the significant the regulons (TFs) and the target genes of each regulon across cell types for different disease states |
| TF | Cell Type | Tissue | Disease Stage | Target Gene | RSS | Regulon Activity |
| ∗The dot plots of a searched regulon are shown for all cell subpopulations in each disease state of each tissue based on the regulon specific score inferred using pySCENIC and by calculating the average expression. |
| Page: 1 |
Top |
Somatic mutation of malignant transformation related genes |
| Annotation of somatic variants for genes involved in malignant transformation |
| Hugo Symbol | Variant Class | Variant Classification | dbSNP RS | HGVSc | HGVSp | HGVSp Short | SWISSPROT | BIOTYPE | SIFT | PolyPhen | Tumor Sample Barcode | Tissue | Histology | Sex | Age | Stage | Therapy Types | Drugs | Outcome |
| TMEM100 | SNV | Missense_Mutation | c.265N>A | p.Gly89Ser | p.G89S | Q9NV29 | protein_coding | tolerated(0.2) | probably_damaging(1) | TCGA-AN-A0AK-01 | Breast | breast invasive carcinoma | Female | >=65 | I/II | Unknown | Unknown | SD | |
| TMEM100 | SNV | Missense_Mutation | c.208G>A | p.Val70Met | p.V70M | Q9NV29 | protein_coding | deleterious(0.01) | probably_damaging(0.947) | TCGA-EW-A2FV-01 | Breast | breast invasive carcinoma | Female | <65 | III/IV | Chemotherapy | docetaxel | SD | |
| TMEM100 | insertion | Frame_Shift_Ins | novel | c.296dupT | p.Leu99PhefsTer91 | p.L99Ffs*91 | Q9NV29 | protein_coding | TCGA-BH-A1FL-01 | Breast | breast invasive carcinoma | Female | >=65 | I/II | Unknown | Unknown | PD | ||
| TMEM100 | SNV | Missense_Mutation | c.84A>C | p.Glu28Asp | p.E28D | Q9NV29 | protein_coding | tolerated(0.58) | benign(0.003) | TCGA-C5-A1MH-01 | Cervix | cervical & endocervical cancer | Female | >=65 | III/IV | Chemotherapy | cisplatin | PD | |
| TMEM100 | deletion | Frame_Shift_Del | c.296delN | p.Leu99TyrfsTer2 | p.L99Yfs*2 | Q9NV29 | protein_coding | TCGA-VS-A94Z-01 | Cervix | cervical & endocervical cancer | Female | <65 | I/II | Chemotherapy | cisplatin | CR | |||
| TMEM100 | SNV | Missense_Mutation | c.245N>T | p.Gly82Val | p.G82V | Q9NV29 | protein_coding | deleterious(0.01) | probably_damaging(1) | TCGA-AA-3811-01 | Colorectum | colon adenocarcinoma | Female | >=65 | III/IV | Unknown | Unknown | PD | |
| TMEM100 | SNV | Missense_Mutation | c.284N>A | p.Ser95Tyr | p.S95Y | Q9NV29 | protein_coding | tolerated(0.68) | benign(0.107) | TCGA-AD-6895-01 | Colorectum | colon adenocarcinoma | Male | >=65 | III/IV | Unknown | Unknown | SD | |
| TMEM100 | SNV | Missense_Mutation | c.152N>A | p.Leu51His | p.L51H | Q9NV29 | protein_coding | tolerated(0.23) | probably_damaging(0.999) | TCGA-CM-5348-01 | Colorectum | colon adenocarcinoma | Male | >=65 | III/IV | Unknown | Unknown | SD | |
| TMEM100 | SNV | Missense_Mutation | novel | c.353N>T | p.Arg118Ile | p.R118I | Q9NV29 | protein_coding | deleterious(0) | probably_damaging(0.999) | TCGA-AG-A002-01 | Colorectum | rectum adenocarcinoma | Male | <65 | I/II | Unknown | Unknown | SD |
| TMEM100 | deletion | Frame_Shift_Del | c.296delN | p.Leu99TyrfsTer2 | p.L99Yfs*2 | Q9NV29 | protein_coding | TCGA-A6-5665-01 | Colorectum | colon adenocarcinoma | Female | >=65 | I/II | Unknown | Unknown | PD |
| Page: 1 2 3 4 |
Top |
Related drugs of malignant transformation related genes |
| Identification of chemicals and drugs interact with genes involved in malignant transfromation |
| (DGIdb 4.0) |
| Entrez ID | Symbol | Category | Interaction Types | Drug Claim Name | Drug Name | PMIDs |
| Page: 1 |

Copyright 2023-Present -The University of Texas Health Science Center at Houston |