
|
|||||
|
 | |
| |
| |
| |
| |
| |
|
Gene: STMP1 |
Gene summary for STMP1 |
| Gene information | Species | Human | Gene symbol | STMP1 | Gene ID | 647087 |
| Gene name | short transmembrane mitochondrial protein 1 | |
| Gene Alias | C7orf73 | |
| Cytomap | 7q33 | |
| Gene Type | protein-coding | GO ID | GO:0001816 | UniProtAcc | E0CX11 |
Top |
Malignant transformation analysis |
| Identification of the aberrant gene expression in precancerous and cancerous lesions by comparing the gene expression of stem-like cells in diseased tissues with normal stem cells |
| Entrez ID | Symbol | Replicates | Species | Organ | Tissue | Adj P-value | Log2FC | Malignancy |
| 647087 | STMP1 | GSM4909281 | Human | Breast | IDC | 1.51e-21 | 6.35e-01 | 0.21 |
| 647087 | STMP1 | GSM4909282 | Human | Breast | IDC | 2.54e-04 | 3.72e-01 | -0.0288 |
| 647087 | STMP1 | GSM4909285 | Human | Breast | IDC | 8.55e-21 | 5.77e-01 | 0.21 |
| 647087 | STMP1 | GSM4909286 | Human | Breast | IDC | 2.22e-22 | 5.14e-01 | 0.1081 |
| 647087 | STMP1 | GSM4909287 | Human | Breast | IDC | 2.36e-07 | 2.96e-01 | 0.2057 |
| 647087 | STMP1 | GSM4909290 | Human | Breast | IDC | 6.49e-06 | 3.00e-01 | 0.2096 |
| 647087 | STMP1 | GSM4909293 | Human | Breast | IDC | 8.89e-17 | 5.17e-01 | 0.1581 |
| 647087 | STMP1 | GSM4909294 | Human | Breast | IDC | 6.86e-03 | 3.39e-01 | 0.2022 |
| 647087 | STMP1 | GSM4909295 | Human | Breast | IDC | 3.02e-11 | 5.04e-01 | 0.0898 |
| 647087 | STMP1 | GSM4909296 | Human | Breast | IDC | 3.02e-02 | 1.65e-01 | 0.1524 |
| 647087 | STMP1 | GSM4909297 | Human | Breast | IDC | 8.84e-04 | 8.77e-03 | 0.1517 |
| 647087 | STMP1 | GSM4909298 | Human | Breast | IDC | 2.19e-12 | 4.44e-01 | 0.1551 |
| 647087 | STMP1 | GSM4909300 | Human | Breast | IDC | 1.59e-02 | 2.83e-01 | 0.0334 |
| 647087 | STMP1 | GSM4909305 | Human | Breast | IDC | 7.35e-10 | 3.39e-01 | 0.0436 |
| 647087 | STMP1 | GSM4909306 | Human | Breast | IDC | 2.13e-05 | 3.85e-01 | 0.1564 |
| 647087 | STMP1 | GSM4909308 | Human | Breast | IDC | 1.62e-21 | 4.85e-01 | 0.158 |
| 647087 | STMP1 | GSM4909311 | Human | Breast | IDC | 2.49e-14 | -1.04e-01 | 0.1534 |
| 647087 | STMP1 | GSM4909312 | Human | Breast | IDC | 9.16e-03 | 1.20e-01 | 0.1552 |
| 647087 | STMP1 | GSM4909315 | Human | Breast | IDC | 3.30e-33 | 8.81e-01 | 0.21 |
| 647087 | STMP1 | GSM4909316 | Human | Breast | IDC | 1.31e-15 | 7.61e-01 | 0.21 |
| Page: 1 2 3 4 5 6 7 |
| Tissue | Expression Dynamics | Abbreviation |
| Breast | 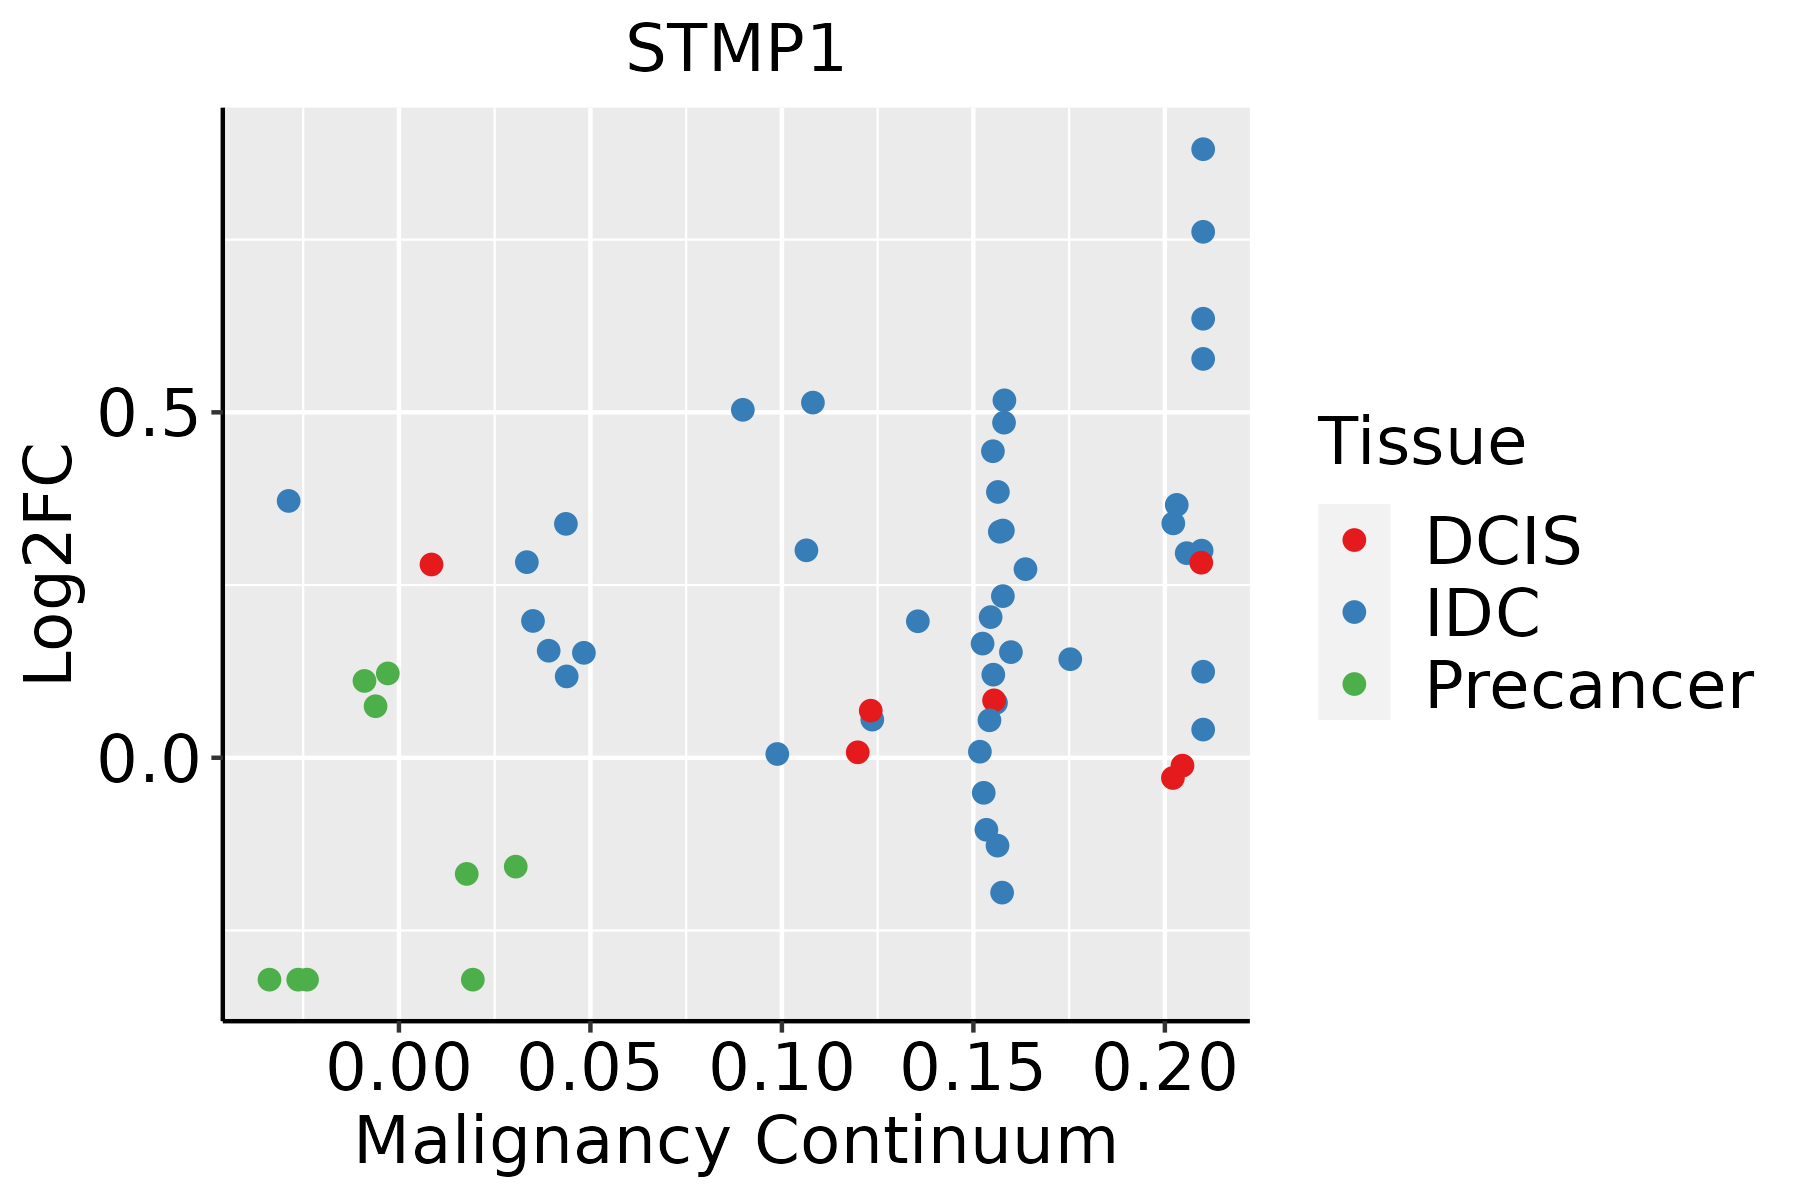 | IDC: Invasive ductal carcinoma |
| DCIS: Ductal carcinoma in situ | ||
| Precancer(BRCA1-mut): Precancerous lesion from BRCA1 mutation carriers | ||
| Colorectum (GSE201348) |  | FAP: Familial adenomatous polyposis |
| CRC: Colorectal cancer | ||
| Colorectum (HTA11) | 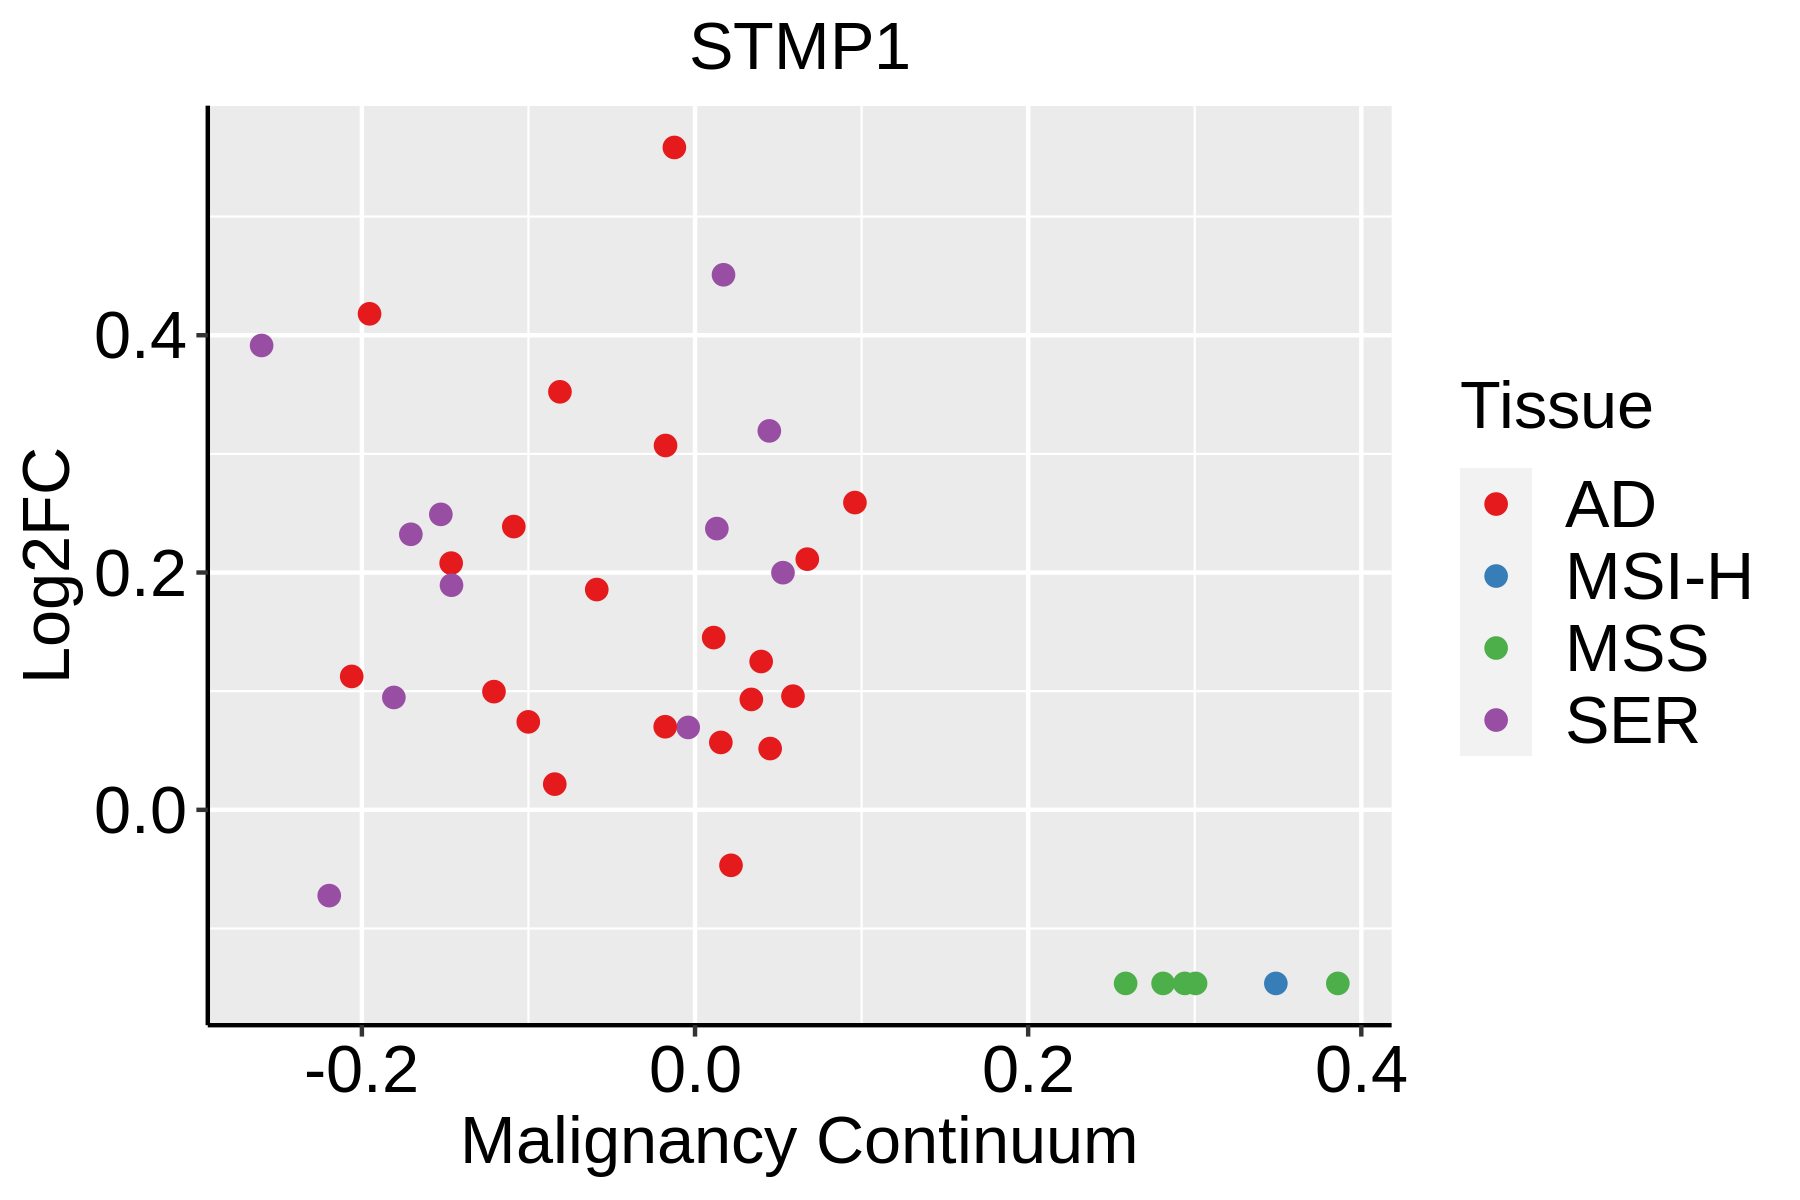 | AD: Adenomas |
| SER: Sessile serrated lesions | ||
| MSI-H: Microsatellite-high colorectal cancer | ||
| MSS: Microsatellite stable colorectal cancer | ||
| Endometrium | 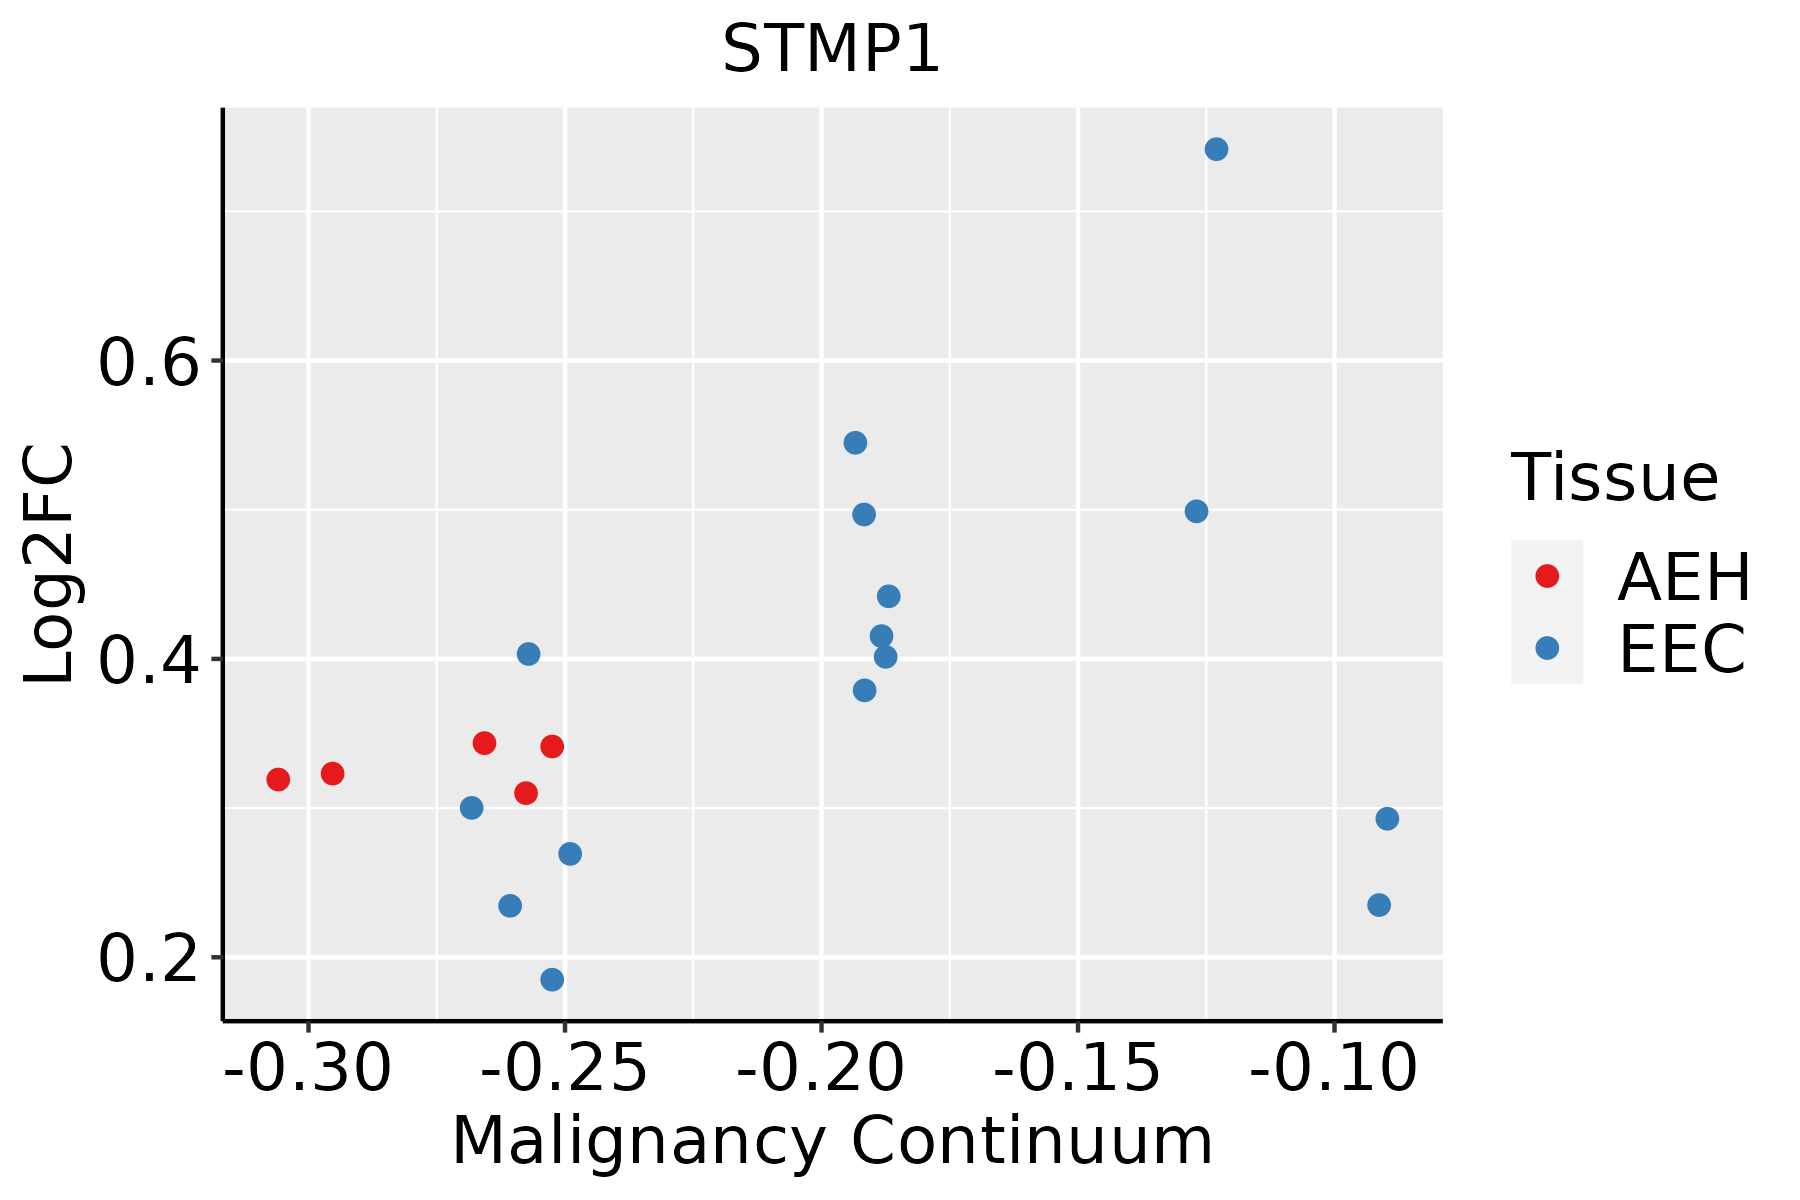 | AEH: Atypical endometrial hyperplasia |
| EEC: Endometrioid Cancer | ||
| Esophagus | 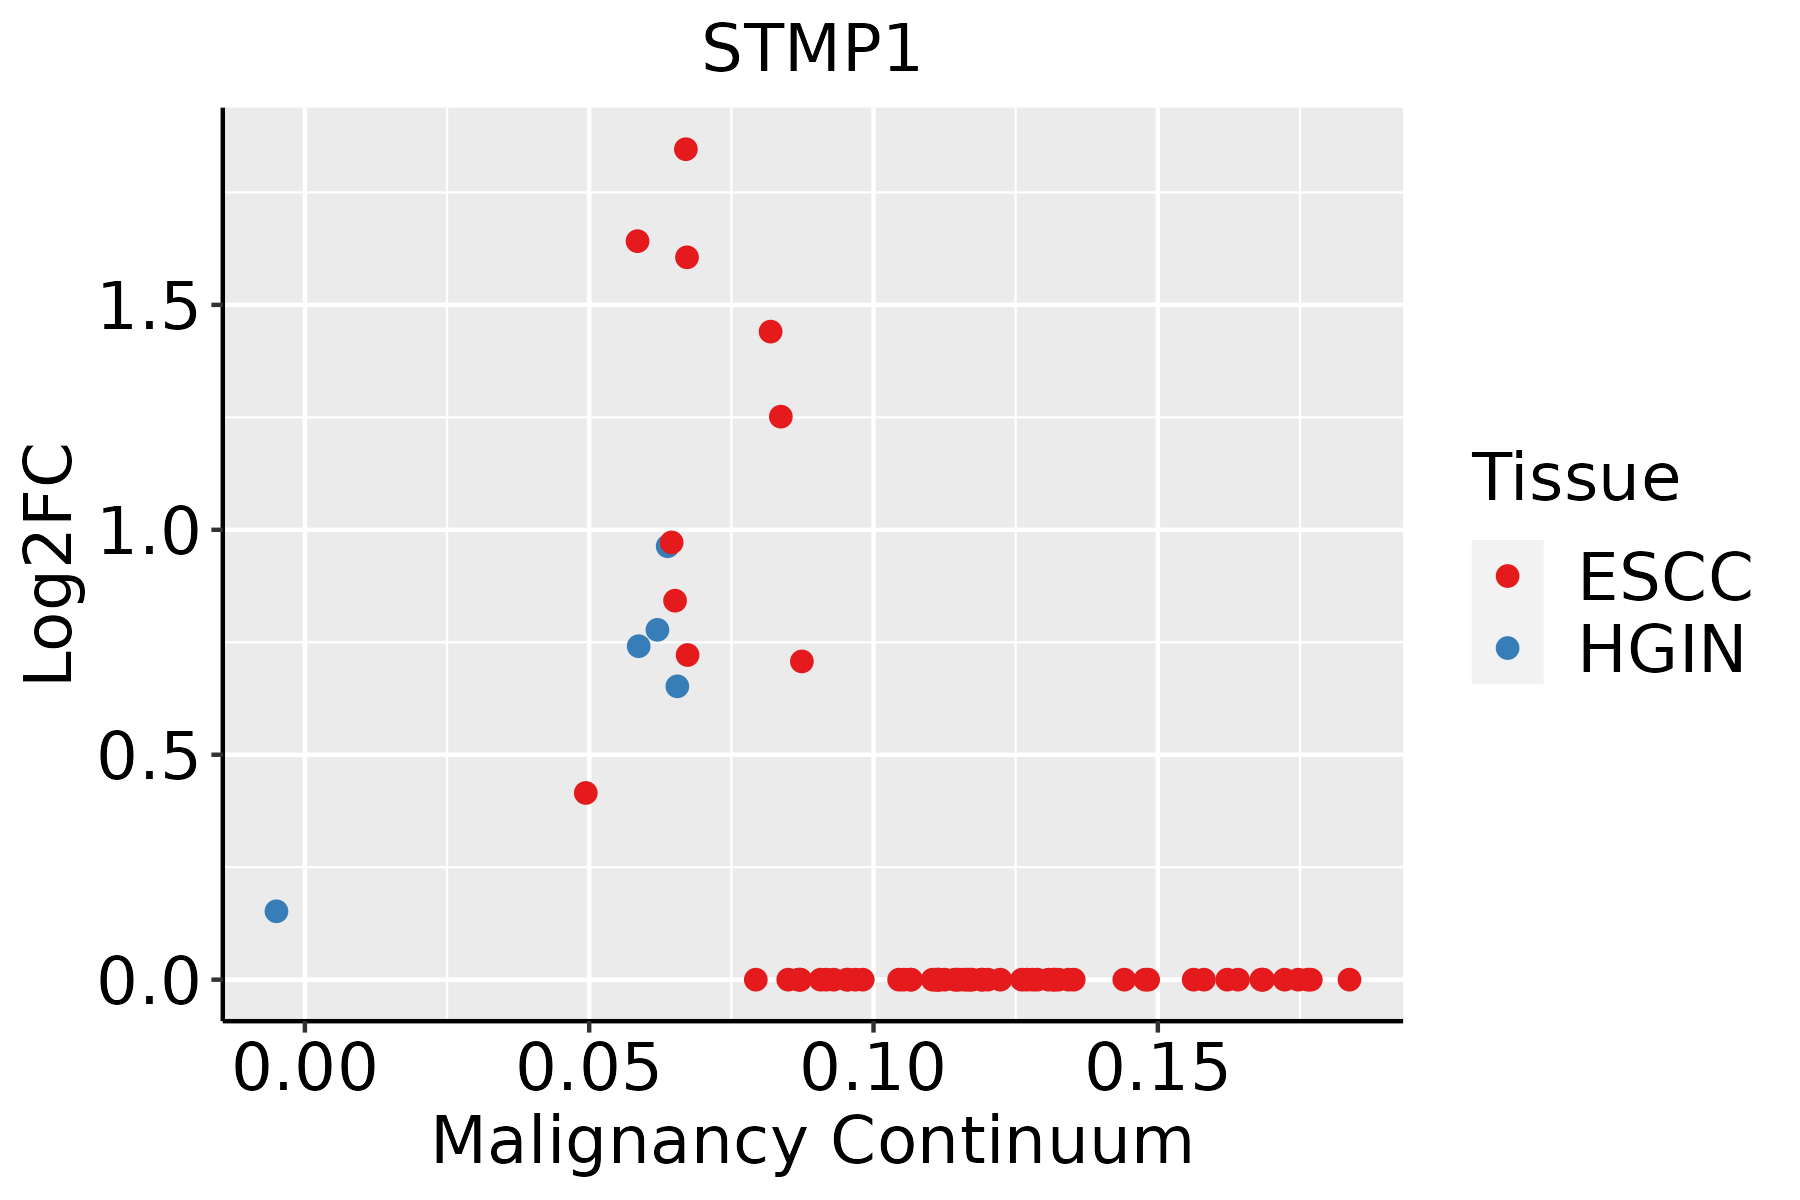 | ESCC: Esophageal squamous cell carcinoma |
| HGIN: High-grade intraepithelial neoplasias | ||
| LGIN: Low-grade intraepithelial neoplasias | ||
| GC | 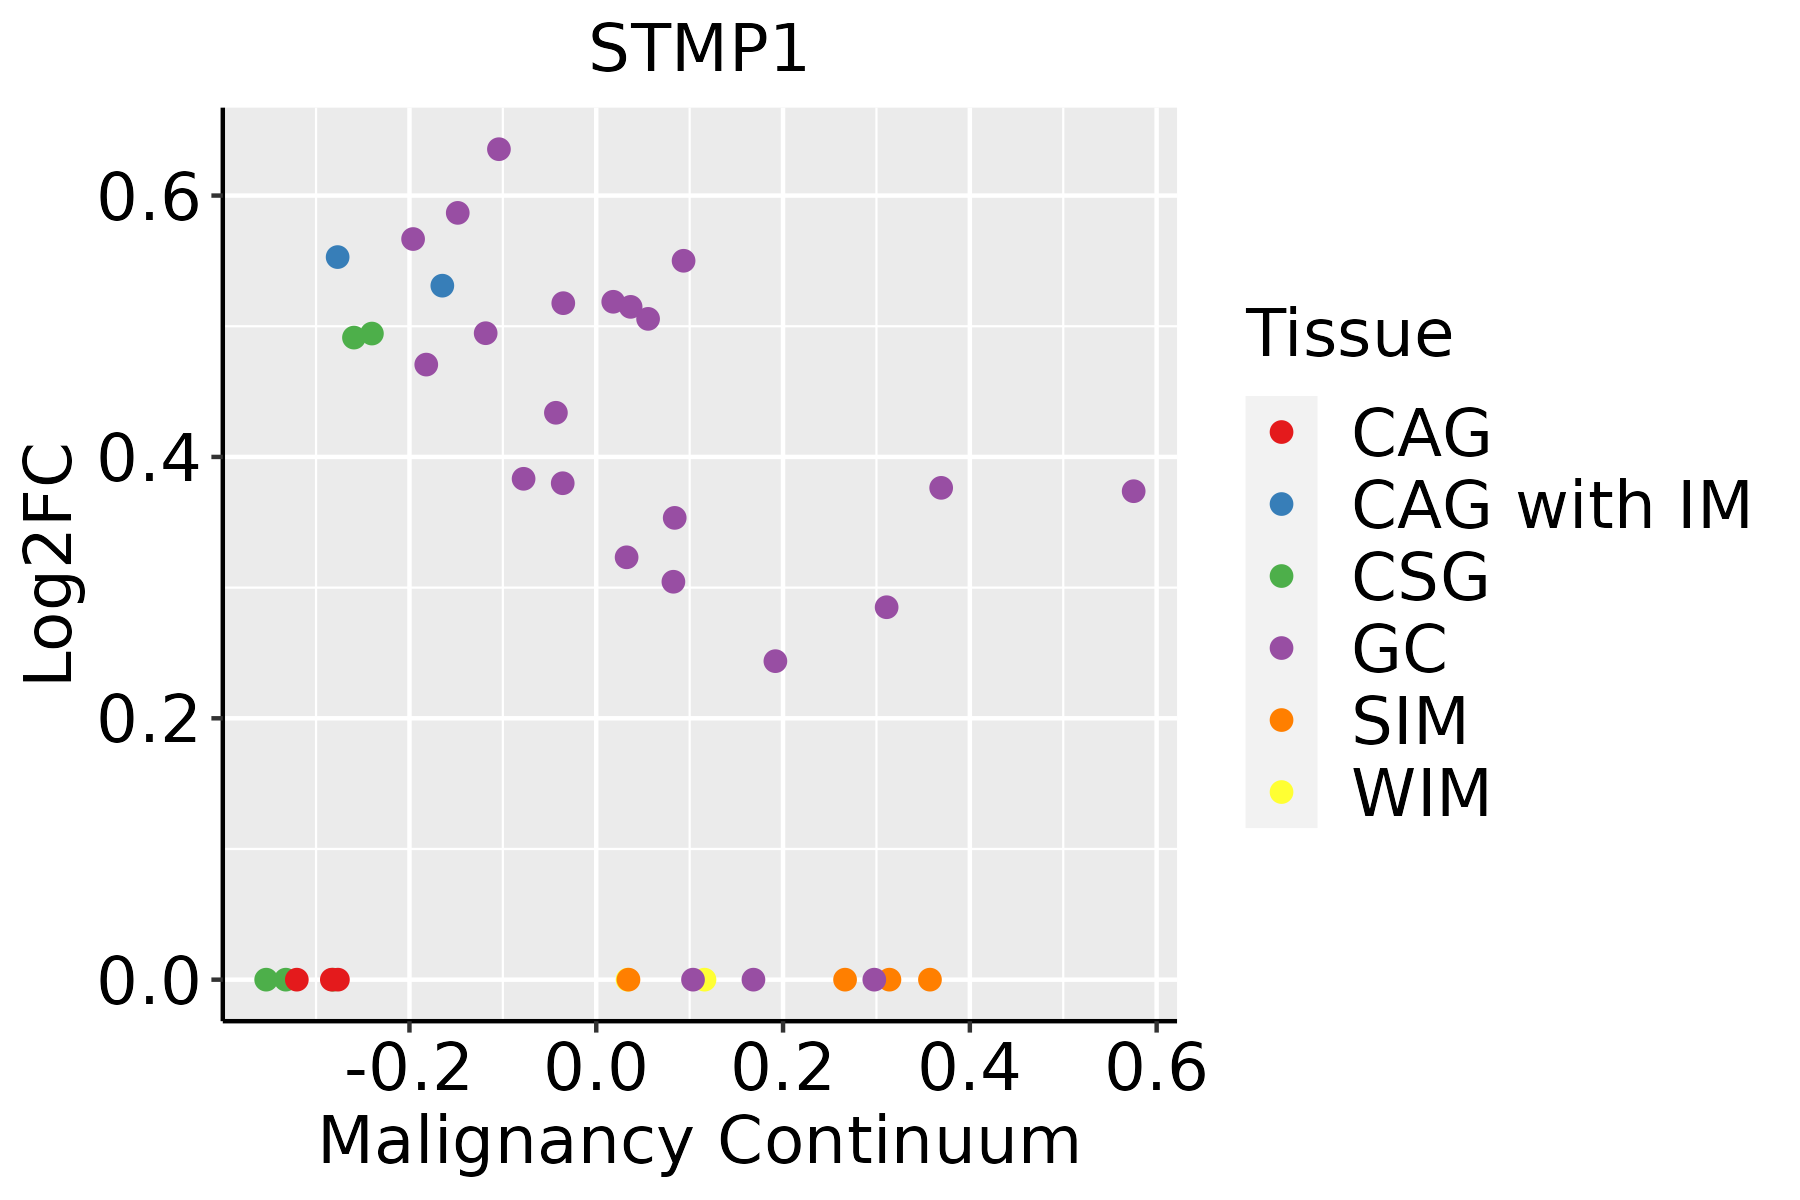 | CAG: Chronic atrophic gastritis |
| CAG with IM: Chronic atrophic gastritis with intestinal metaplasia | ||
| CSG: Chronic superficial gastritis | ||
| GC: Gastric cancer | ||
| SIM: Severe intestinal metaplasia | ||
| WIM: Wild intestinal metaplasia | ||
| Liver |  | HCC: Hepatocellular carcinoma |
| NAFLD: Non-alcoholic fatty liver disease | ||
| Thyroid | 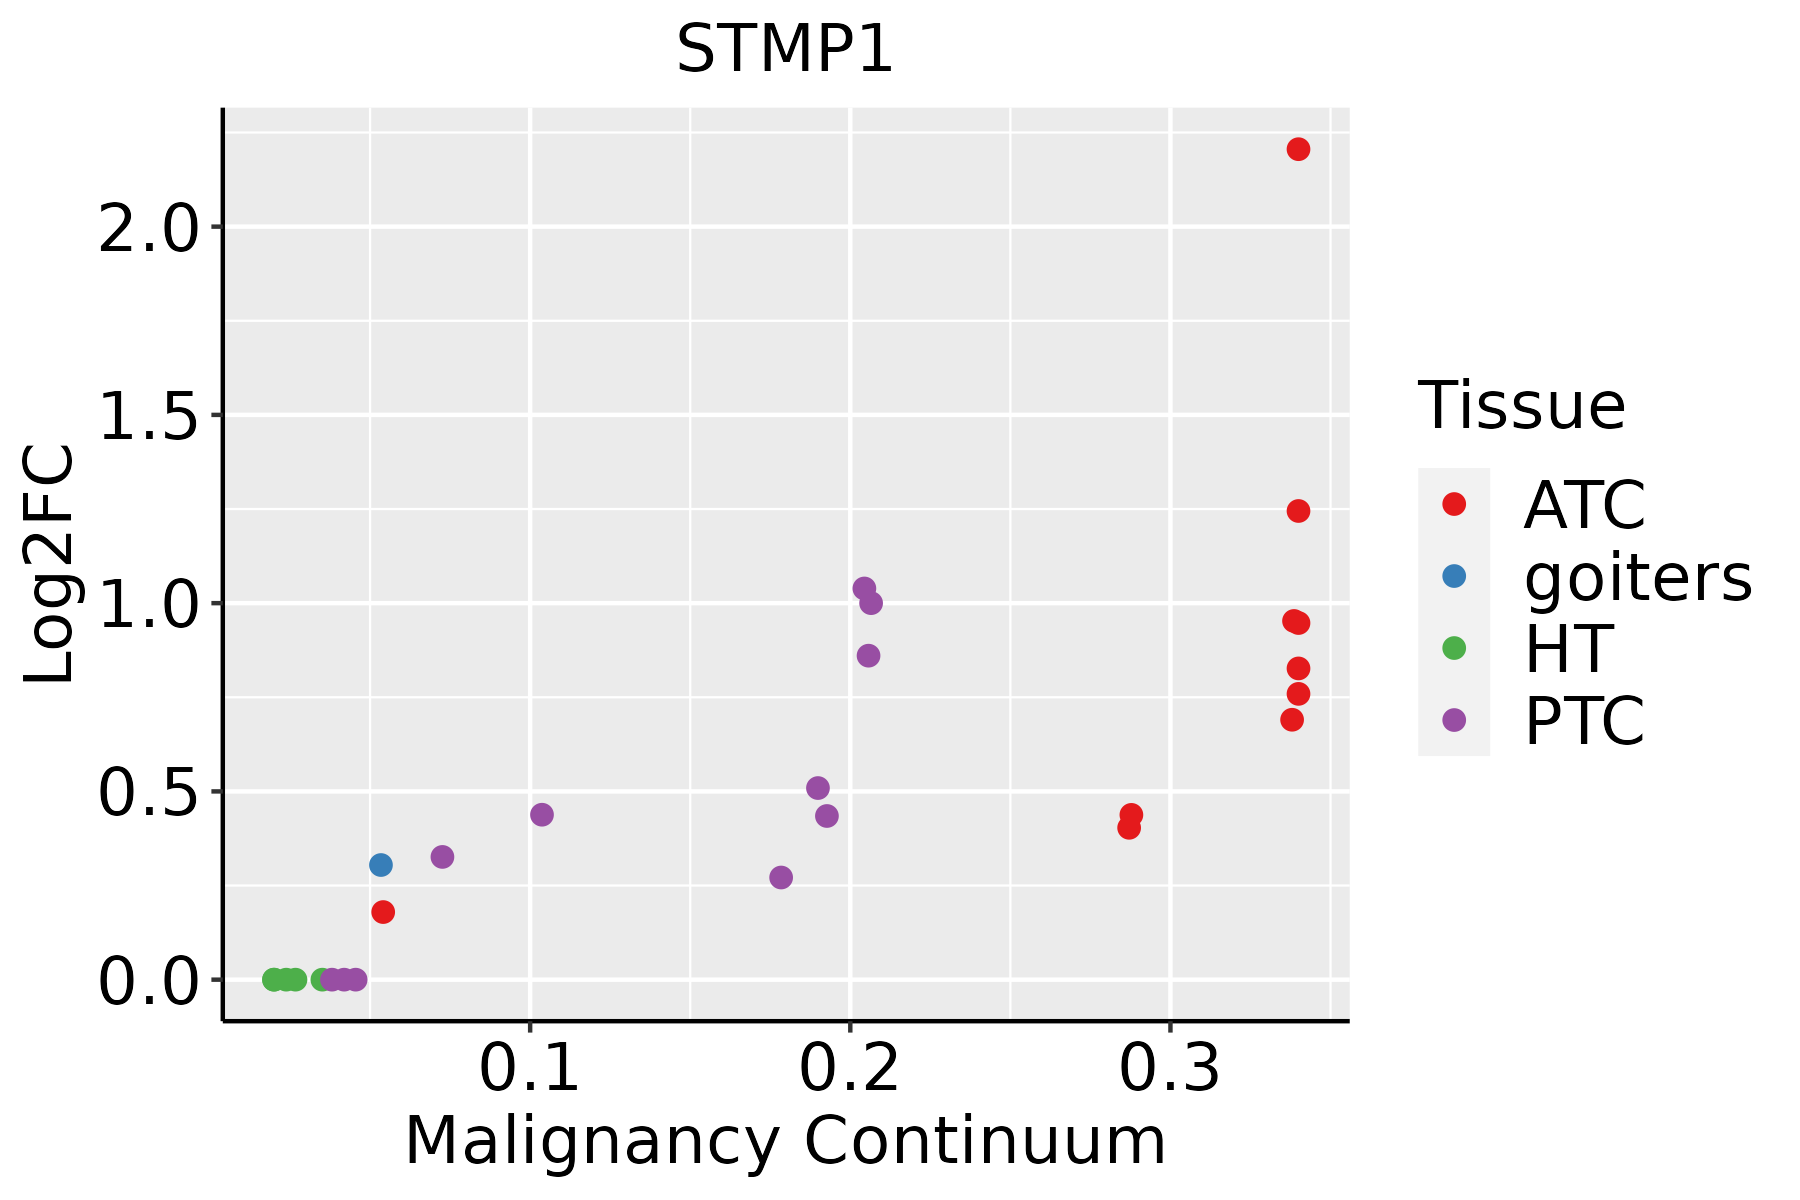 | ATC: Anaplastic thyroid cancer |
| HT: Hashimoto's thyroiditis | ||
| PTC: Papillary thyroid cancer |
| ∗log2FC in expression of this searched gene in stem-like cells from each diseased tissue sample relative to stem-like cells in normal samples in each tissue plotted against the malignancy continuum. Samples are colored based on if they are from different disease stage. |
Top |
Malignant transformation related pathway analysis |
| Find out the enriched GO biological processes and KEGG pathways involved in transition from healthy to precancer to cancer |
| Tissue | Disease Stage | Enriched GO biological Processes |
| Esophagus | ESCC |  |
| Skin | AK |  |
| Skin | SCCIS |  |
| Skin | cSCC |  |
| Thyroid | HT |  |
| ∗Top 15 enriched GO BP terms are showed in the bar plot of each disease state in each tissue. Each row represents a significant GO biological process which is colored according to the -log10(p.adjust). |
| Page: 1 2 3 4 5 6 7 8 9 |
| GO ID | Tissue | Disease Stage | Description | Gene Ratio | Bg Ratio | pvalue | p.adjust | Count |
| GO:00432549 | Breast | Precancer | regulation of protein-containing complex assembly | 50/1080 | 428/18723 | 1.63e-06 | 5.97e-05 | 50 |
| GO:00313349 | Breast | Precancer | positive regulation of protein-containing complex assembly | 33/1080 | 237/18723 | 2.39e-06 | 8.21e-05 | 33 |
| GO:00018196 | Breast | Precancer | positive regulation of cytokine production | 52/1080 | 467/18723 | 4.18e-06 | 1.29e-04 | 52 |
| GO:0032732 | Breast | Precancer | positive regulation of interleukin-1 production | 11/1080 | 73/18723 | 2.96e-03 | 2.55e-02 | 11 |
| GO:004325414 | Breast | IDC | regulation of protein-containing complex assembly | 61/1434 | 428/18723 | 1.77e-06 | 7.31e-05 | 61 |
| GO:003133414 | Breast | IDC | positive regulation of protein-containing complex assembly | 40/1434 | 237/18723 | 1.77e-06 | 7.31e-05 | 40 |
| GO:000181911 | Breast | IDC | positive regulation of cytokine production | 61/1434 | 467/18723 | 2.81e-05 | 6.58e-04 | 61 |
| GO:004325424 | Breast | DCIS | regulation of protein-containing complex assembly | 61/1390 | 428/18723 | 6.32e-07 | 2.71e-05 | 61 |
| GO:003133423 | Breast | DCIS | positive regulation of protein-containing complex assembly | 40/1390 | 237/18723 | 8.13e-07 | 3.36e-05 | 40 |
| GO:000181921 | Breast | DCIS | positive regulation of cytokine production | 63/1390 | 467/18723 | 2.76e-06 | 9.42e-05 | 63 |
| GO:00327321 | Breast | DCIS | positive regulation of interleukin-1 production | 13/1390 | 73/18723 | 2.57e-03 | 2.30e-02 | 13 |
| GO:0043254 | Colorectum | AD | regulation of protein-containing complex assembly | 148/3918 | 428/18723 | 2.64e-11 | 3.18e-09 | 148 |
| GO:0031334 | Colorectum | AD | positive regulation of protein-containing complex assembly | 91/3918 | 237/18723 | 4.78e-10 | 3.99e-08 | 91 |
| GO:00432542 | Colorectum | MSS | regulation of protein-containing complex assembly | 130/3467 | 428/18723 | 1.38e-09 | 1.03e-07 | 130 |
| GO:00313342 | Colorectum | MSS | positive regulation of protein-containing complex assembly | 82/3467 | 237/18723 | 2.49e-09 | 1.75e-07 | 82 |
| GO:004325416 | Endometrium | AEH | regulation of protein-containing complex assembly | 83/2100 | 428/18723 | 3.90e-07 | 1.63e-05 | 83 |
| GO:003133416 | Endometrium | AEH | positive regulation of protein-containing complex assembly | 52/2100 | 237/18723 | 1.43e-06 | 4.60e-05 | 52 |
| GO:00018198 | Endometrium | AEH | positive regulation of cytokine production | 71/2100 | 467/18723 | 4.76e-03 | 3.02e-02 | 71 |
| GO:004325417 | Endometrium | EEC | regulation of protein-containing complex assembly | 83/2168 | 428/18723 | 1.44e-06 | 4.64e-05 | 83 |
| GO:003133417 | Endometrium | EEC | positive regulation of protein-containing complex assembly | 52/2168 | 237/18723 | 3.68e-06 | 9.90e-05 | 52 |
| Page: 1 2 3 |
| Pathway ID | Tissue | Disease Stage | Description | Gene Ratio | Bg Ratio | pvalue | p.adjust | qvalue | Count |
| Page: 1 |
Top |
Cell-cell communication analysis |
| Identification of potential cell-cell interactions between two cell types and their ligand-receptor pairs for different disease states |
| Ligand | Receptor | LRpair | Pathway | Tissue | Disease Stage |
| Page: 1 |
Top |
Single-cell gene regulatory network inference analysis |
| Find out the significant the regulons (TFs) and the target genes of each regulon across cell types for different disease states |
| TF | Cell Type | Tissue | Disease Stage | Target Gene | RSS | Regulon Activity |
| ∗The dot plots of a searched regulon are shown for all cell subpopulations in each disease state of each tissue based on the regulon specific score inferred using pySCENIC and by calculating the average expression. |
| Page: 1 |
Top |
Somatic mutation of malignant transformation related genes |
| Annotation of somatic variants for genes involved in malignant transformation |
| Hugo Symbol | Variant Class | Variant Classification | dbSNP RS | HGVSc | HGVSp | HGVSp Short | SWISSPROT | BIOTYPE | SIFT | PolyPhen | Tumor Sample Barcode | Tissue | Histology | Sex | Age | Stage | Therapy Types | Drugs | Outcome |
| Page: 1 |
Top |
Related drugs of malignant transformation related genes |
| Identification of chemicals and drugs interact with genes involved in malignant transfromation |
| (DGIdb 4.0) |
| Entrez ID | Symbol | Category | Interaction Types | Drug Claim Name | Drug Name | PMIDs |
| Page: 1 |

Copyright 2023-Present -The University of Texas Health Science Center at Houston |