
|
|||||
|
 | |
| |
| |
| |
| |
| |
|
Gene: SLC39A1 |
Gene summary for SLC39A1 |
| Gene information | Species | Human | Gene symbol | SLC39A1 | Gene ID | 27173 |
| Gene name | solute carrier family 39 member 1 | |
| Gene Alias | ZIP1 | |
| Cytomap | 1q21.3 | |
| Gene Type | protein-coding | GO ID | GO:0000041 | UniProtAcc | Q9NY26 |
Top |
Malignant transformation analysis |
| Identification of the aberrant gene expression in precancerous and cancerous lesions by comparing the gene expression of stem-like cells in diseased tissues with normal stem cells |
| Entrez ID | Symbol | Replicates | Species | Organ | Tissue | Adj P-value | Log2FC | Malignancy |
| 27173 | SLC39A1 | HTA11_3410_2000001011 | Human | Colorectum | AD | 7.54e-08 | 1.38e-01 | 0.0155 |
| 27173 | SLC39A1 | HTA11_2487_2000001011 | Human | Colorectum | SER | 2.44e-06 | 2.85e-01 | -0.1808 |
| 27173 | SLC39A1 | HTA11_1938_2000001011 | Human | Colorectum | AD | 2.00e-15 | 4.68e-01 | -0.0811 |
| 27173 | SLC39A1 | HTA11_78_2000001011 | Human | Colorectum | AD | 2.12e-10 | 2.74e-01 | -0.1088 |
| 27173 | SLC39A1 | HTA11_347_2000001011 | Human | Colorectum | AD | 7.50e-15 | 3.45e-01 | -0.1954 |
| 27173 | SLC39A1 | HTA11_411_2000001011 | Human | Colorectum | SER | 1.15e-05 | 7.43e-01 | -0.2602 |
| 27173 | SLC39A1 | HTA11_2112_2000001011 | Human | Colorectum | SER | 1.31e-02 | 3.36e-01 | -0.2196 |
| 27173 | SLC39A1 | HTA11_3361_2000001011 | Human | Colorectum | AD | 1.54e-04 | 2.58e-01 | -0.1207 |
| 27173 | SLC39A1 | HTA11_83_2000001011 | Human | Colorectum | SER | 8.20e-04 | 1.87e-01 | -0.1526 |
| 27173 | SLC39A1 | HTA11_696_2000001011 | Human | Colorectum | AD | 6.61e-16 | 3.47e-01 | -0.1464 |
| 27173 | SLC39A1 | HTA11_866_2000001011 | Human | Colorectum | AD | 1.96e-05 | 2.28e-01 | -0.1001 |
| 27173 | SLC39A1 | HTA11_1391_2000001011 | Human | Colorectum | AD | 7.79e-19 | 5.23e-01 | -0.059 |
| 27173 | SLC39A1 | HTA11_2992_2000001011 | Human | Colorectum | SER | 1.19e-06 | 5.15e-01 | -0.1706 |
| 27173 | SLC39A1 | HTA11_5212_2000001011 | Human | Colorectum | AD | 2.76e-04 | 2.70e-01 | -0.2061 |
| 27173 | SLC39A1 | HTA11_866_3004761011 | Human | Colorectum | AD | 5.67e-22 | 4.74e-01 | 0.096 |
| 27173 | SLC39A1 | HTA11_4255_2000001011 | Human | Colorectum | SER | 1.61e-05 | 3.58e-01 | 0.0446 |
| 27173 | SLC39A1 | HTA11_8622_2000001021 | Human | Colorectum | SER | 1.17e-04 | 2.36e-01 | 0.0528 |
| 27173 | SLC39A1 | HTA11_7663_2000001011 | Human | Colorectum | SER | 9.84e-03 | 3.04e-01 | 0.0131 |
| 27173 | SLC39A1 | HTA11_10623_2000001011 | Human | Colorectum | AD | 3.76e-06 | 2.87e-01 | -0.0177 |
| 27173 | SLC39A1 | HTA11_10711_2000001011 | Human | Colorectum | AD | 8.32e-06 | 2.36e-01 | 0.0338 |
| Page: 1 2 3 4 5 6 7 8 |
| Tissue | Expression Dynamics | Abbreviation |
| Colorectum (GSE201348) |  | FAP: Familial adenomatous polyposis |
| CRC: Colorectal cancer | ||
| Colorectum (HTA11) |  | AD: Adenomas |
| SER: Sessile serrated lesions | ||
| MSI-H: Microsatellite-high colorectal cancer | ||
| MSS: Microsatellite stable colorectal cancer | ||
| Esophagus | 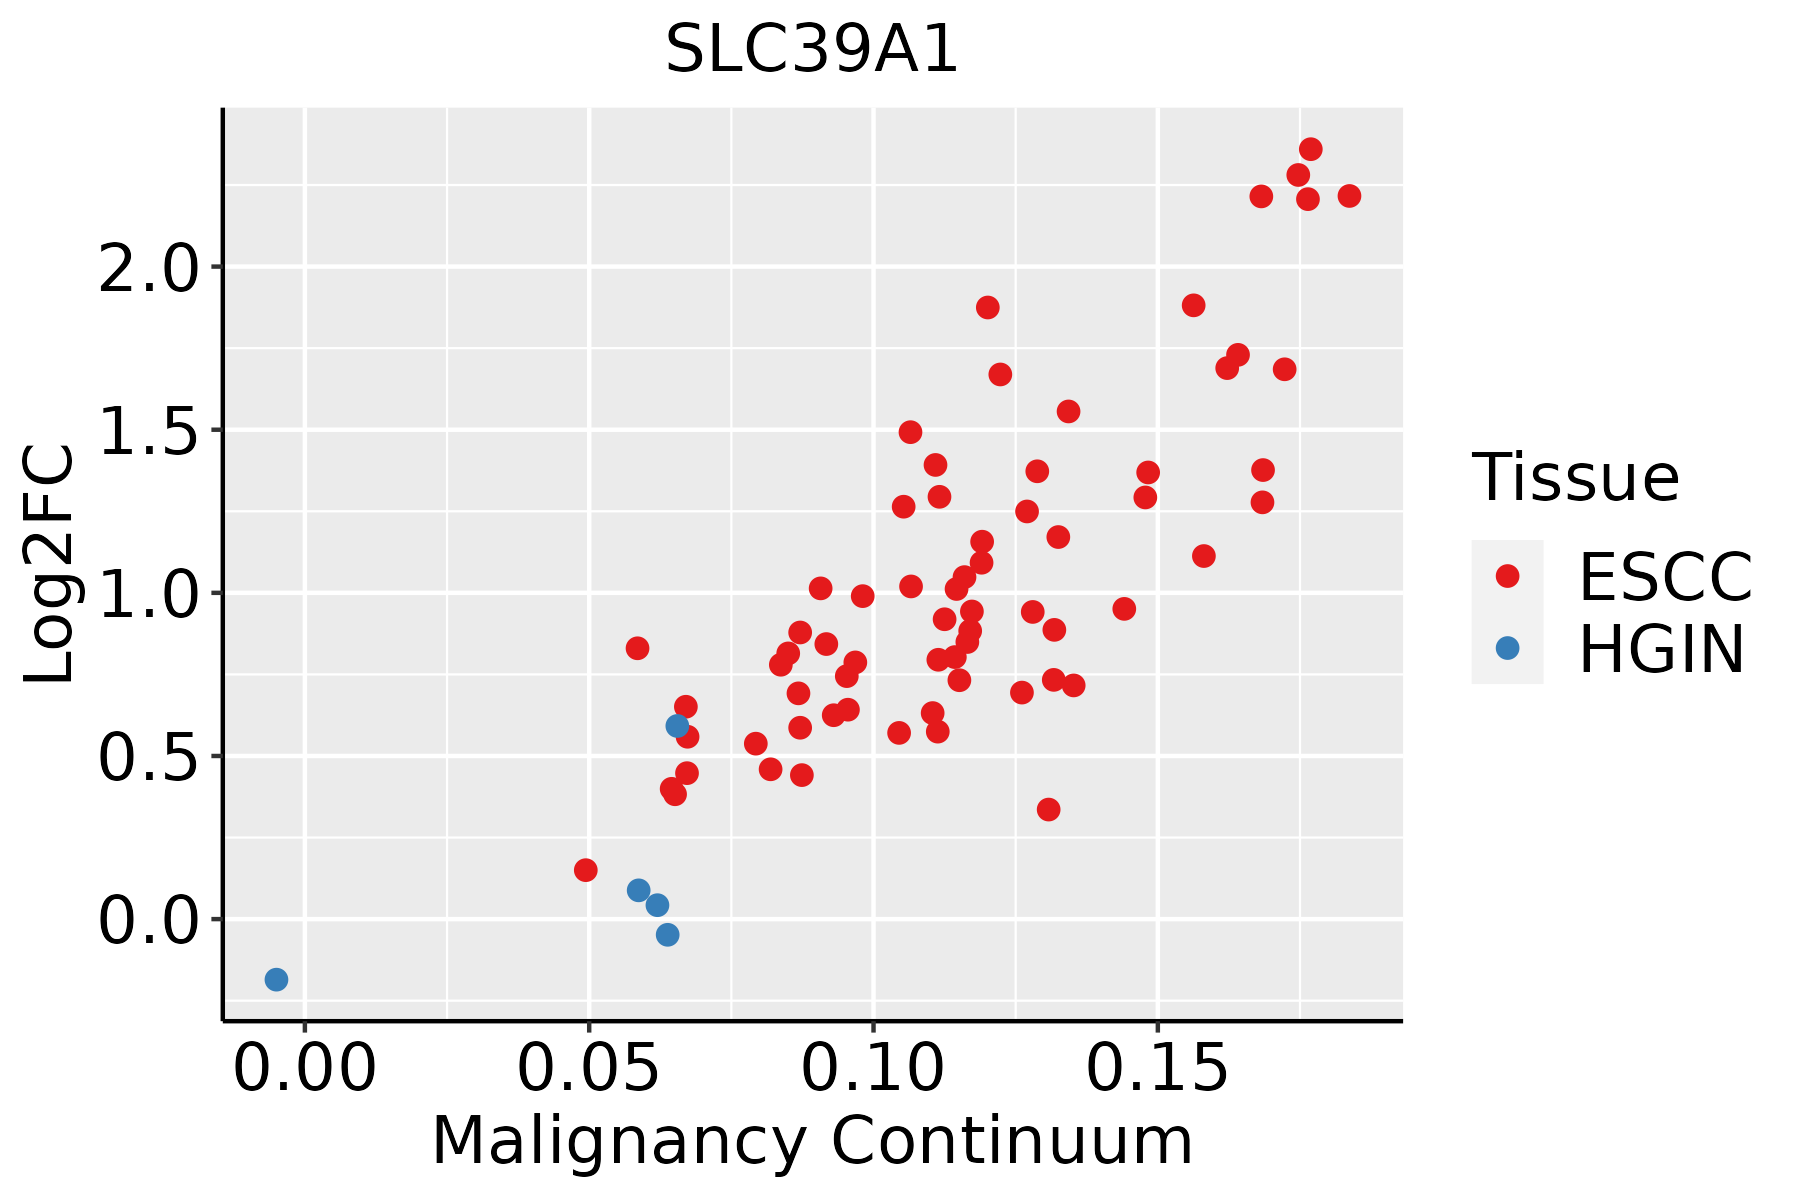 | ESCC: Esophageal squamous cell carcinoma |
| HGIN: High-grade intraepithelial neoplasias | ||
| LGIN: Low-grade intraepithelial neoplasias | ||
| Liver | 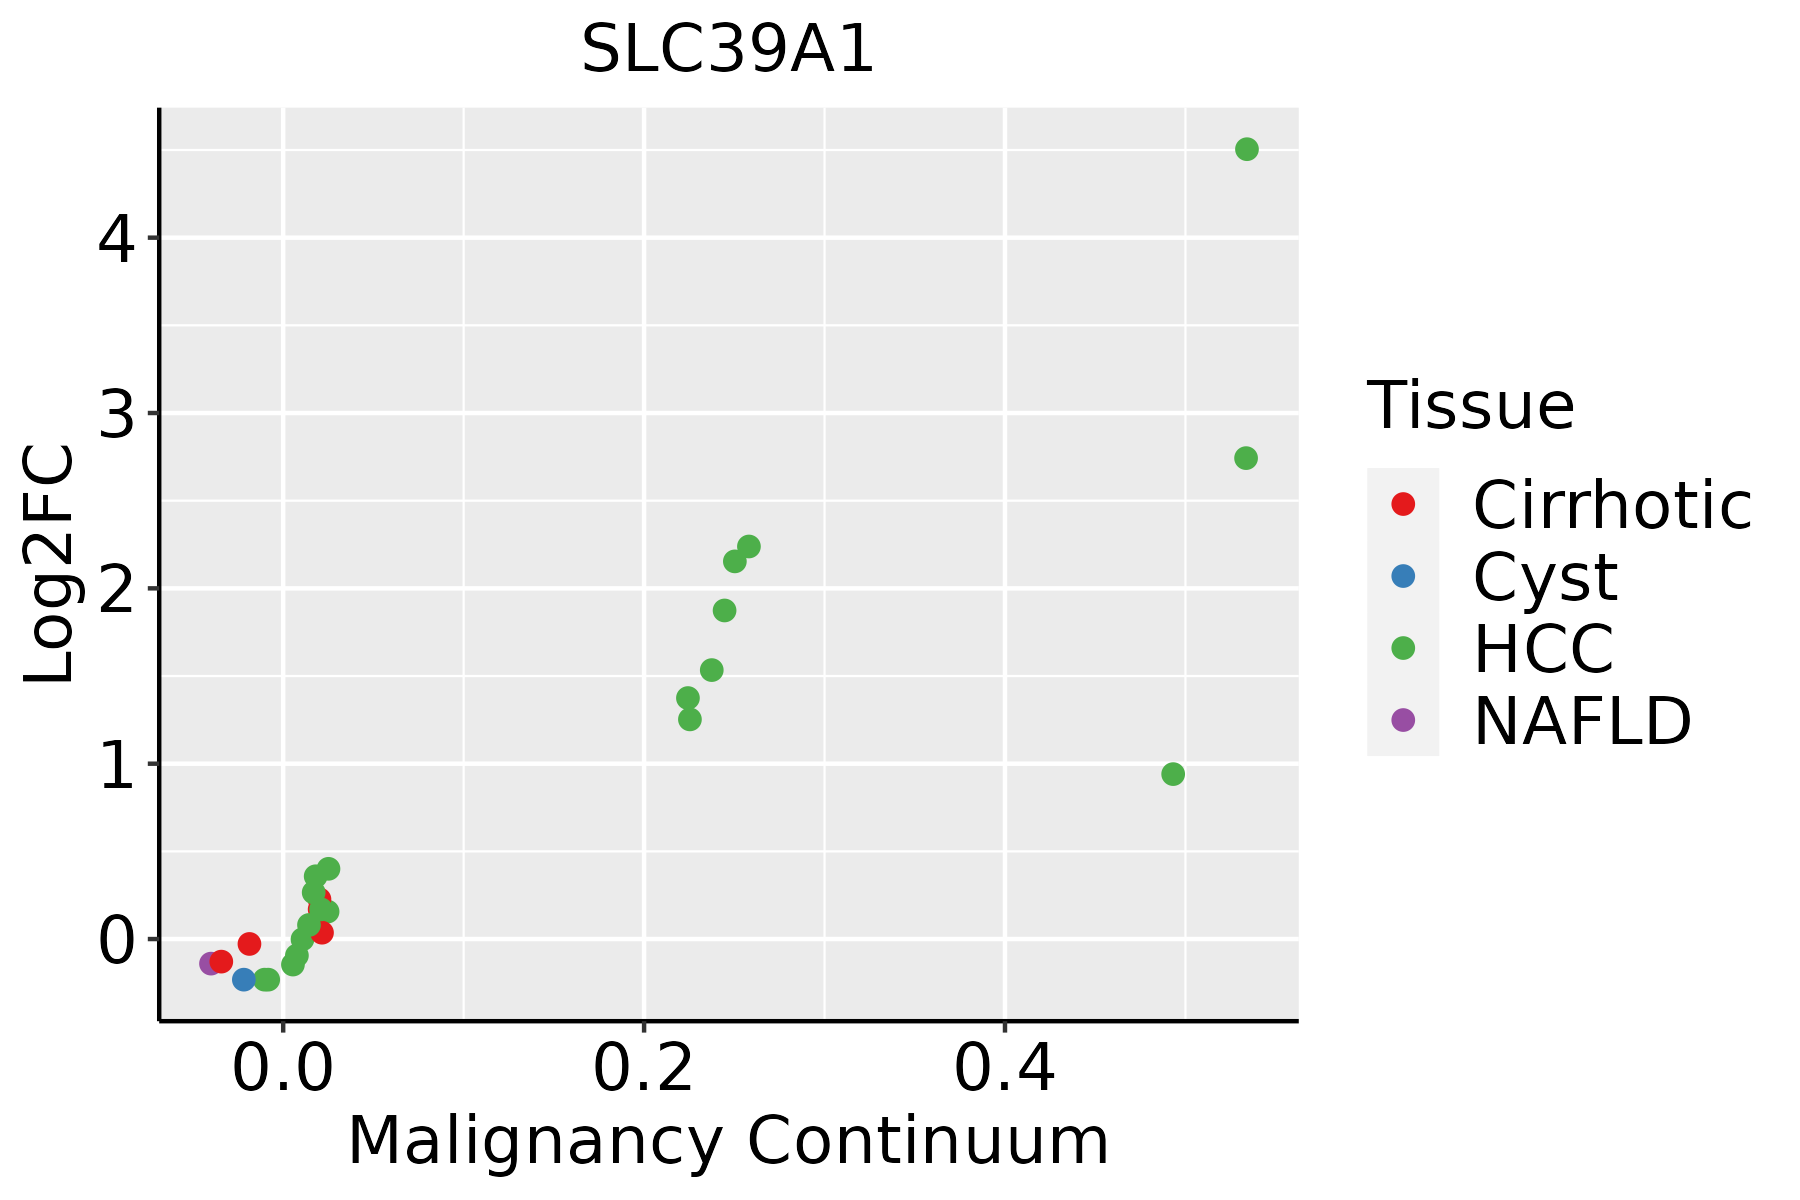 | HCC: Hepatocellular carcinoma |
| NAFLD: Non-alcoholic fatty liver disease | ||
| Oral Cavity |  | EOLP: Erosive Oral lichen planus |
| LP: leukoplakia | ||
| NEOLP: Non-erosive oral lichen planus | ||
| OSCC: Oral squamous cell carcinoma | ||
| Skin | 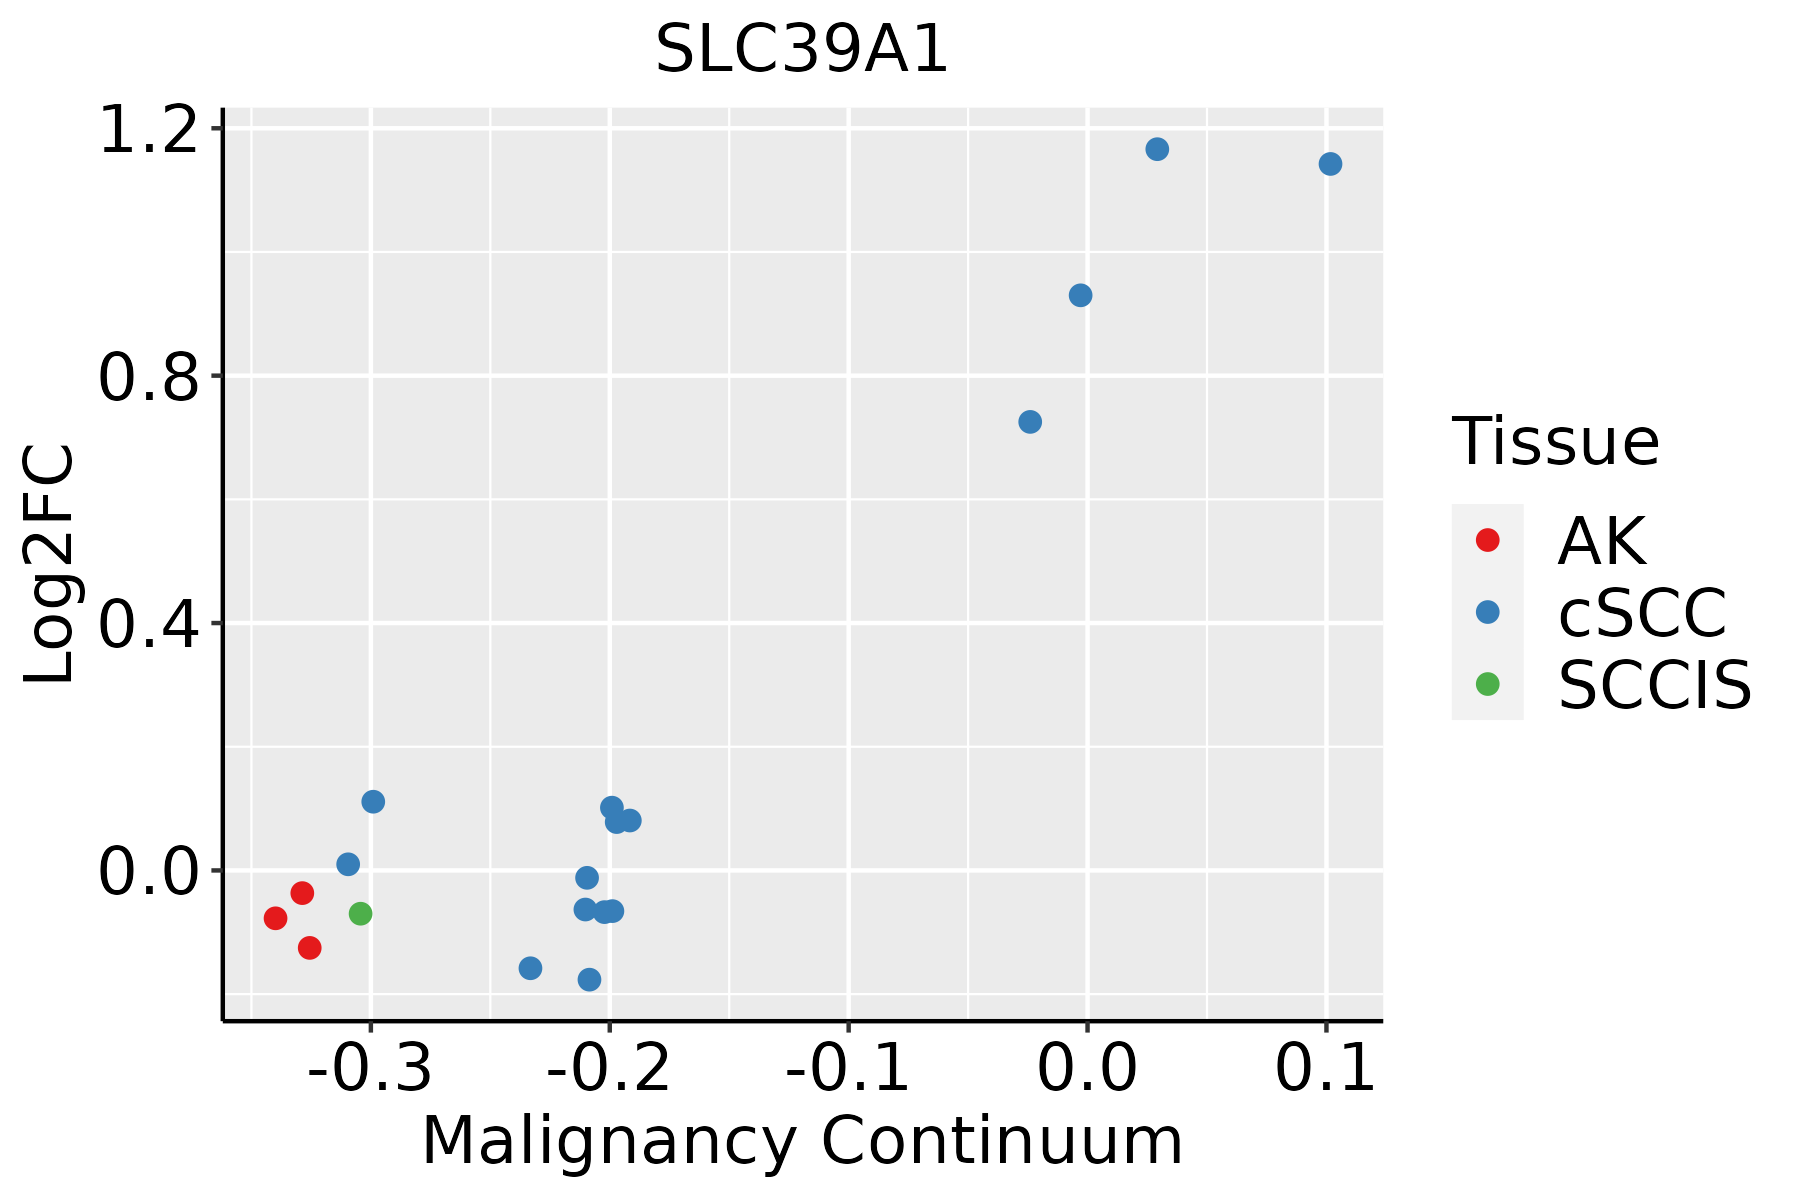 | AK: Actinic keratosis |
| cSCC: Cutaneous squamous cell carcinoma | ||
| SCCIS:squamous cell carcinoma in situ | ||
| Thyroid |  | ATC: Anaplastic thyroid cancer |
| HT: Hashimoto's thyroiditis | ||
| PTC: Papillary thyroid cancer |
| ∗log2FC in expression of this searched gene in stem-like cells from each diseased tissue sample relative to stem-like cells in normal samples in each tissue plotted against the malignancy continuum. Samples are colored based on if they are from different disease stage. |
Top |
Malignant transformation related pathway analysis |
| Find out the enriched GO biological processes and KEGG pathways involved in transition from healthy to precancer to cancer |
| Tissue | Disease Stage | Enriched GO biological Processes |
| Esophagus | ESCC |  |
| Skin | AK |  |
| Skin | SCCIS |  |
| Skin | cSCC |  |
| Thyroid | HT |  |
| ∗Top 15 enriched GO BP terms are showed in the bar plot of each disease state in each tissue. Each row represents a significant GO biological process which is colored according to the -log10(p.adjust). |
| Page: 1 2 3 4 5 6 7 8 9 |
| GO ID | Tissue | Disease Stage | Description | Gene Ratio | Bg Ratio | pvalue | p.adjust | Count |
| GO:0032868 | Colorectum | AD | response to insulin | 91/3918 | 264/18723 | 2.02e-07 | 8.48e-06 | 91 |
| GO:1901653 | Colorectum | AD | cellular response to peptide | 114/3918 | 359/18723 | 8.32e-07 | 2.88e-05 | 114 |
| GO:0009743 | Colorectum | AD | response to carbohydrate | 86/3918 | 253/18723 | 8.43e-07 | 2.90e-05 | 86 |
| GO:0032869 | Colorectum | AD | cellular response to insulin stimulus | 72/3918 | 203/18723 | 1.10e-06 | 3.68e-05 | 72 |
| GO:0071375 | Colorectum | AD | cellular response to peptide hormone stimulus | 95/3918 | 290/18723 | 1.50e-06 | 4.66e-05 | 95 |
| GO:0055076 | Colorectum | AD | transition metal ion homeostasis | 53/3918 | 138/18723 | 1.89e-06 | 5.65e-05 | 53 |
| GO:0043434 | Colorectum | AD | response to peptide hormone | 126/3918 | 414/18723 | 2.70e-06 | 7.86e-05 | 126 |
| GO:0034284 | Colorectum | AD | response to monosaccharide | 76/3918 | 225/18723 | 4.64e-06 | 1.23e-04 | 76 |
| GO:0033500 | Colorectum | AD | carbohydrate homeostasis | 84/3918 | 259/18723 | 9.10e-06 | 2.15e-04 | 84 |
| GO:0009746 | Colorectum | AD | response to hexose | 73/3918 | 219/18723 | 1.20e-05 | 2.65e-04 | 73 |
| GO:0009749 | Colorectum | AD | response to glucose | 71/3918 | 212/18723 | 1.31e-05 | 2.85e-04 | 71 |
| GO:0042593 | Colorectum | AD | glucose homeostasis | 83/3918 | 258/18723 | 1.44e-05 | 3.11e-04 | 83 |
| GO:0001678 | Colorectum | AD | cellular glucose homeostasis | 60/3918 | 172/18723 | 1.49e-05 | 3.18e-04 | 60 |
| GO:0019318 | Colorectum | AD | hexose metabolic process | 77/3918 | 237/18723 | 1.96e-05 | 4.01e-04 | 77 |
| GO:0001701 | Colorectum | AD | in utero embryonic development | 110/3918 | 367/18723 | 2.36e-05 | 4.62e-04 | 110 |
| GO:0046916 | Colorectum | AD | cellular transition metal ion homeostasis | 43/3918 | 115/18723 | 3.62e-05 | 6.56e-04 | 43 |
| GO:0071322 | Colorectum | AD | cellular response to carbohydrate stimulus | 56/3918 | 163/18723 | 4.61e-05 | 7.97e-04 | 56 |
| GO:0005996 | Colorectum | AD | monosaccharide metabolic process | 80/3918 | 257/18723 | 7.31e-05 | 1.17e-03 | 80 |
| GO:0071333 | Colorectum | AD | cellular response to glucose stimulus | 52/3918 | 151/18723 | 7.88e-05 | 1.25e-03 | 52 |
| GO:0071331 | Colorectum | AD | cellular response to hexose stimulus | 52/3918 | 153/18723 | 1.16e-04 | 1.71e-03 | 52 |
| Page: 1 2 3 4 5 6 7 8 9 10 11 12 13 14 15 16 17 18 19 20 21 22 23 24 |
| Pathway ID | Tissue | Disease Stage | Description | Gene Ratio | Bg Ratio | pvalue | p.adjust | qvalue | Count |
| hsa05012 | Colorectum | AD | Parkinson disease | 147/2092 | 266/8465 | 2.53e-27 | 8.48e-25 | 5.41e-25 | 147 |
| hsa05010 | Colorectum | AD | Alzheimer disease | 174/2092 | 384/8465 | 1.82e-19 | 9.26e-18 | 5.91e-18 | 174 |
| hsa050121 | Colorectum | AD | Parkinson disease | 147/2092 | 266/8465 | 2.53e-27 | 8.48e-25 | 5.41e-25 | 147 |
| hsa050101 | Colorectum | AD | Alzheimer disease | 174/2092 | 384/8465 | 1.82e-19 | 9.26e-18 | 5.91e-18 | 174 |
| hsa050122 | Colorectum | SER | Parkinson disease | 132/1580 | 266/8465 | 2.72e-31 | 9.03e-29 | 6.55e-29 | 132 |
| hsa050102 | Colorectum | SER | Alzheimer disease | 146/1580 | 384/8465 | 6.52e-20 | 2.40e-18 | 1.75e-18 | 146 |
| hsa050123 | Colorectum | SER | Parkinson disease | 132/1580 | 266/8465 | 2.72e-31 | 9.03e-29 | 6.55e-29 | 132 |
| hsa050103 | Colorectum | SER | Alzheimer disease | 146/1580 | 384/8465 | 6.52e-20 | 2.40e-18 | 1.75e-18 | 146 |
| hsa050124 | Colorectum | MSS | Parkinson disease | 140/1875 | 266/8465 | 2.32e-28 | 7.79e-26 | 4.77e-26 | 140 |
| hsa050104 | Colorectum | MSS | Alzheimer disease | 169/1875 | 384/8465 | 1.21e-22 | 1.01e-20 | 6.21e-21 | 169 |
| hsa050125 | Colorectum | MSS | Parkinson disease | 140/1875 | 266/8465 | 2.32e-28 | 7.79e-26 | 4.77e-26 | 140 |
| hsa050105 | Colorectum | MSS | Alzheimer disease | 169/1875 | 384/8465 | 1.21e-22 | 1.01e-20 | 6.21e-21 | 169 |
| hsa05012211 | Esophagus | ESCC | Parkinson disease | 201/4205 | 266/8465 | 1.56e-18 | 8.72e-17 | 4.46e-17 | 201 |
| hsa05010210 | Esophagus | ESCC | Alzheimer disease | 263/4205 | 384/8465 | 1.80e-14 | 5.47e-13 | 2.80e-13 | 263 |
| hsa05012310 | Esophagus | ESCC | Parkinson disease | 201/4205 | 266/8465 | 1.56e-18 | 8.72e-17 | 4.46e-17 | 201 |
| hsa0501038 | Esophagus | ESCC | Alzheimer disease | 263/4205 | 384/8465 | 1.80e-14 | 5.47e-13 | 2.80e-13 | 263 |
| hsa0501214 | Liver | Cirrhotic | Parkinson disease | 158/2530 | 266/8465 | 3.62e-24 | 6.02e-22 | 3.71e-22 | 158 |
| hsa0501014 | Liver | Cirrhotic | Alzheimer disease | 180/2530 | 384/8465 | 5.52e-13 | 1.36e-11 | 8.36e-12 | 180 |
| hsa0501215 | Liver | Cirrhotic | Parkinson disease | 158/2530 | 266/8465 | 3.62e-24 | 6.02e-22 | 3.71e-22 | 158 |
| hsa0501015 | Liver | Cirrhotic | Alzheimer disease | 180/2530 | 384/8465 | 5.52e-13 | 1.36e-11 | 8.36e-12 | 180 |
| Page: 1 2 |
Top |
Cell-cell communication analysis |
| Identification of potential cell-cell interactions between two cell types and their ligand-receptor pairs for different disease states |
| Ligand | Receptor | LRpair | Pathway | Tissue | Disease Stage |
| Page: 1 |
Top |
Single-cell gene regulatory network inference analysis |
| Find out the significant the regulons (TFs) and the target genes of each regulon across cell types for different disease states |
| TF | Cell Type | Tissue | Disease Stage | Target Gene | RSS | Regulon Activity |
| ∗The dot plots of a searched regulon are shown for all cell subpopulations in each disease state of each tissue based on the regulon specific score inferred using pySCENIC and by calculating the average expression. |
| Page: 1 |
Top |
Somatic mutation of malignant transformation related genes |
| Annotation of somatic variants for genes involved in malignant transformation |
| Hugo Symbol | Variant Class | Variant Classification | dbSNP RS | HGVSc | HGVSp | HGVSp Short | SWISSPROT | BIOTYPE | SIFT | PolyPhen | Tumor Sample Barcode | Tissue | Histology | Sex | Age | Stage | Therapy Types | Drugs | Outcome |
| SLC39A1 | SNV | Missense_Mutation | c.14G>A | p.Gly5Glu | p.G5E | Q9NY26 | protein_coding | tolerated_low_confidence(0.22) | benign(0) | TCGA-AN-A046-01 | Breast | breast invasive carcinoma | Female | >=65 | I/II | Unknown | Unknown | SD | |
| SLC39A1 | SNV | Missense_Mutation | c.118N>T | p.Leu40Phe | p.L40F | Q9NY26 | protein_coding | deleterious(0.02) | probably_damaging(0.996) | TCGA-IR-A3LA-01 | Cervix | cervical & endocervical cancer | Female | <65 | I/II | Chemotherapy | cisplatin | CR | |
| SLC39A1 | SNV | Missense_Mutation | novel | c.883G>C | p.Glu295Gln | p.E295Q | Q9NY26 | protein_coding | tolerated(0.06) | probably_damaging(0.976) | TCGA-VS-A958-01 | Cervix | cervical & endocervical cancer | Female | <65 | I/II | Chemotherapy | cisplatin | CR |
| SLC39A1 | SNV | Missense_Mutation | novel | c.536N>A | p.Arg179His | p.R179H | Q9NY26 | protein_coding | deleterious(0) | possibly_damaging(0.777) | TCGA-AJ-A3BK-01 | Endometrium | uterine corpus endometrioid carcinoma | Female | >=65 | I/II | Unknown | Unknown | SD |
| SLC39A1 | SNV | Missense_Mutation | c.244N>A | p.Ala82Thr | p.A82T | Q9NY26 | protein_coding | deleterious(0.01) | possibly_damaging(0.897) | TCGA-AP-A059-01 | Endometrium | uterine corpus endometrioid carcinoma | Female | >=65 | I/II | Unknown | Unknown | SD | |
| SLC39A1 | SNV | Missense_Mutation | novel | c.535N>T | p.Arg179Cys | p.R179C | Q9NY26 | protein_coding | deleterious(0.03) | probably_damaging(0.995) | TCGA-AP-A1DK-01 | Endometrium | uterine corpus endometrioid carcinoma | Female | <65 | I/II | Unknown | Unknown | SD |
| SLC39A1 | SNV | Missense_Mutation | novel | c.503N>T | p.Ala168Val | p.A168V | Q9NY26 | protein_coding | tolerated(0.39) | benign(0.058) | TCGA-DF-A2KU-01 | Endometrium | uterine corpus endometrioid carcinoma | Female | Unknown | I/II | Unknown | Unknown | SD |
| SLC39A1 | SNV | Missense_Mutation | novel | c.770G>A | p.Gly257Asp | p.G257D | Q9NY26 | protein_coding | deleterious(0) | probably_damaging(0.999) | TCGA-55-6987-01 | Lung | lung adenocarcinoma | Male | >=65 | I/II | Unknown | Unknown | SD |
| SLC39A1 | SNV | Missense_Mutation | novel | c.294N>T | p.Glu98Asp | p.E98D | Q9NY26 | protein_coding | tolerated(0.45) | benign(0.066) | TCGA-55-8506-01 | Lung | lung adenocarcinoma | Female | <65 | I/II | Unknown | Unknown | SD |
| SLC39A1 | SNV | Missense_Mutation | c.901N>G | p.Gln301Glu | p.Q301E | Q9NY26 | protein_coding | tolerated(0.62) | benign(0.089) | TCGA-55-8507-01 | Lung | lung adenocarcinoma | Male | <65 | I/II | Unknown | Unknown | SD |
| Page: 1 2 3 |
Top |
Related drugs of malignant transformation related genes |
| Identification of chemicals and drugs interact with genes involved in malignant transfromation |
| (DGIdb 4.0) |
| Entrez ID | Symbol | Category | Interaction Types | Drug Claim Name | Drug Name | PMIDs |
| Page: 1 |

Copyright 2023-Present -The University of Texas Health Science Center at Houston |