
|
|||||
|
 | |
| |
| |
| |
| |
| |
|
Gene: SGMS1 |
Gene summary for SGMS1 |
| Gene information | Species | Human | Gene symbol | SGMS1 | Gene ID | 259230 |
| Gene name | sphingomyelin synthase 1 | |
| Gene Alias | MOB | |
| Cytomap | 10q11.23 | |
| Gene Type | protein-coding | GO ID | GO:0002237 | UniProtAcc | D3DWC4 |
Top |
Malignant transformation analysis |
| Identification of the aberrant gene expression in precancerous and cancerous lesions by comparing the gene expression of stem-like cells in diseased tissues with normal stem cells |
| Entrez ID | Symbol | Replicates | Species | Organ | Tissue | Adj P-value | Log2FC | Malignancy |
| 259230 | SGMS1 | CCI_1 | Human | Cervix | CC | 2.12e-03 | 6.30e-01 | 0.528 |
| 259230 | SGMS1 | CCI_2 | Human | Cervix | CC | 9.56e-05 | 7.84e-01 | 0.5249 |
| 259230 | SGMS1 | CCI_3 | Human | Cervix | CC | 6.77e-06 | 5.63e-01 | 0.516 |
| 259230 | SGMS1 | HTA11_3410_2000001011 | Human | Colorectum | AD | 1.56e-11 | -5.16e-01 | 0.0155 |
| 259230 | SGMS1 | HTA11_2487_2000001011 | Human | Colorectum | SER | 2.55e-04 | -4.91e-01 | -0.1808 |
| 259230 | SGMS1 | HTA11_3361_2000001011 | Human | Colorectum | AD | 6.90e-07 | -6.00e-01 | -0.1207 |
| 259230 | SGMS1 | HTA11_83_2000001011 | Human | Colorectum | SER | 9.23e-03 | -4.10e-01 | -0.1526 |
| 259230 | SGMS1 | HTA11_696_2000001011 | Human | Colorectum | AD | 4.05e-09 | -4.56e-01 | -0.1464 |
| 259230 | SGMS1 | HTA11_866_2000001011 | Human | Colorectum | AD | 1.23e-04 | -3.28e-01 | -0.1001 |
| 259230 | SGMS1 | HTA11_866_3004761011 | Human | Colorectum | AD | 5.53e-05 | -4.27e-01 | 0.096 |
| 259230 | SGMS1 | HTA11_10711_2000001011 | Human | Colorectum | AD | 1.47e-05 | -5.46e-01 | 0.0338 |
| 259230 | SGMS1 | HTA11_7696_3000711011 | Human | Colorectum | AD | 1.04e-07 | -4.32e-01 | 0.0674 |
| 259230 | SGMS1 | HTA11_99999970781_79442 | Human | Colorectum | MSS | 2.56e-03 | -3.79e-01 | 0.294 |
| 259230 | SGMS1 | HTA11_99999971662_82457 | Human | Colorectum | MSS | 7.77e-07 | -3.33e-01 | 0.3859 |
| 259230 | SGMS1 | HTA11_99999973899_84307 | Human | Colorectum | MSS | 2.48e-05 | -5.87e-01 | 0.2585 |
| 259230 | SGMS1 | HTA11_99999974143_84620 | Human | Colorectum | MSS | 1.50e-19 | -5.75e-01 | 0.3005 |
| 259230 | SGMS1 | F007 | Human | Colorectum | FAP | 4.61e-06 | -4.14e-01 | 0.1176 |
| 259230 | SGMS1 | A001-C-207 | Human | Colorectum | FAP | 3.19e-06 | -3.40e-01 | 0.1278 |
| 259230 | SGMS1 | A015-C-203 | Human | Colorectum | FAP | 1.85e-35 | -5.91e-01 | -0.1294 |
| 259230 | SGMS1 | A015-C-204 | Human | Colorectum | FAP | 3.22e-10 | -4.43e-01 | -0.0228 |
| Page: 1 2 3 4 5 6 7 8 9 |
| Tissue | Expression Dynamics | Abbreviation |
| Cervix | 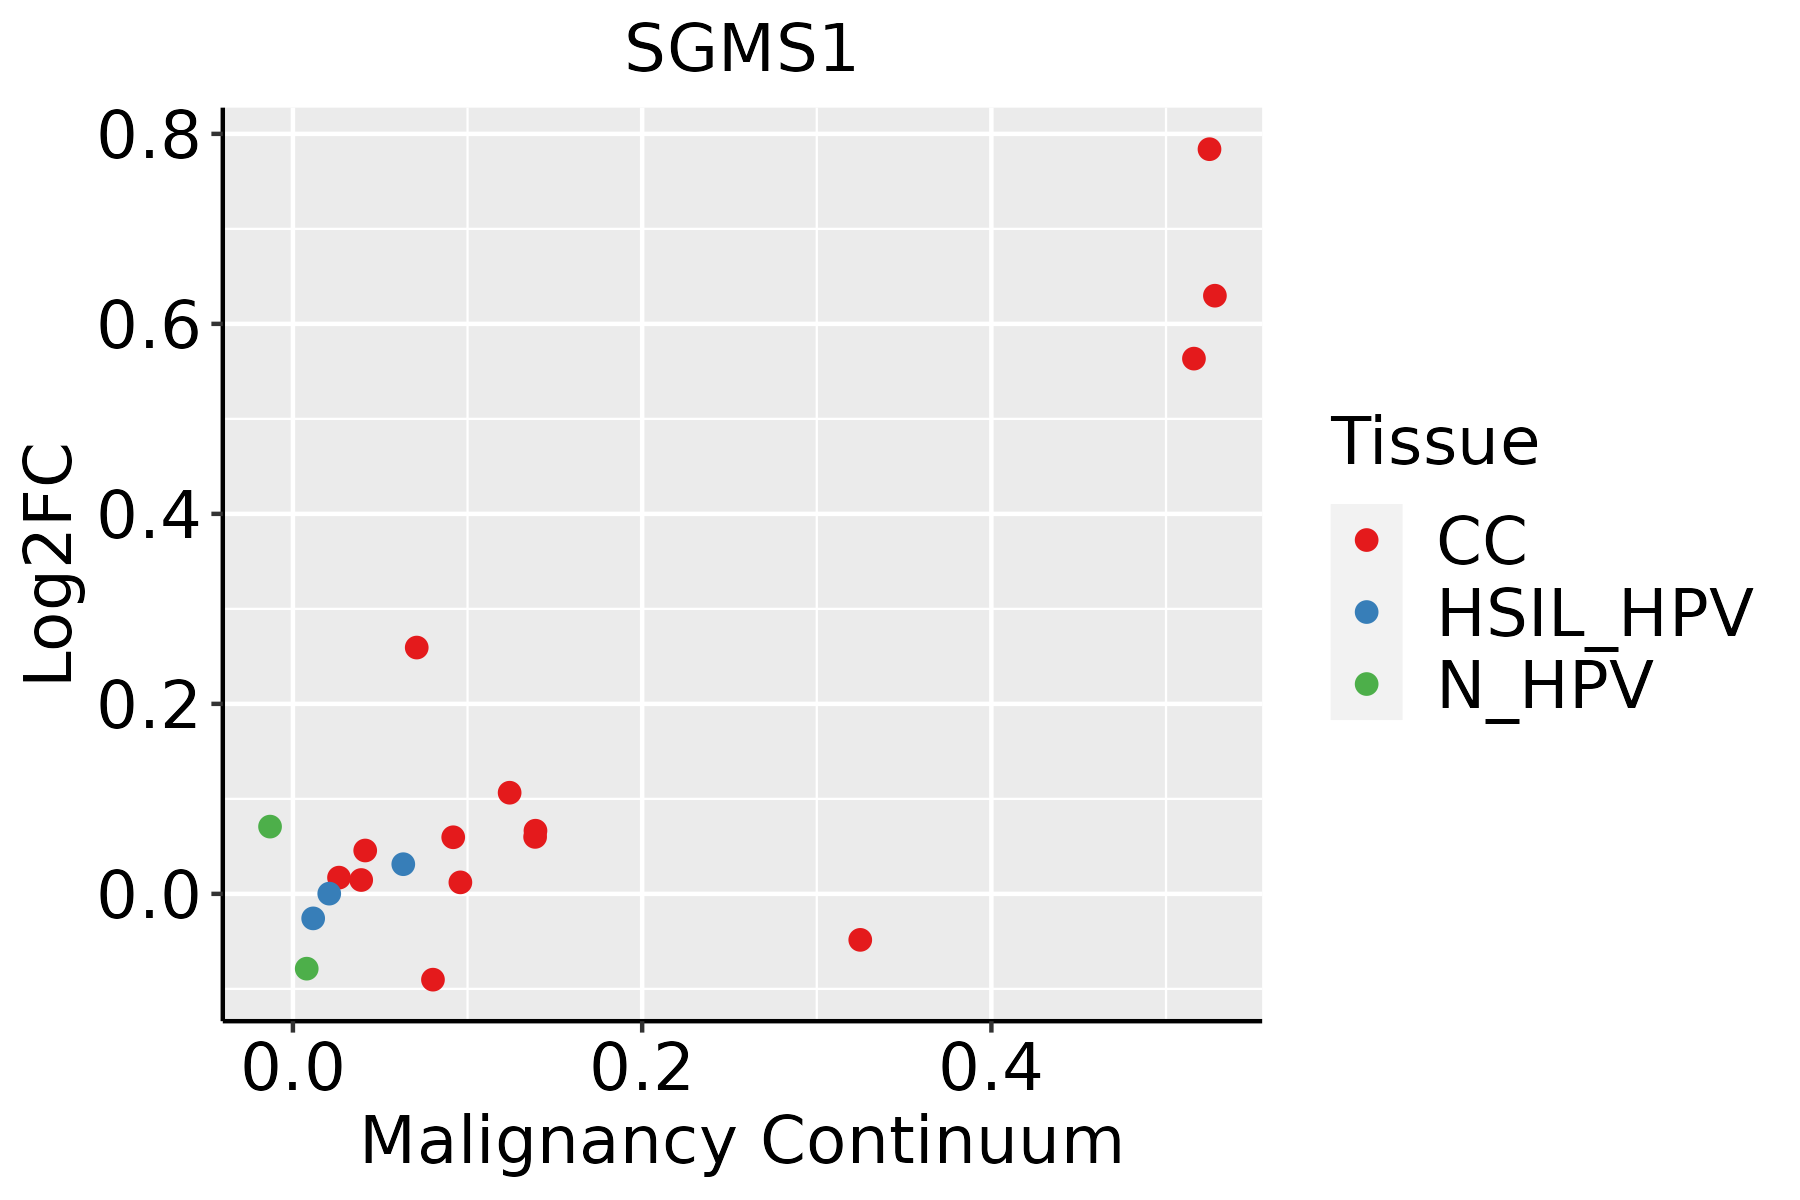 | CC: Cervix cancer |
| HSIL_HPV: HPV-infected high-grade squamous intraepithelial lesions | ||
| N_HPV: HPV-infected normal cervix | ||
| Colorectum (GSE201348) |  | FAP: Familial adenomatous polyposis |
| CRC: Colorectal cancer | ||
| Colorectum (HTA11) |  | AD: Adenomas |
| SER: Sessile serrated lesions | ||
| MSI-H: Microsatellite-high colorectal cancer | ||
| MSS: Microsatellite stable colorectal cancer | ||
| Endometrium | 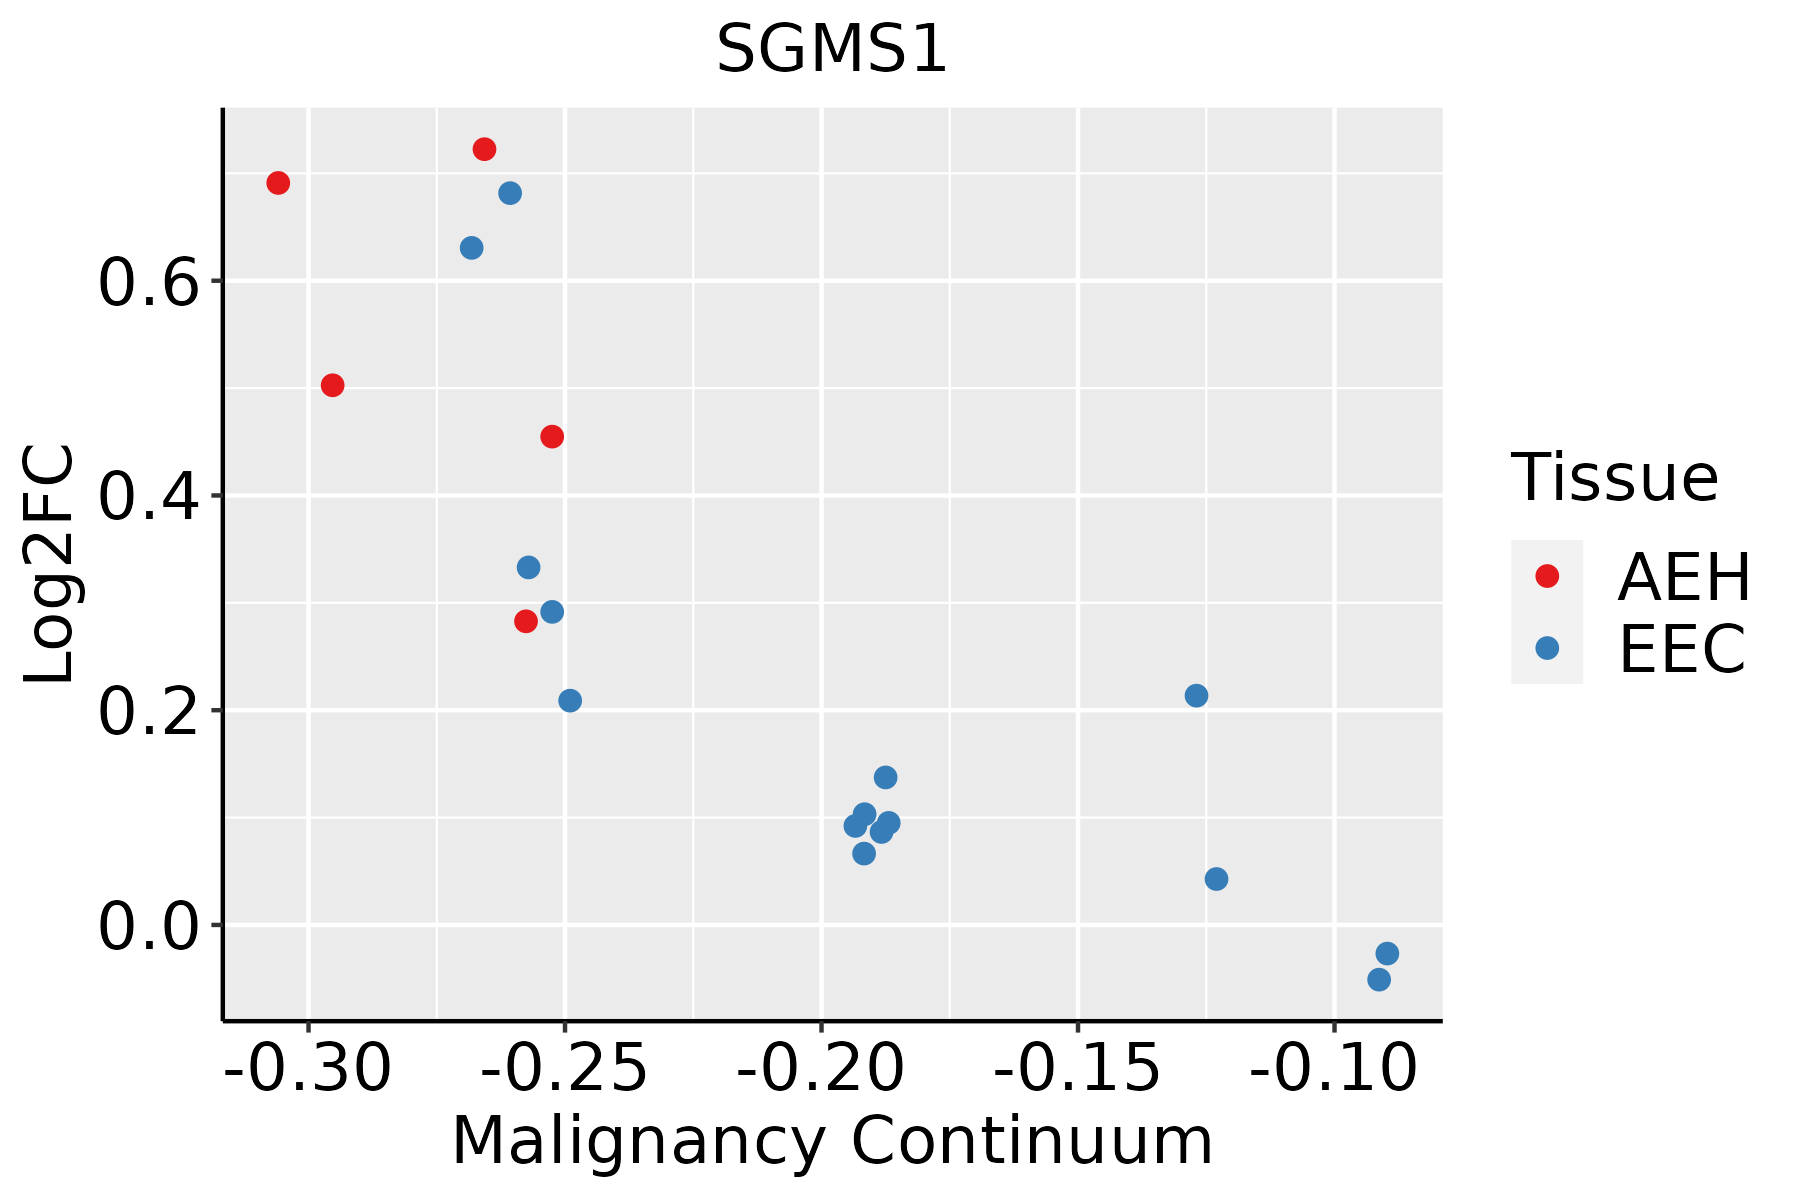 | AEH: Atypical endometrial hyperplasia |
| EEC: Endometrioid Cancer | ||
| Esophagus | 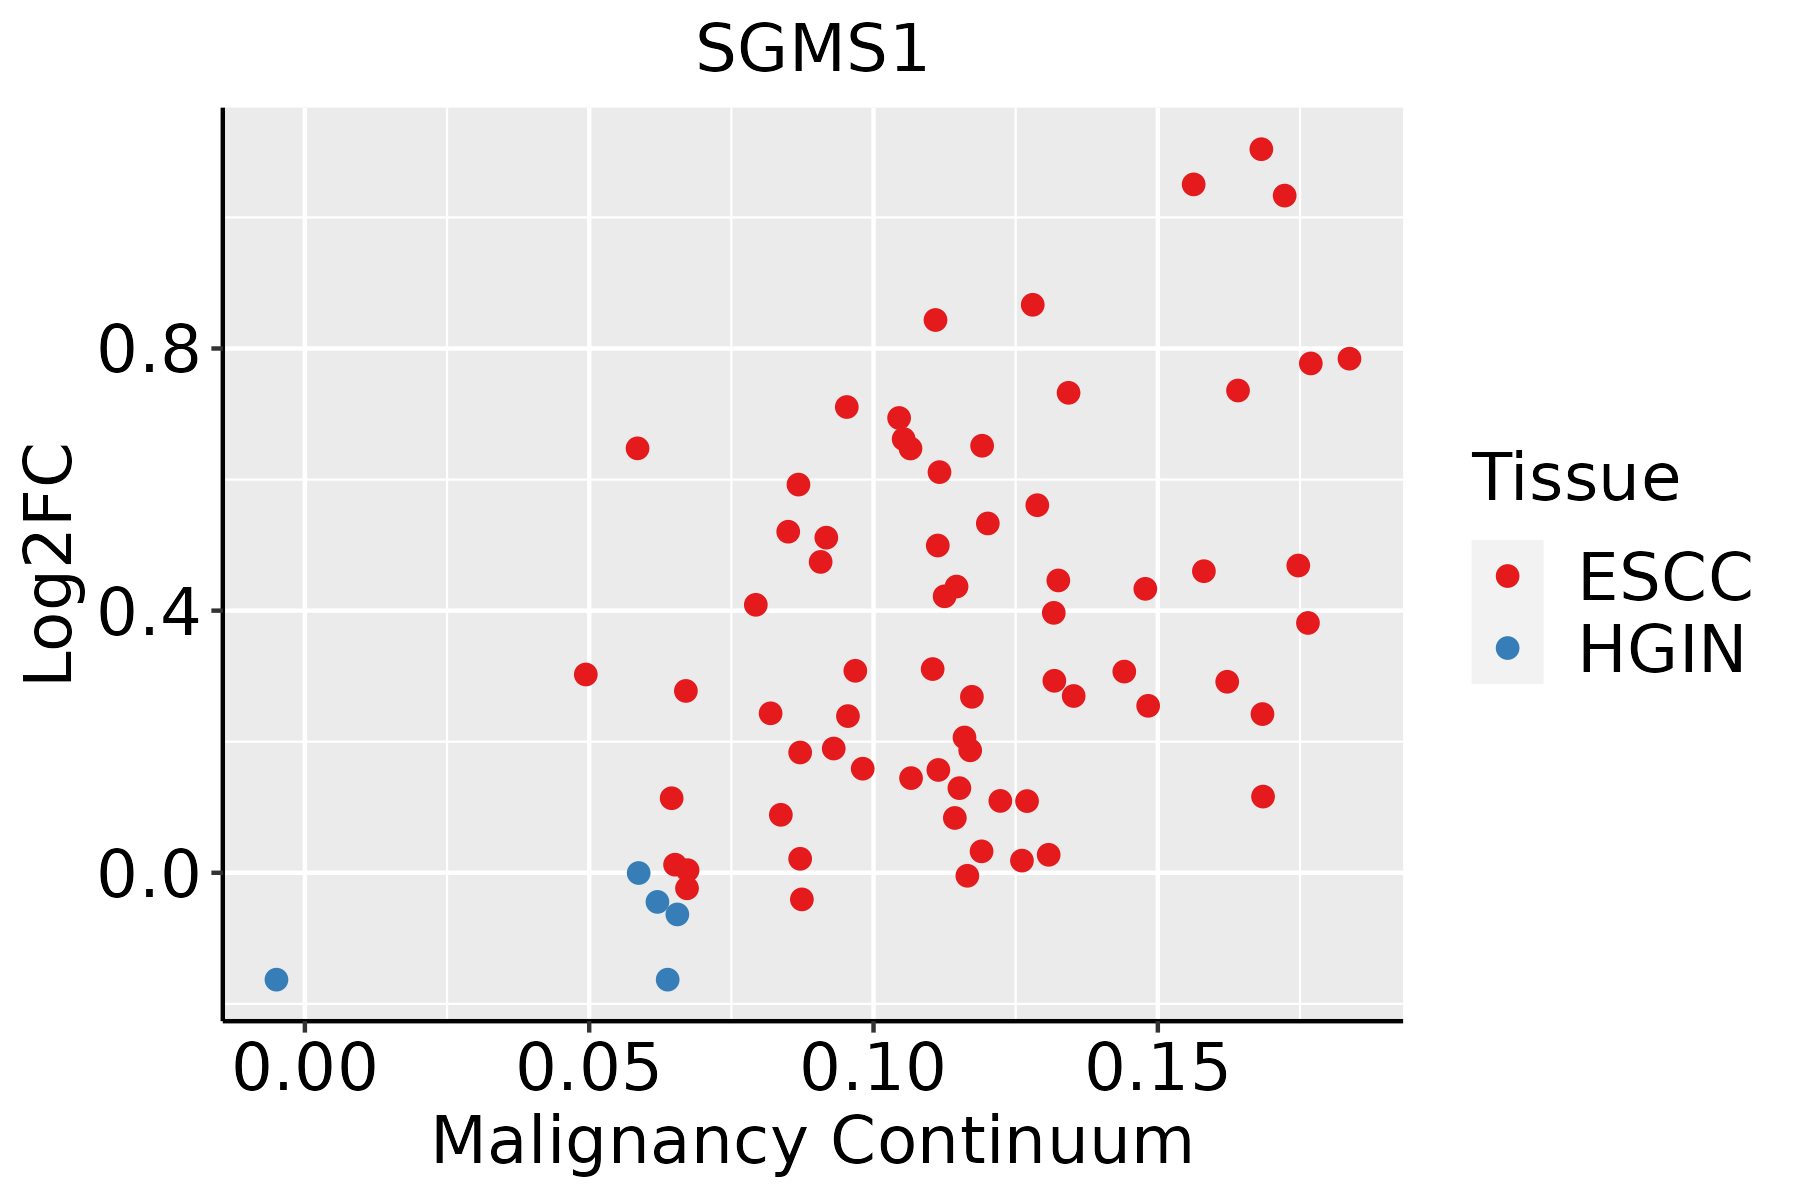 | ESCC: Esophageal squamous cell carcinoma |
| HGIN: High-grade intraepithelial neoplasias | ||
| LGIN: Low-grade intraepithelial neoplasias | ||
| Lung |  | AAH: Atypical adenomatous hyperplasia |
| AIS: Adenocarcinoma in situ | ||
| IAC: Invasive lung adenocarcinoma | ||
| MIA: Minimally invasive adenocarcinoma | ||
| Oral Cavity | 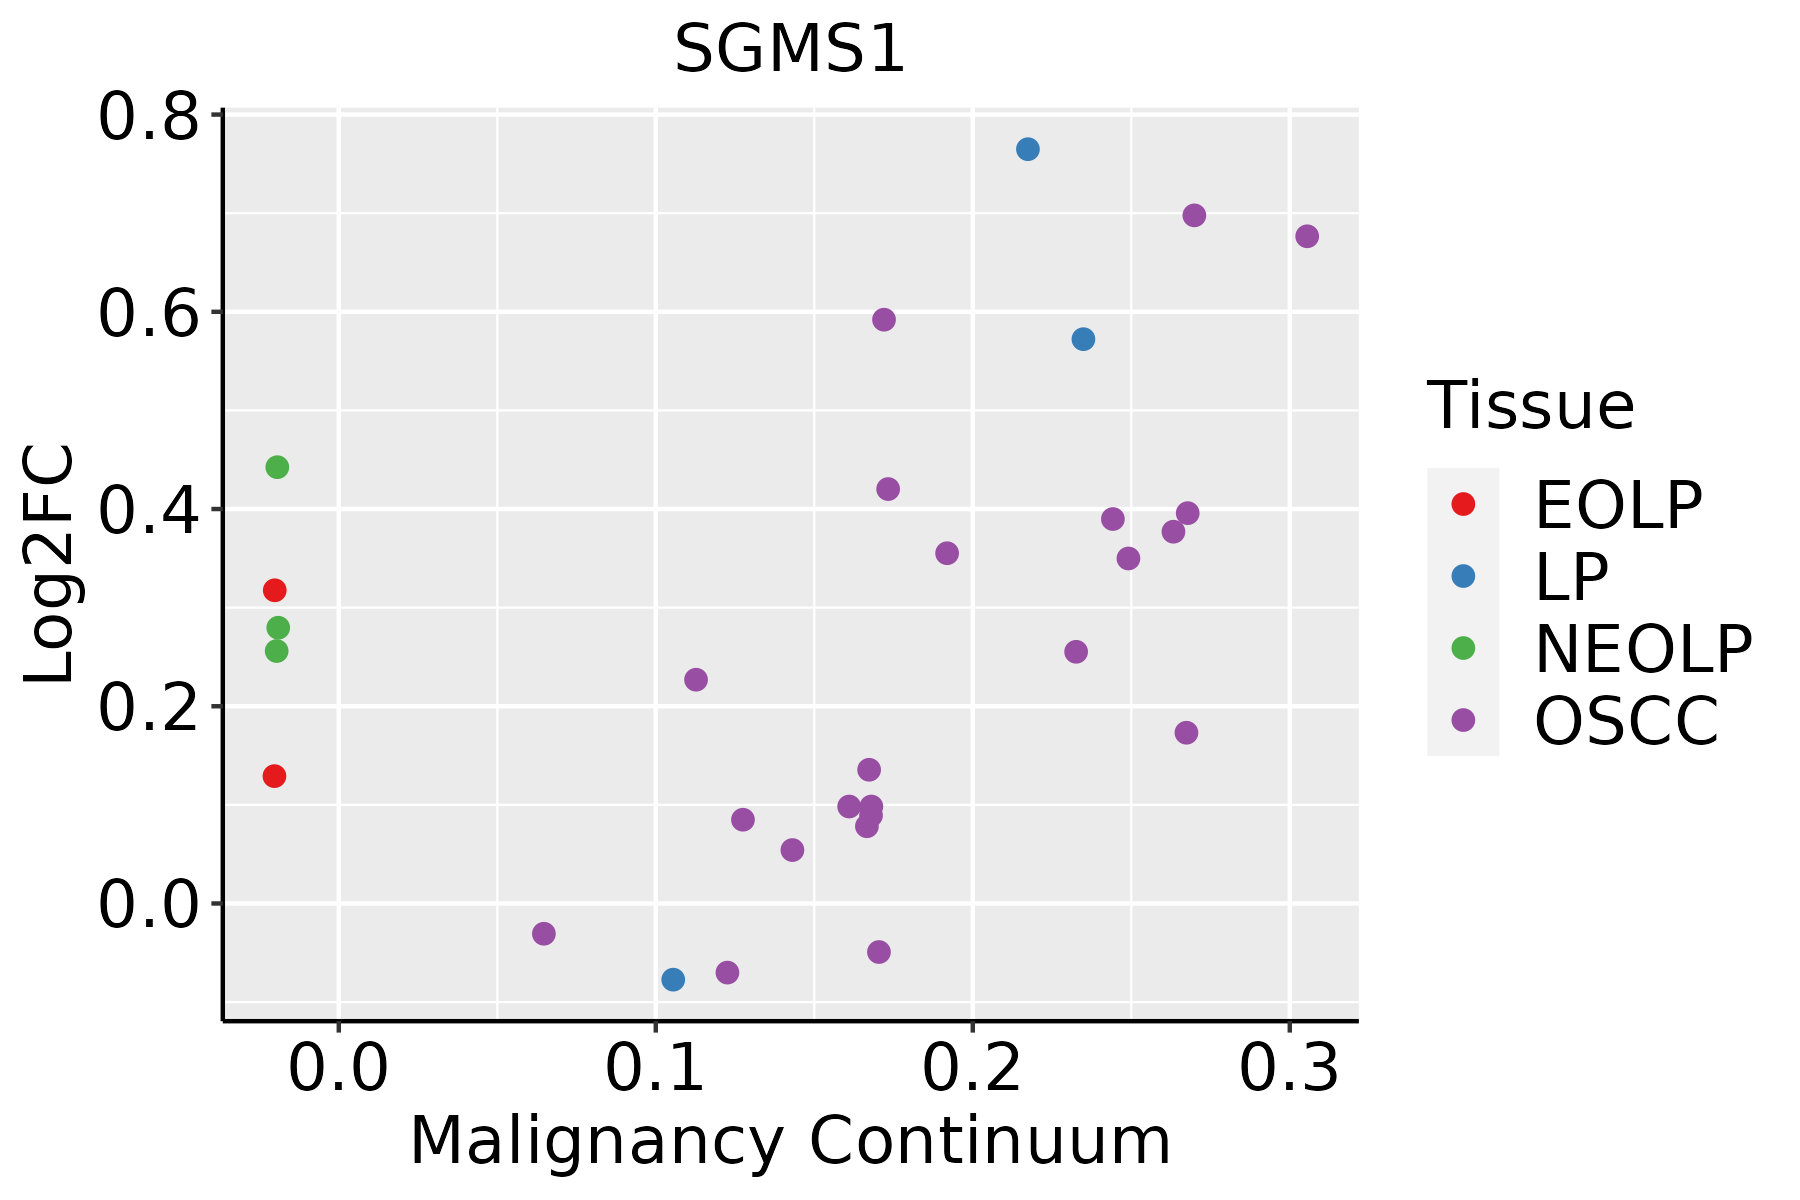 | EOLP: Erosive Oral lichen planus |
| LP: leukoplakia | ||
| NEOLP: Non-erosive oral lichen planus | ||
| OSCC: Oral squamous cell carcinoma | ||
| Prostate | 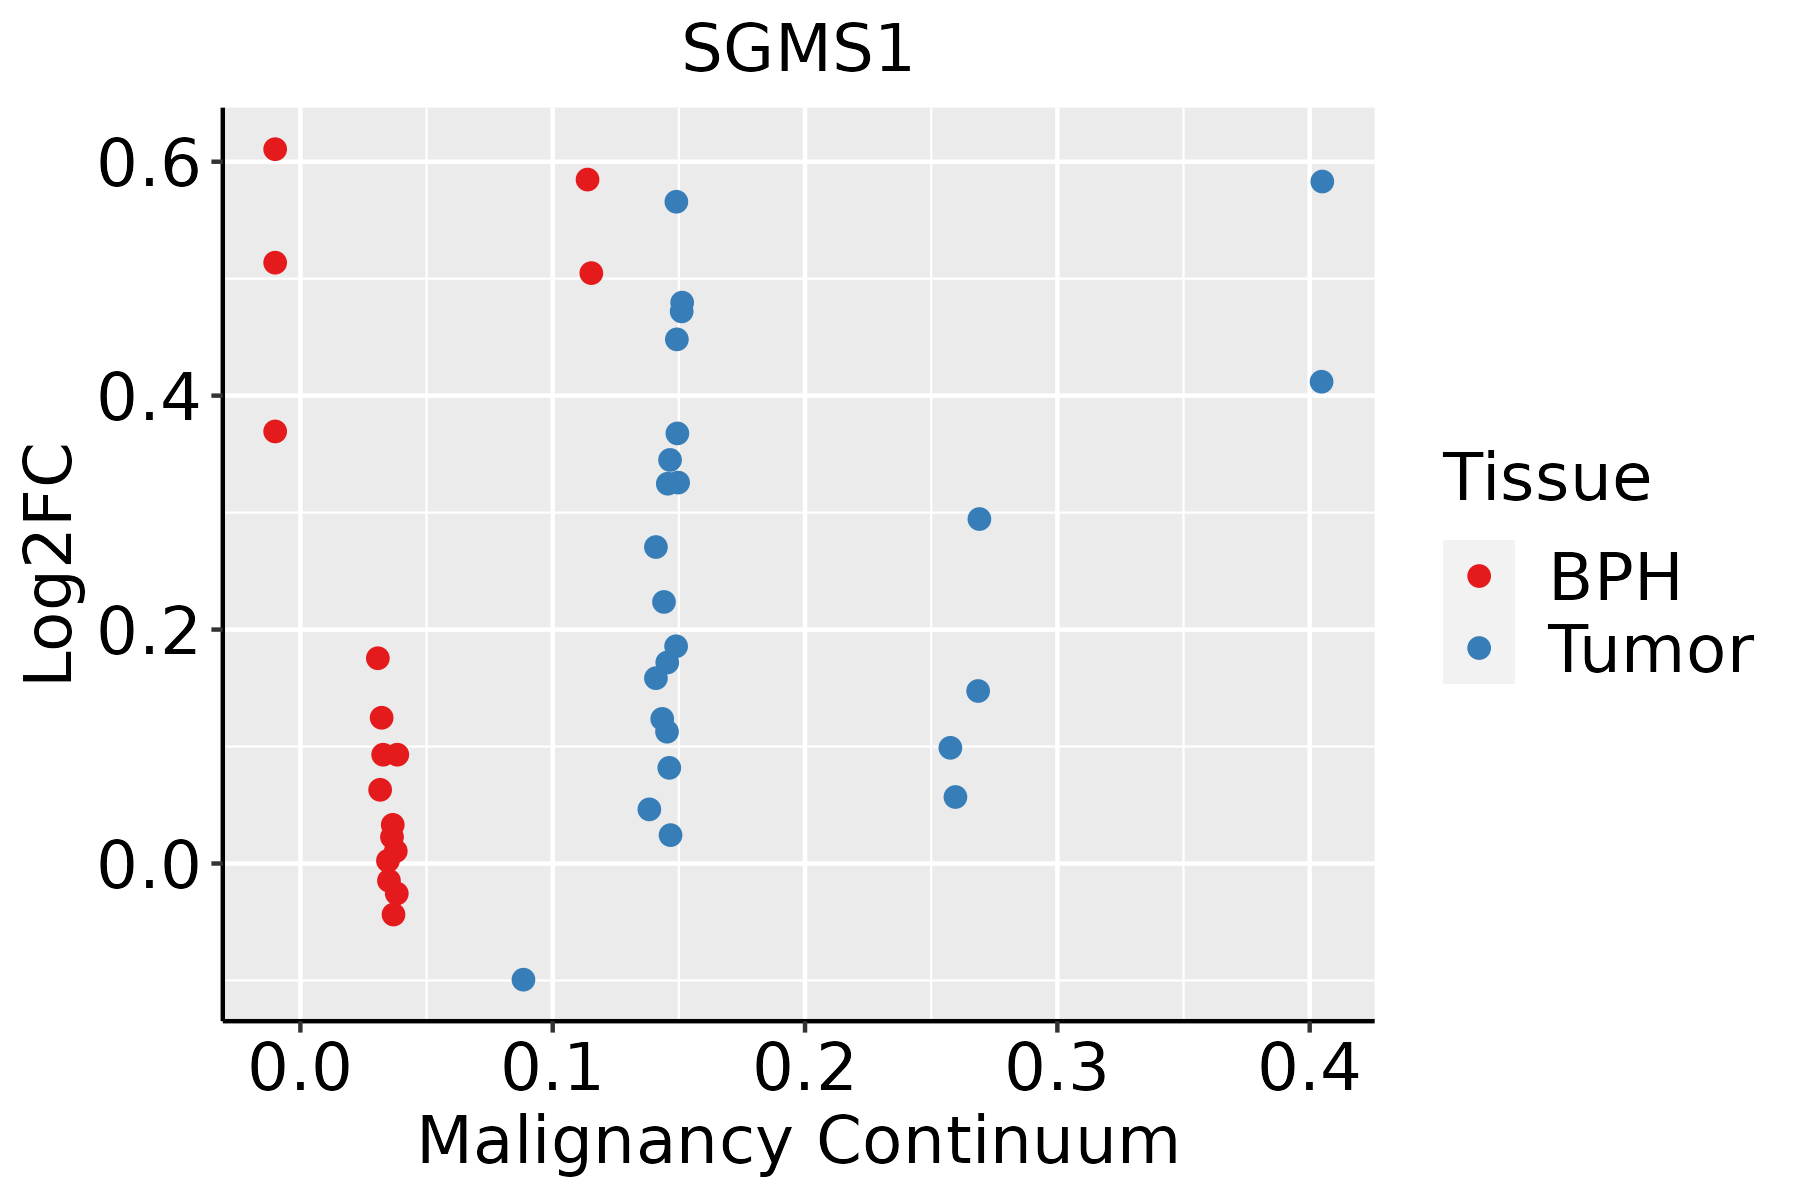 | BPH: Benign Prostatic Hyperplasia |
| Skin | 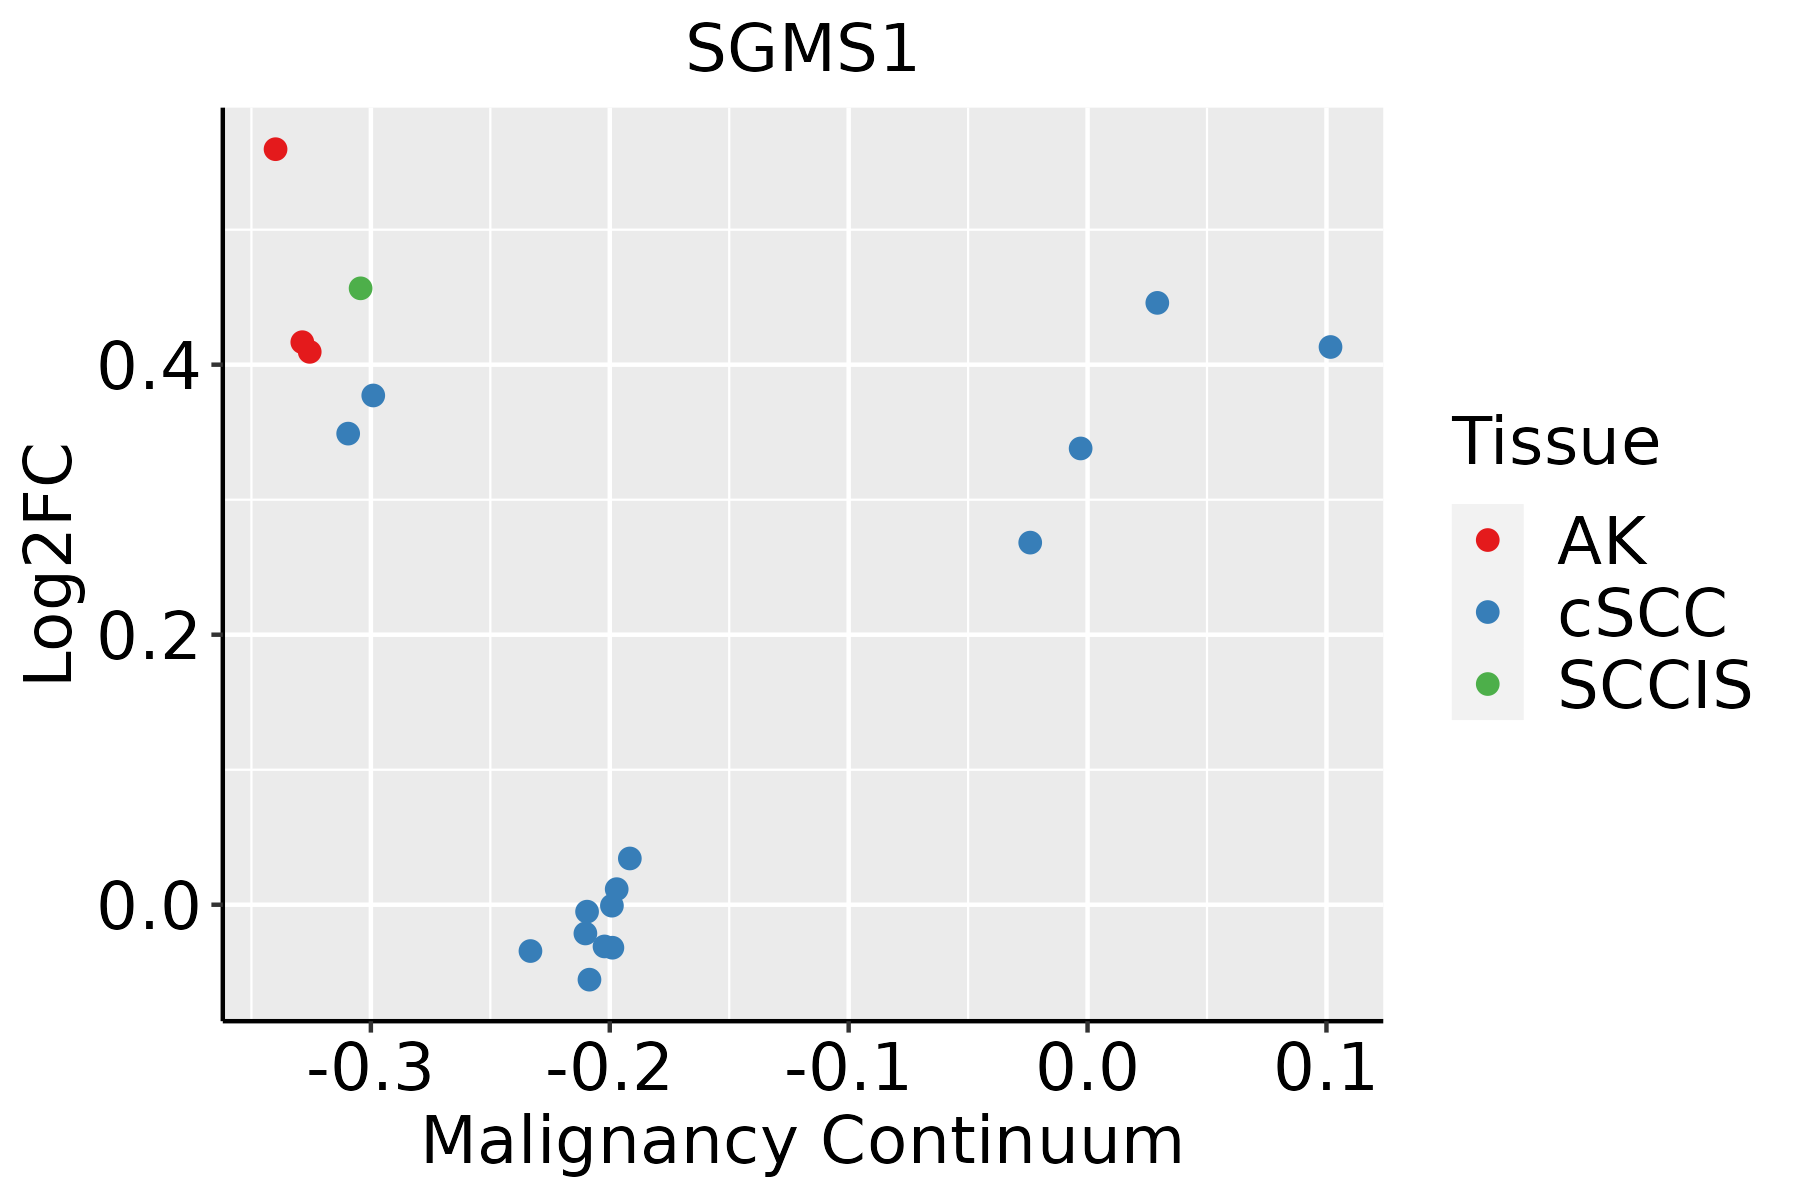 | AK: Actinic keratosis |
| cSCC: Cutaneous squamous cell carcinoma | ||
| SCCIS:squamous cell carcinoma in situ | ||
| Thyroid | 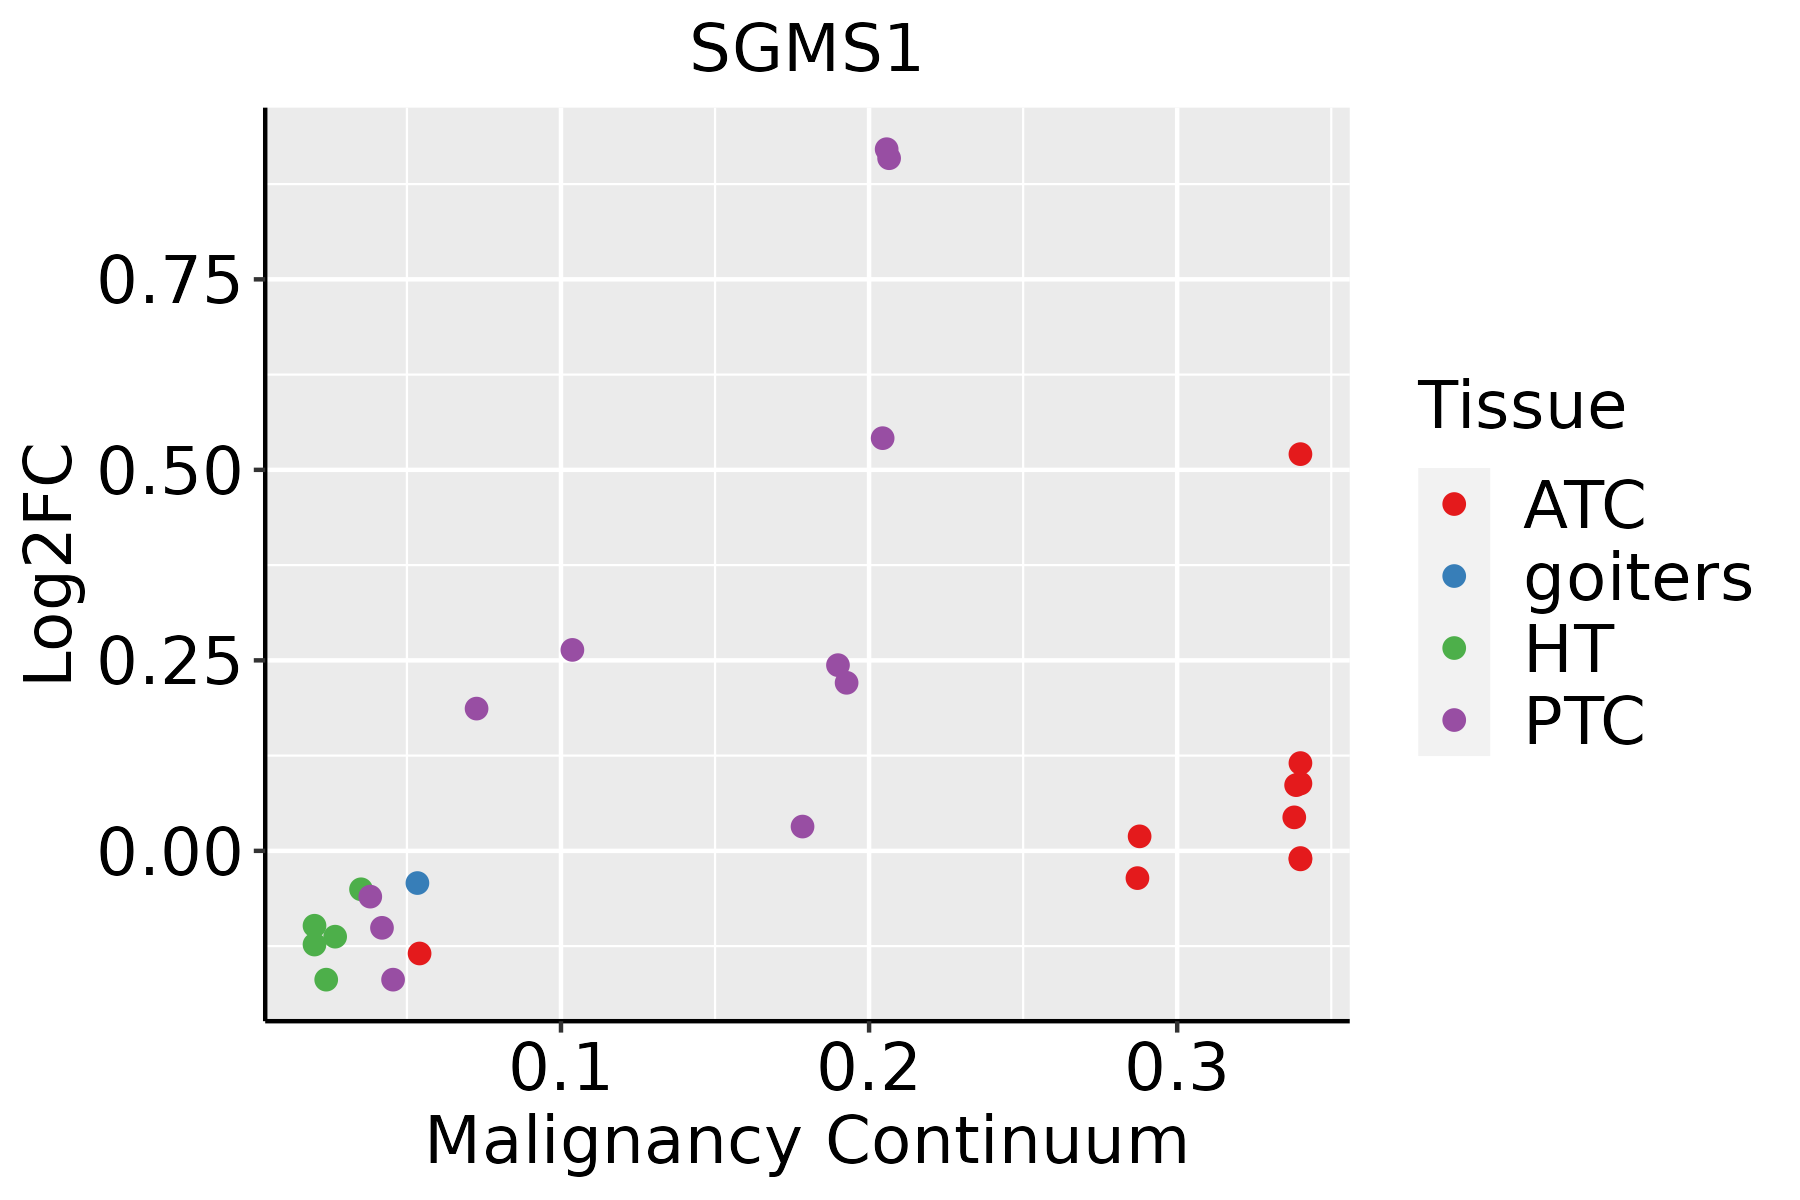 | ATC: Anaplastic thyroid cancer |
| HT: Hashimoto's thyroiditis | ||
| PTC: Papillary thyroid cancer |
| ∗log2FC in expression of this searched gene in stem-like cells from each diseased tissue sample relative to stem-like cells in normal samples in each tissue plotted against the malignancy continuum. Samples are colored based on if they are from different disease stage. |
Top |
Malignant transformation related pathway analysis |
| Find out the enriched GO biological processes and KEGG pathways involved in transition from healthy to precancer to cancer |
| Tissue | Disease Stage | Enriched GO biological Processes |
| Esophagus | ESCC |  |
| Skin | AK |  |
| Skin | SCCIS |  |
| Skin | cSCC |  |
| Thyroid | HT |  |
| ∗Top 15 enriched GO BP terms are showed in the bar plot of each disease state in each tissue. Each row represents a significant GO biological process which is colored according to the -log10(p.adjust). |
| Page: 1 2 3 4 5 6 7 8 9 |
| GO ID | Tissue | Disease Stage | Description | Gene Ratio | Bg Ratio | pvalue | p.adjust | Count |
| GO:009719310 | Cervix | CC | intrinsic apoptotic signaling pathway | 85/2311 | 288/18723 | 4.56e-15 | 6.46e-12 | 85 |
| GO:200123310 | Cervix | CC | regulation of apoptotic signaling pathway | 96/2311 | 356/18723 | 4.08e-14 | 3.05e-11 | 96 |
| GO:200124210 | Cervix | CC | regulation of intrinsic apoptotic signaling pathway | 52/2311 | 164/18723 | 5.06e-11 | 1.01e-08 | 52 |
| GO:00022379 | Cervix | CC | response to molecule of bacterial origin | 78/2311 | 363/18723 | 5.55e-07 | 2.06e-05 | 78 |
| GO:00324969 | Cervix | CC | response to lipopolysaccharide | 74/2311 | 343/18723 | 9.15e-07 | 3.25e-05 | 74 |
| GO:00346129 | Cervix | CC | response to tumor necrosis factor | 55/2311 | 253/18723 | 1.75e-05 | 3.32e-04 | 55 |
| GO:00713569 | Cervix | CC | cellular response to tumor necrosis factor | 51/2311 | 229/18723 | 1.75e-05 | 3.32e-04 | 51 |
| GO:00712228 | Cervix | CC | cellular response to lipopolysaccharide | 41/2311 | 209/18723 | 1.69e-03 | 1.29e-02 | 41 |
| GO:00712168 | Cervix | CC | cellular response to biotic stimulus | 46/2311 | 246/18723 | 2.53e-03 | 1.76e-02 | 46 |
| GO:00712198 | Cervix | CC | cellular response to molecule of bacterial origin | 42/2311 | 221/18723 | 2.79e-03 | 1.87e-02 | 42 |
| GO:0097193 | Colorectum | AD | intrinsic apoptotic signaling pathway | 108/3918 | 288/18723 | 6.25e-11 | 6.41e-09 | 108 |
| GO:2001242 | Colorectum | AD | regulation of intrinsic apoptotic signaling pathway | 67/3918 | 164/18723 | 4.94e-09 | 3.16e-07 | 67 |
| GO:2001233 | Colorectum | AD | regulation of apoptotic signaling pathway | 119/3918 | 356/18723 | 2.14e-08 | 1.21e-06 | 119 |
| GO:0006644 | Colorectum | AD | phospholipid metabolic process | 101/3918 | 383/18723 | 5.80e-03 | 3.67e-02 | 101 |
| GO:20012421 | Colorectum | SER | regulation of intrinsic apoptotic signaling pathway | 59/2897 | 164/18723 | 8.42e-11 | 1.20e-08 | 59 |
| GO:00971931 | Colorectum | SER | intrinsic apoptotic signaling pathway | 87/2897 | 288/18723 | 1.67e-10 | 2.32e-08 | 87 |
| GO:20012331 | Colorectum | SER | regulation of apoptotic signaling pathway | 101/2897 | 356/18723 | 3.05e-10 | 4.07e-08 | 101 |
| GO:00066441 | Colorectum | SER | phospholipid metabolic process | 79/2897 | 383/18723 | 3.94e-03 | 3.24e-02 | 79 |
| GO:00971932 | Colorectum | MSS | intrinsic apoptotic signaling pathway | 102/3467 | 288/18723 | 6.06e-12 | 9.82e-10 | 102 |
| GO:20012422 | Colorectum | MSS | regulation of intrinsic apoptotic signaling pathway | 66/3467 | 164/18723 | 6.70e-11 | 7.47e-09 | 66 |
| Page: 1 2 3 4 5 6 7 8 9 |
| Pathway ID | Tissue | Disease Stage | Description | Gene Ratio | Bg Ratio | pvalue | p.adjust | qvalue | Count |
| hsa0407110 | Cervix | CC | Sphingolipid signaling pathway | 35/1267 | 121/8465 | 5.70e-05 | 3.93e-04 | 2.32e-04 | 35 |
| hsa0407113 | Cervix | CC | Sphingolipid signaling pathway | 35/1267 | 121/8465 | 5.70e-05 | 3.93e-04 | 2.32e-04 | 35 |
| hsa04071 | Colorectum | AD | Sphingolipid signaling pathway | 43/2092 | 121/8465 | 4.83e-03 | 2.28e-02 | 1.45e-02 | 43 |
| hsa040711 | Colorectum | AD | Sphingolipid signaling pathway | 43/2092 | 121/8465 | 4.83e-03 | 2.28e-02 | 1.45e-02 | 43 |
| hsa040712 | Colorectum | MSS | Sphingolipid signaling pathway | 40/1875 | 121/8465 | 3.56e-03 | 1.64e-02 | 1.01e-02 | 40 |
| hsa040713 | Colorectum | MSS | Sphingolipid signaling pathway | 40/1875 | 121/8465 | 3.56e-03 | 1.64e-02 | 1.01e-02 | 40 |
| hsa040714 | Colorectum | FAP | Sphingolipid signaling pathway | 34/1404 | 121/8465 | 9.53e-04 | 5.22e-03 | 3.17e-03 | 34 |
| hsa040715 | Colorectum | FAP | Sphingolipid signaling pathway | 34/1404 | 121/8465 | 9.53e-04 | 5.22e-03 | 3.17e-03 | 34 |
| hsa040716 | Colorectum | CRC | Sphingolipid signaling pathway | 30/1091 | 121/8465 | 2.49e-04 | 3.09e-03 | 2.09e-03 | 30 |
| hsa040717 | Colorectum | CRC | Sphingolipid signaling pathway | 30/1091 | 121/8465 | 2.49e-04 | 3.09e-03 | 2.09e-03 | 30 |
| hsa0407116 | Esophagus | ESCC | Sphingolipid signaling pathway | 85/4205 | 121/8465 | 3.04e-06 | 1.73e-05 | 8.84e-06 | 85 |
| hsa006003 | Esophagus | ESCC | Sphingolipid metabolism | 36/4205 | 53/8465 | 5.41e-03 | 1.36e-02 | 6.99e-03 | 36 |
| hsa0407117 | Esophagus | ESCC | Sphingolipid signaling pathway | 85/4205 | 121/8465 | 3.04e-06 | 1.73e-05 | 8.84e-06 | 85 |
| hsa0060012 | Esophagus | ESCC | Sphingolipid metabolism | 36/4205 | 53/8465 | 5.41e-03 | 1.36e-02 | 6.99e-03 | 36 |
| hsa040719 | Lung | IAC | Sphingolipid signaling pathway | 28/1053 | 121/8465 | 7.30e-04 | 6.08e-03 | 4.04e-03 | 28 |
| hsa0407112 | Lung | IAC | Sphingolipid signaling pathway | 28/1053 | 121/8465 | 7.30e-04 | 6.08e-03 | 4.04e-03 | 28 |
| hsa0407121 | Lung | AIS | Sphingolipid signaling pathway | 25/961 | 121/8465 | 2.03e-03 | 1.29e-02 | 8.24e-03 | 25 |
| hsa0407131 | Lung | AIS | Sphingolipid signaling pathway | 25/961 | 121/8465 | 2.03e-03 | 1.29e-02 | 8.24e-03 | 25 |
| hsa0407114 | Oral cavity | OSCC | Sphingolipid signaling pathway | 82/3704 | 121/8465 | 6.97e-08 | 5.08e-07 | 2.58e-07 | 82 |
| hsa006002 | Oral cavity | OSCC | Sphingolipid metabolism | 33/3704 | 53/8465 | 5.00e-03 | 1.20e-02 | 6.13e-03 | 33 |
| Page: 1 2 |
Top |
Cell-cell communication analysis |
| Identification of potential cell-cell interactions between two cell types and their ligand-receptor pairs for different disease states |
| Ligand | Receptor | LRpair | Pathway | Tissue | Disease Stage |
| Page: 1 |
Top |
Single-cell gene regulatory network inference analysis |
| Find out the significant the regulons (TFs) and the target genes of each regulon across cell types for different disease states |
| TF | Cell Type | Tissue | Disease Stage | Target Gene | RSS | Regulon Activity |
| ∗The dot plots of a searched regulon are shown for all cell subpopulations in each disease state of each tissue based on the regulon specific score inferred using pySCENIC and by calculating the average expression. |
| Page: 1 |
Top |
Somatic mutation of malignant transformation related genes |
| Annotation of somatic variants for genes involved in malignant transformation |
| Hugo Symbol | Variant Class | Variant Classification | dbSNP RS | HGVSc | HGVSp | HGVSp Short | SWISSPROT | BIOTYPE | SIFT | PolyPhen | Tumor Sample Barcode | Tissue | Histology | Sex | Age | Stage | Therapy Types | Drugs | Outcome |
| SGMS1 | SNV | Missense_Mutation | c.1179N>A | p.Phe393Leu | p.F393L | protein_coding | tolerated(0.63) | benign(0) | TCGA-A2-A25A-01 | Breast | breast invasive carcinoma | Female | <65 | I/II | Unspecific | Cytoxan | SD | ||
| SGMS1 | SNV | Missense_Mutation | c.499N>T | p.Pro167Ser | p.P167S | protein_coding | deleterious(0) | possibly_damaging(0.616) | TCGA-A8-A08R-01 | Breast | breast invasive carcinoma | Female | <65 | I/II | Unknown | Unknown | SD | ||
| SGMS1 | SNV | Missense_Mutation | rs141885016 | c.461N>T | p.Ser154Leu | p.S154L | protein_coding | tolerated(0.05) | possibly_damaging(0.579) | TCGA-AC-A8OQ-01 | Breast | breast invasive carcinoma | Female | >=65 | I/II | Unknown | Unknown | SD | |
| SGMS1 | SNV | Missense_Mutation | rs753111102 | c.737C>T | p.Pro246Leu | p.P246L | protein_coding | deleterious(0.01) | probably_damaging(0.998) | TCGA-AN-A0AK-01 | Breast | breast invasive carcinoma | Female | >=65 | I/II | Unknown | Unknown | SD | |
| SGMS1 | SNV | Missense_Mutation | novel | c.59N>T | p.Ala20Val | p.A20V | protein_coding | deleterious(0) | benign(0.055) | TCGA-D8-A1JG-01 | Breast | breast invasive carcinoma | Female | <65 | I/II | Chemotherapy | doxorubicin | SD | |
| SGMS1 | SNV | Missense_Mutation | novel | c.476N>A | p.Arg159Gln | p.R159Q | protein_coding | deleterious(0) | probably_damaging(0.995) | TCGA-LL-A441-01 | Breast | breast invasive carcinoma | Female | <65 | I/II | Chemotherapy | taxotere | CR | |
| SGMS1 | SNV | Missense_Mutation | c.189G>A | p.Met63Ile | p.M63I | protein_coding | tolerated(0.22) | benign(0.003) | TCGA-C5-A902-01 | Cervix | cervical & endocervical cancer | Female | <65 | I/II | Chemotherapy | cisplatin | SD | ||
| SGMS1 | SNV | Missense_Mutation | c.1137N>C | p.Lys379Asn | p.K379N | protein_coding | tolerated(0.47) | benign(0.196) | TCGA-EK-A2RA-01 | Cervix | cervical & endocervical cancer | Female | >=65 | I/II | Unknown | Unknown | SD | ||
| SGMS1 | SNV | Missense_Mutation | c.466N>T | p.Val156Phe | p.V156F | protein_coding | deleterious(0) | probably_damaging(0.997) | TCGA-A6-5665-01 | Colorectum | colon adenocarcinoma | Female | >=65 | I/II | Unknown | Unknown | PD | ||
| SGMS1 | SNV | Missense_Mutation | c.645N>G | p.Phe215Leu | p.F215L | protein_coding | tolerated(0.58) | benign(0.007) | TCGA-AA-A010-01 | Colorectum | colon adenocarcinoma | Female | <65 | I/II | Chemotherapy | folinic | CR |
| Page: 1 2 3 4 5 |
Top |
Related drugs of malignant transformation related genes |
| Identification of chemicals and drugs interact with genes involved in malignant transfromation |
| (DGIdb 4.0) |
| Entrez ID | Symbol | Category | Interaction Types | Drug Claim Name | Drug Name | PMIDs |
| 259230 | SGMS1 | ENZYME, KINASE | inhibitor | 252827492 | ||
| 259230 | SGMS1 | ENZYME, KINASE | inhibitor | 375973242 |
| Page: 1 |

Copyright 2023-Present -The University of Texas Health Science Center at Houston |