
|
|||||
|
 | |
| |
| |
| |
| |
| |
|
Gene: RPL13 |
Gene summary for RPL13 |
| Gene information | Species | Human | Gene symbol | RPL13 | Gene ID | 6137 |
| Gene name | ribosomal protein L13 | |
| Gene Alias | BBC1 | |
| Cytomap | 16q24.3 | |
| Gene Type | protein-coding | GO ID | GO:0001501 | UniProtAcc | A8K4C8 |
Top |
Malignant transformation analysis |
| Identification of the aberrant gene expression in precancerous and cancerous lesions by comparing the gene expression of stem-like cells in diseased tissues with normal stem cells |
| Entrez ID | Symbol | Replicates | Species | Organ | Tissue | Adj P-value | Log2FC | Malignancy |
| 6137 | RPL13 | GSM4909281 | Human | Breast | IDC | 6.31e-26 | -1.86e-01 | 0.21 |
| 6137 | RPL13 | GSM4909282 | Human | Breast | IDC | 5.17e-12 | -1.13e-01 | -0.0288 |
| 6137 | RPL13 | GSM4909286 | Human | Breast | IDC | 4.19e-08 | 8.99e-02 | 0.1081 |
| 6137 | RPL13 | GSM4909287 | Human | Breast | IDC | 2.25e-34 | -3.22e-01 | 0.2057 |
| 6137 | RPL13 | GSM4909288 | Human | Breast | IDC | 1.29e-02 | 1.22e-01 | 0.0988 |
| 6137 | RPL13 | GSM4909290 | Human | Breast | IDC | 3.20e-03 | -1.10e-01 | 0.2096 |
| 6137 | RPL13 | GSM4909292 | Human | Breast | IDC | 1.04e-02 | -2.11e-01 | 0.1236 |
| 6137 | RPL13 | GSM4909293 | Human | Breast | IDC | 8.27e-42 | -1.94e-01 | 0.1581 |
| 6137 | RPL13 | GSM4909297 | Human | Breast | IDC | 6.55e-42 | -3.38e-01 | 0.1517 |
| 6137 | RPL13 | GSM4909298 | Human | Breast | IDC | 7.89e-31 | -1.67e-01 | 0.1551 |
| 6137 | RPL13 | GSM4909302 | Human | Breast | IDC | 1.33e-04 | -1.26e-01 | 0.1545 |
| 6137 | RPL13 | GSM4909303 | Human | Breast | IDC | 3.42e-04 | -2.21e-01 | 0.0438 |
| 6137 | RPL13 | GSM4909306 | Human | Breast | IDC | 7.74e-32 | -2.21e-01 | 0.1564 |
| 6137 | RPL13 | GSM4909308 | Human | Breast | IDC | 2.96e-07 | -1.22e-01 | 0.158 |
| 6137 | RPL13 | GSM4909311 | Human | Breast | IDC | 2.49e-10 | -1.73e-01 | 0.1534 |
| 6137 | RPL13 | GSM4909312 | Human | Breast | IDC | 7.35e-13 | -1.30e-01 | 0.1552 |
| 6137 | RPL13 | GSM4909313 | Human | Breast | IDC | 7.59e-03 | -1.31e-01 | 0.0391 |
| 6137 | RPL13 | GSM4909315 | Human | Breast | IDC | 2.55e-11 | -1.40e-01 | 0.21 |
| 6137 | RPL13 | GSM4909317 | Human | Breast | IDC | 1.37e-13 | -1.87e-01 | 0.1355 |
| 6137 | RPL13 | GSM4909319 | Human | Breast | IDC | 1.35e-61 | -6.53e-01 | 0.1563 |
| Page: 1 2 3 4 5 6 7 8 9 10 11 12 13 14 15 16 17 18 19 20 |
| Tissue | Expression Dynamics | Abbreviation |
| Breast | 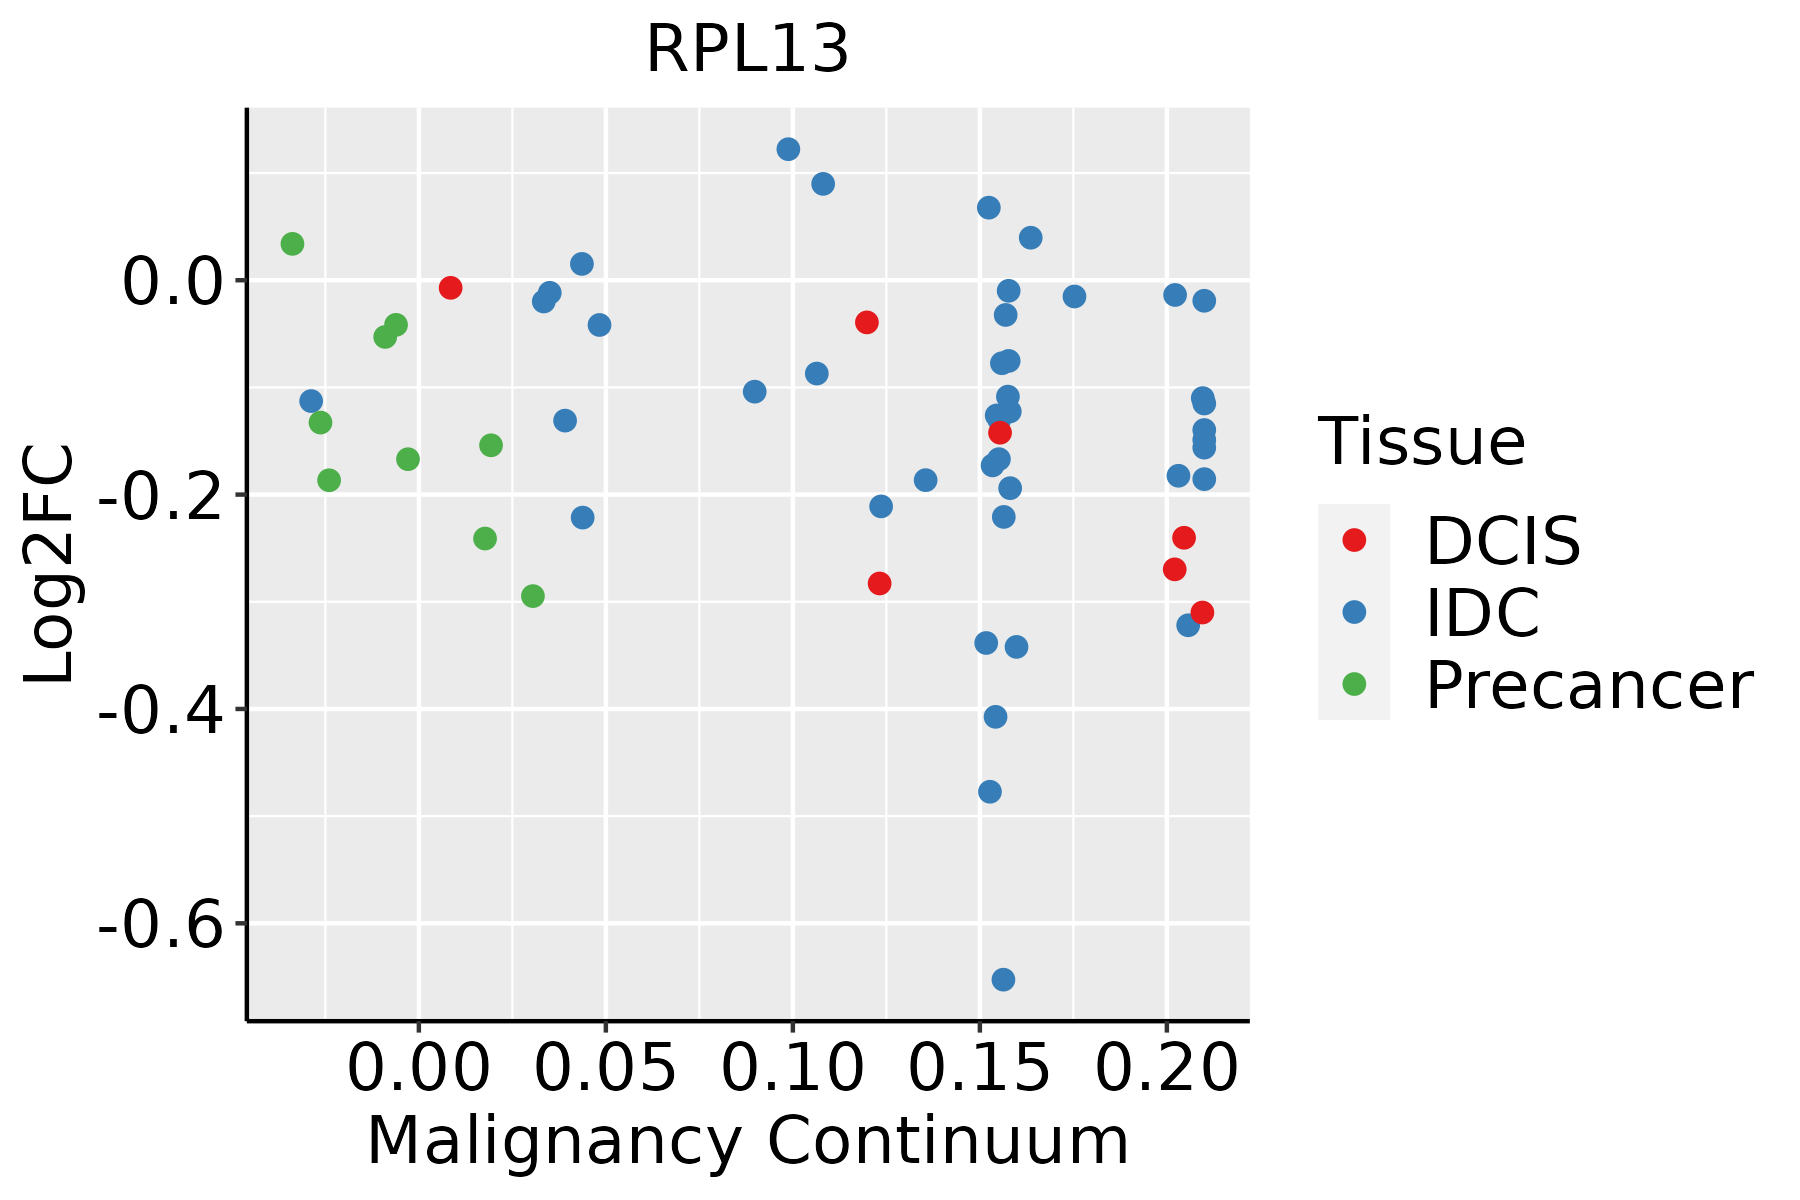 | IDC: Invasive ductal carcinoma |
| DCIS: Ductal carcinoma in situ | ||
| Precancer(BRCA1-mut): Precancerous lesion from BRCA1 mutation carriers | ||
| Cervix |  | CC: Cervix cancer |
| HSIL_HPV: HPV-infected high-grade squamous intraepithelial lesions | ||
| N_HPV: HPV-infected normal cervix | ||
| Colorectum (GSE201348) |  | FAP: Familial adenomatous polyposis |
| CRC: Colorectal cancer | ||
| Colorectum (HTA11) |  | AD: Adenomas |
| SER: Sessile serrated lesions | ||
| MSI-H: Microsatellite-high colorectal cancer | ||
| MSS: Microsatellite stable colorectal cancer | ||
| Endometrium | 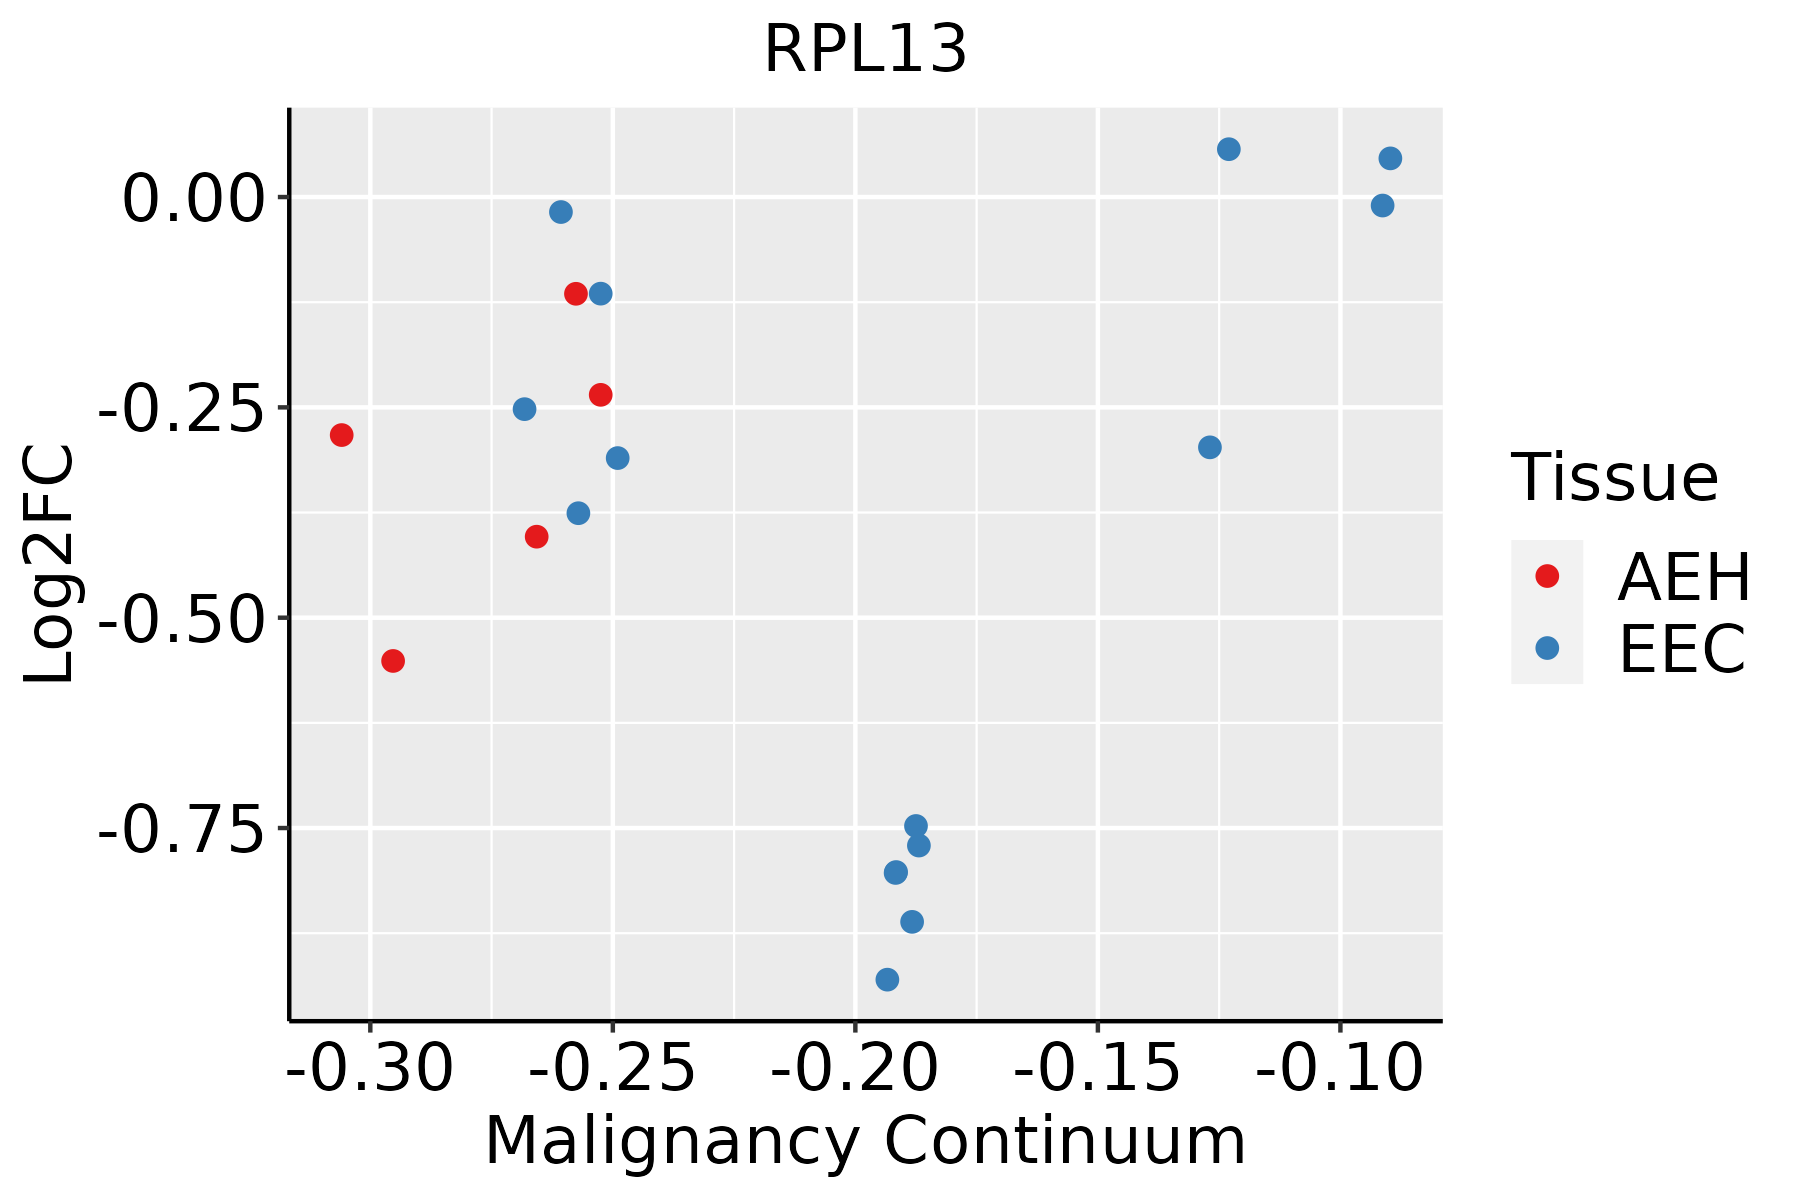 | AEH: Atypical endometrial hyperplasia |
| EEC: Endometrioid Cancer | ||
| Esophagus | 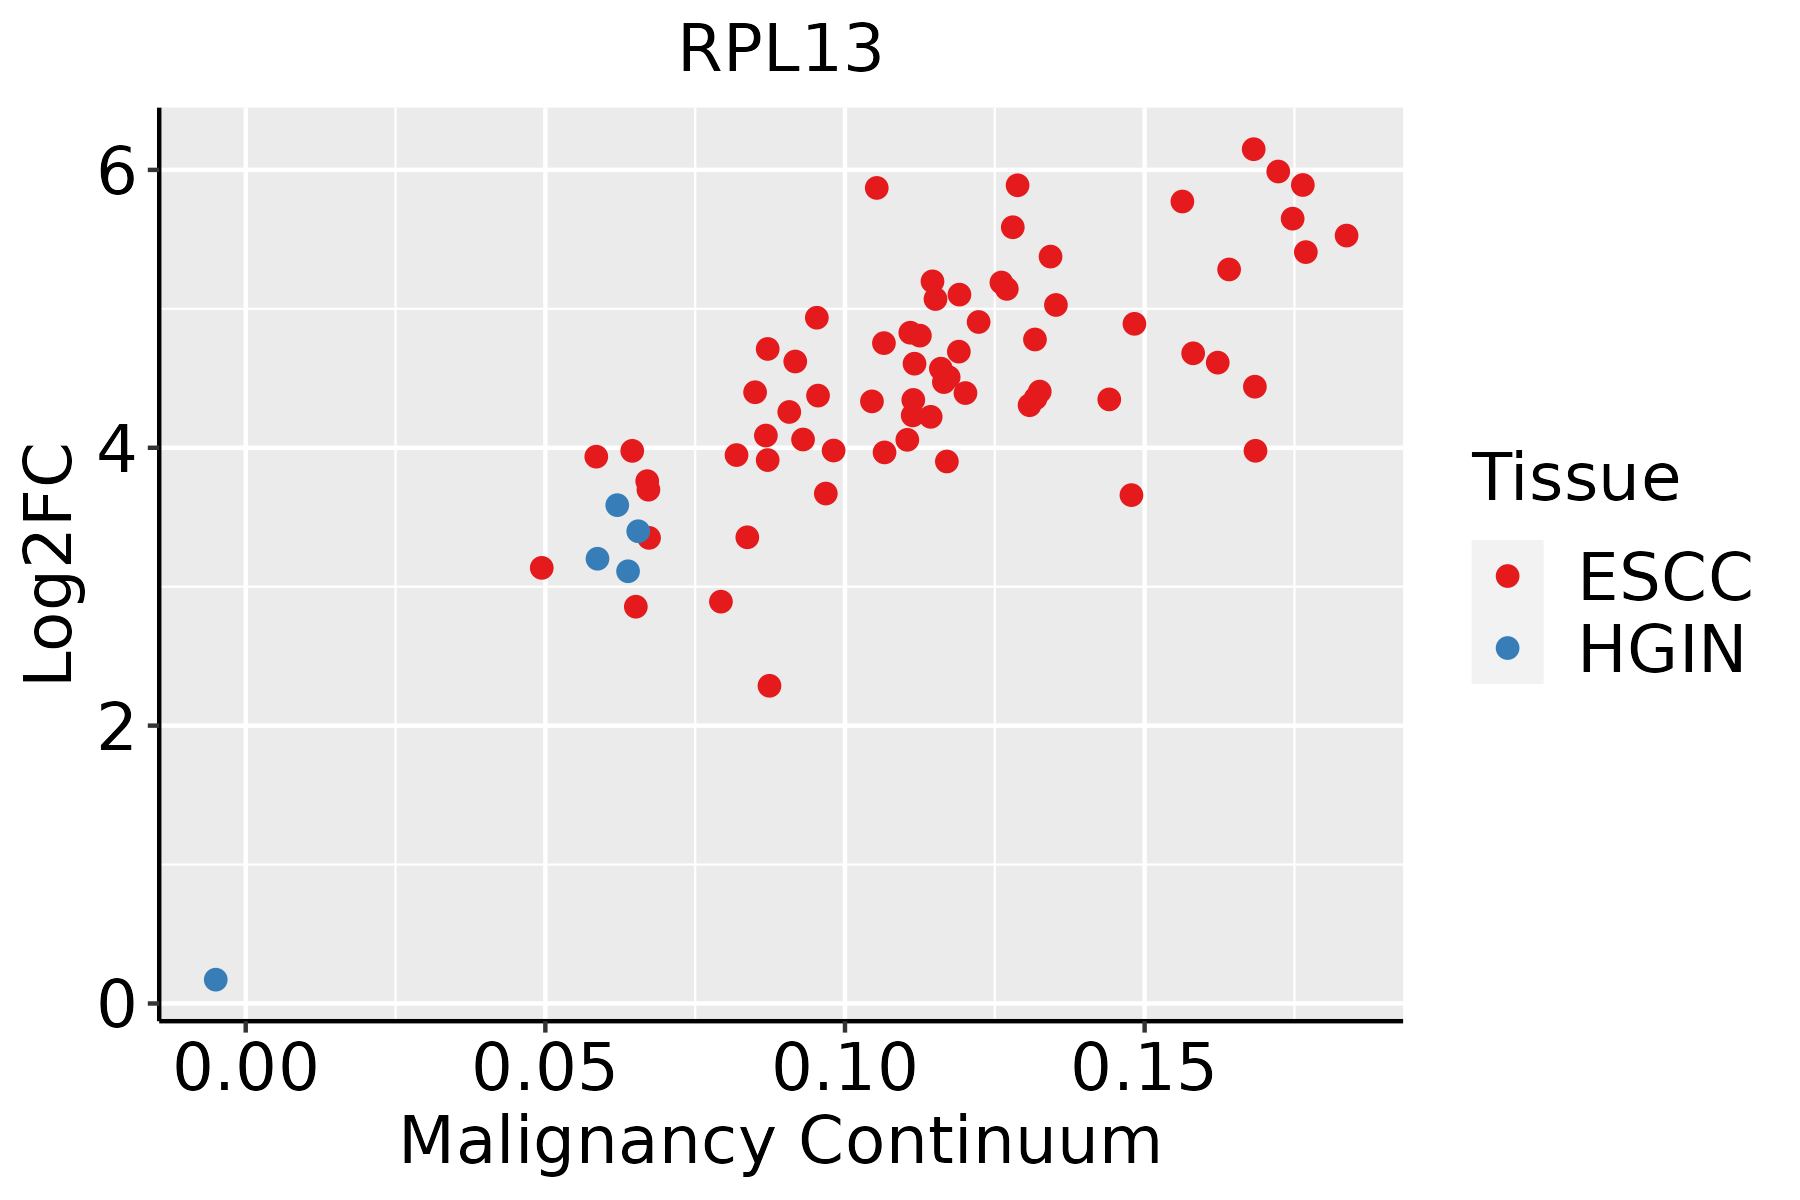 | ESCC: Esophageal squamous cell carcinoma |
| HGIN: High-grade intraepithelial neoplasias | ||
| LGIN: Low-grade intraepithelial neoplasias | ||
| GC |  | CAG: Chronic atrophic gastritis |
| CAG with IM: Chronic atrophic gastritis with intestinal metaplasia | ||
| CSG: Chronic superficial gastritis | ||
| GC: Gastric cancer | ||
| SIM: Severe intestinal metaplasia | ||
| WIM: Wild intestinal metaplasia | ||
| Liver | 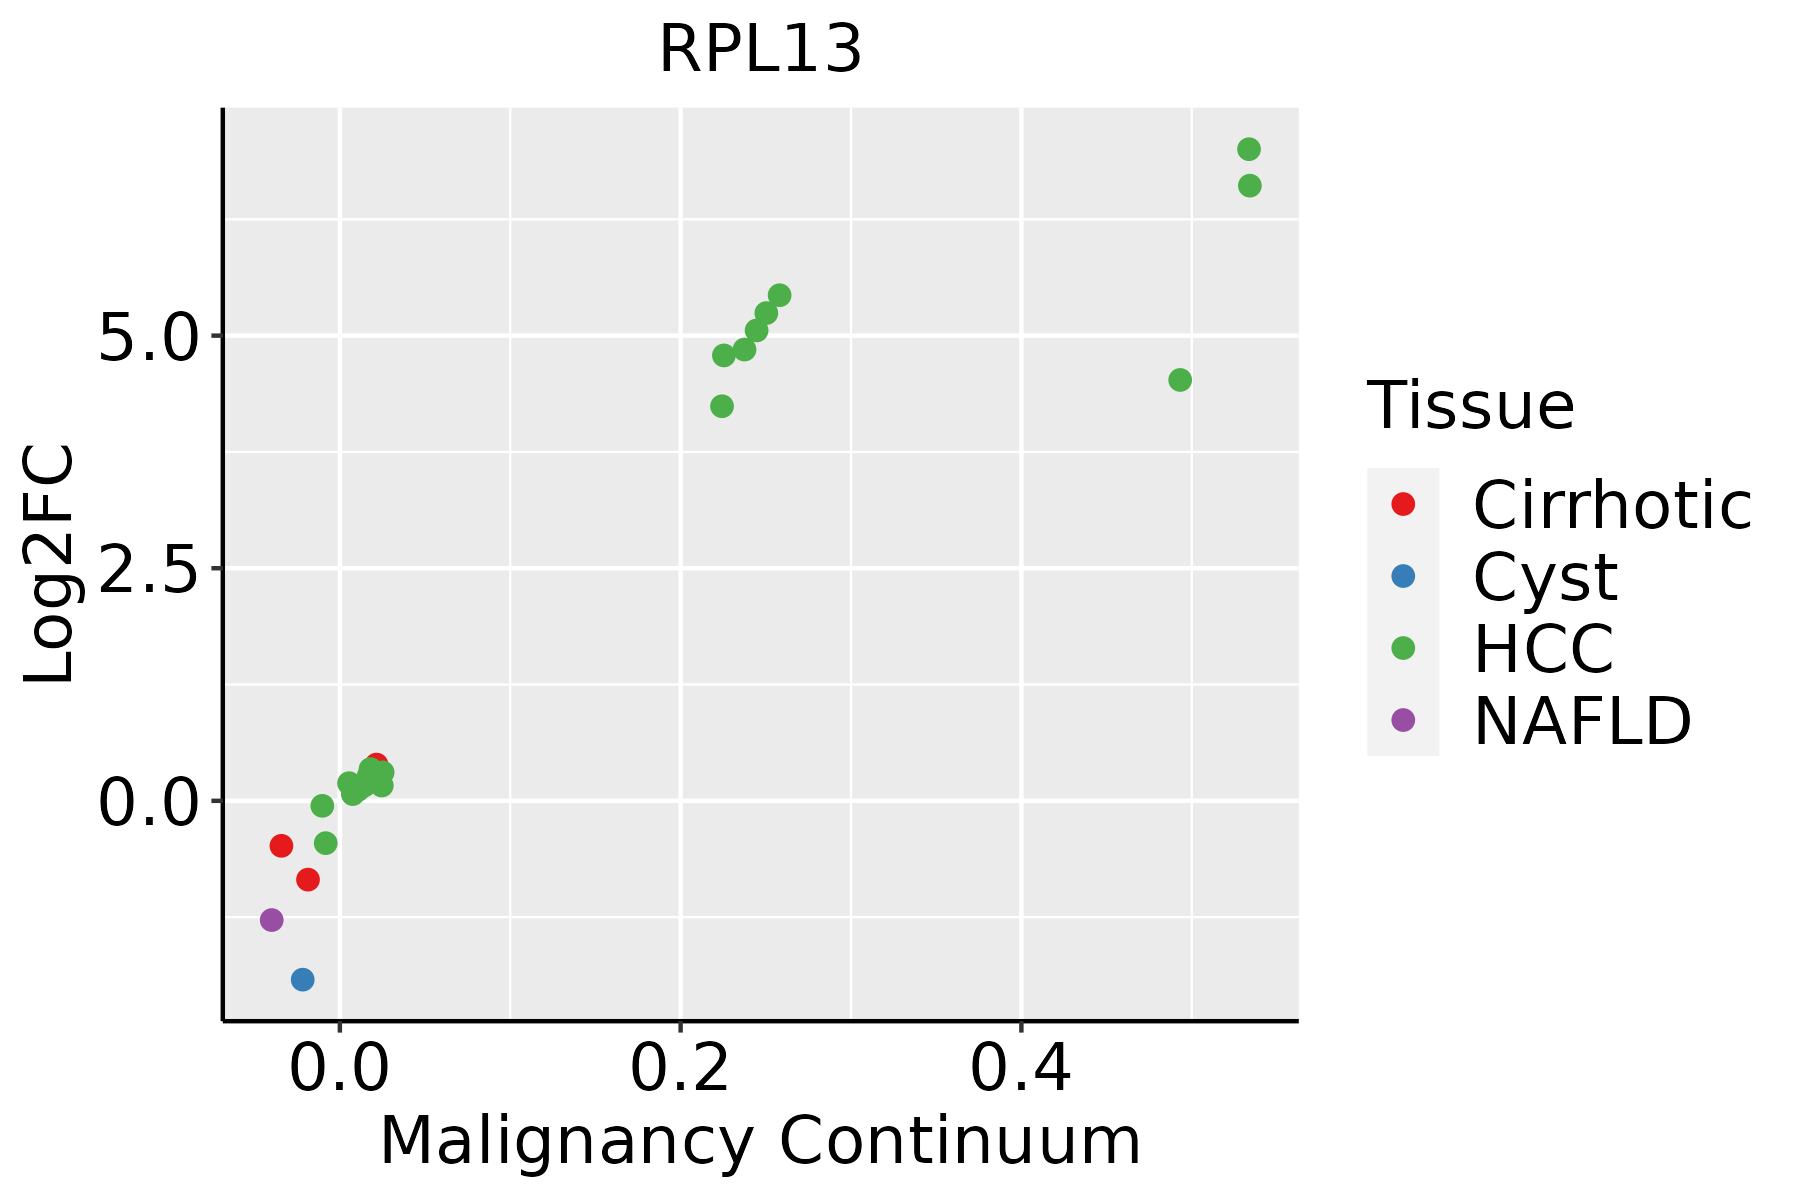 | HCC: Hepatocellular carcinoma |
| NAFLD: Non-alcoholic fatty liver disease | ||
| Lung |  | AAH: Atypical adenomatous hyperplasia |
| AIS: Adenocarcinoma in situ | ||
| IAC: Invasive lung adenocarcinoma | ||
| MIA: Minimally invasive adenocarcinoma | ||
| Oral Cavity | 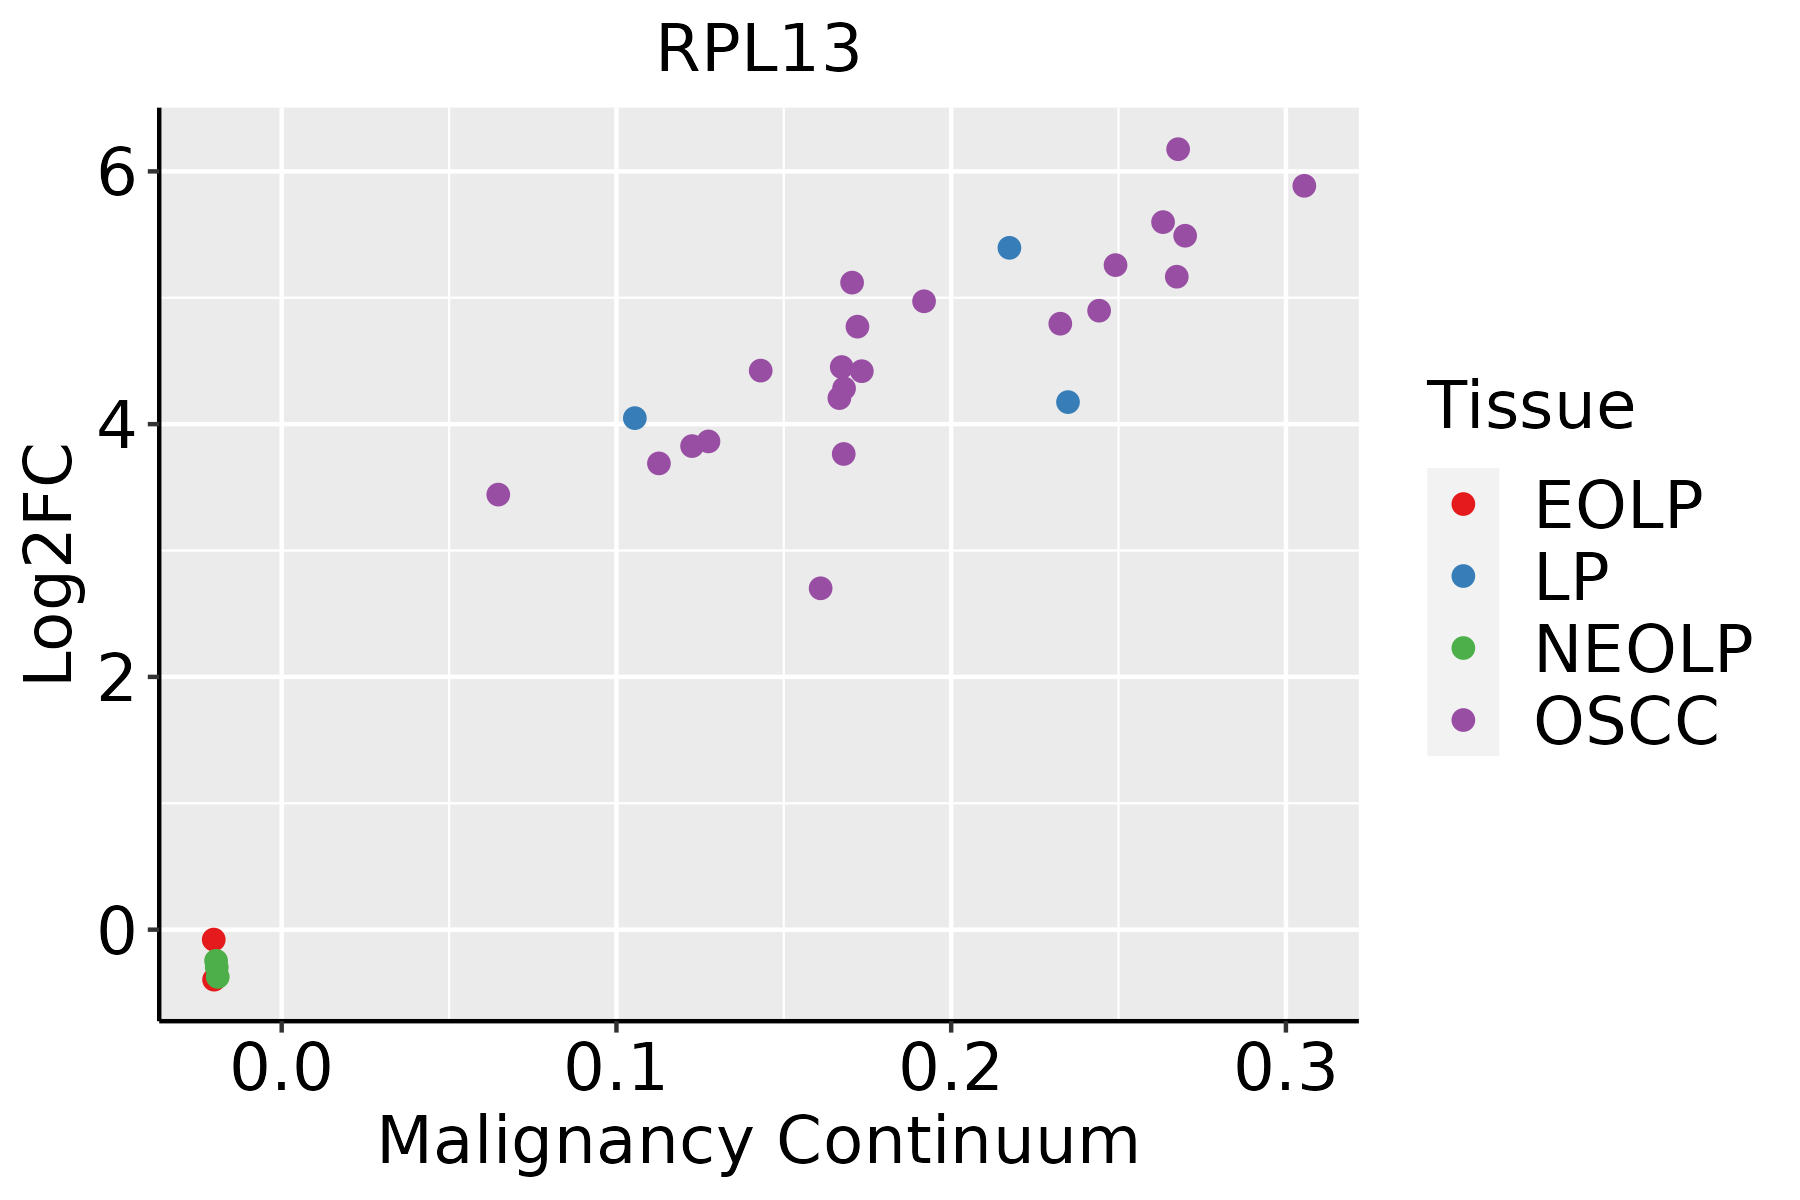 | EOLP: Erosive Oral lichen planus |
| LP: leukoplakia | ||
| NEOLP: Non-erosive oral lichen planus | ||
| OSCC: Oral squamous cell carcinoma | ||
| Prostate | 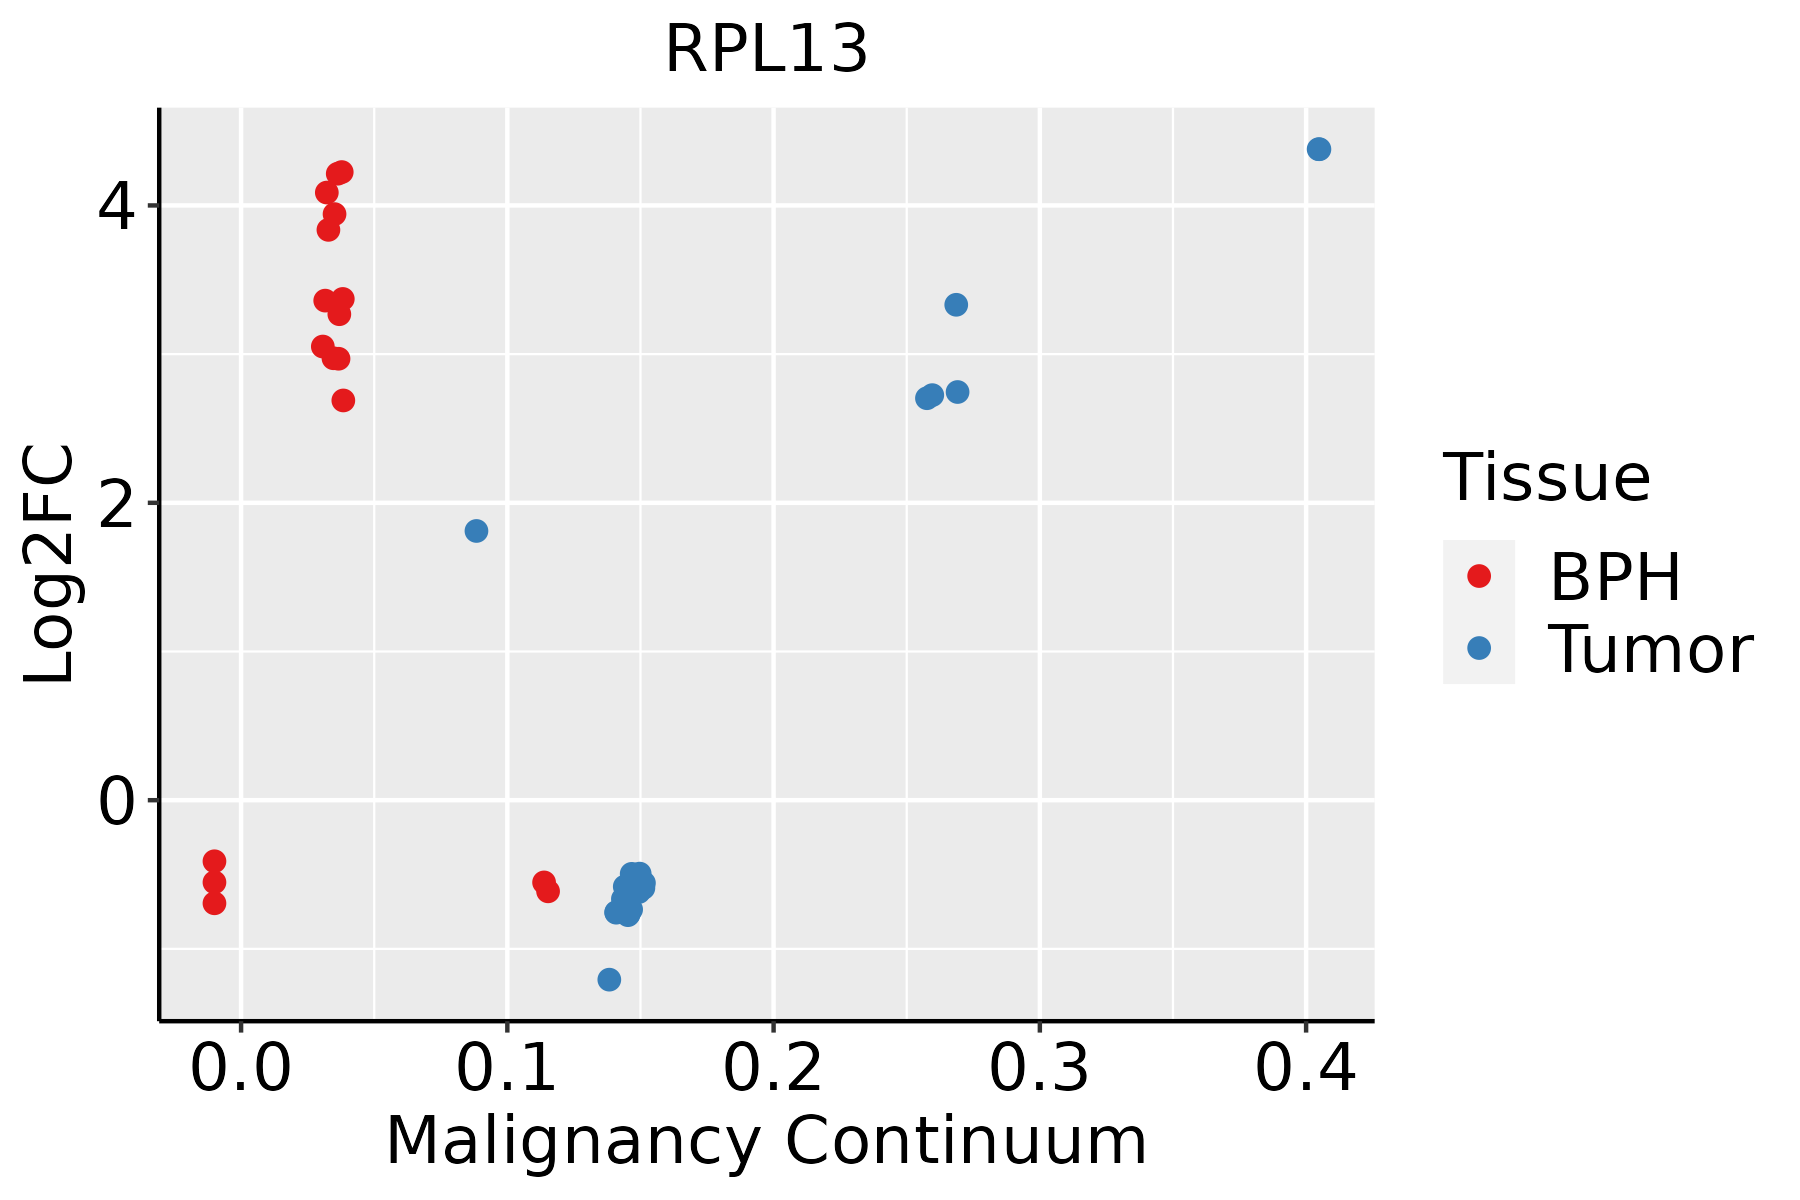 | BPH: Benign Prostatic Hyperplasia |
| Skin | 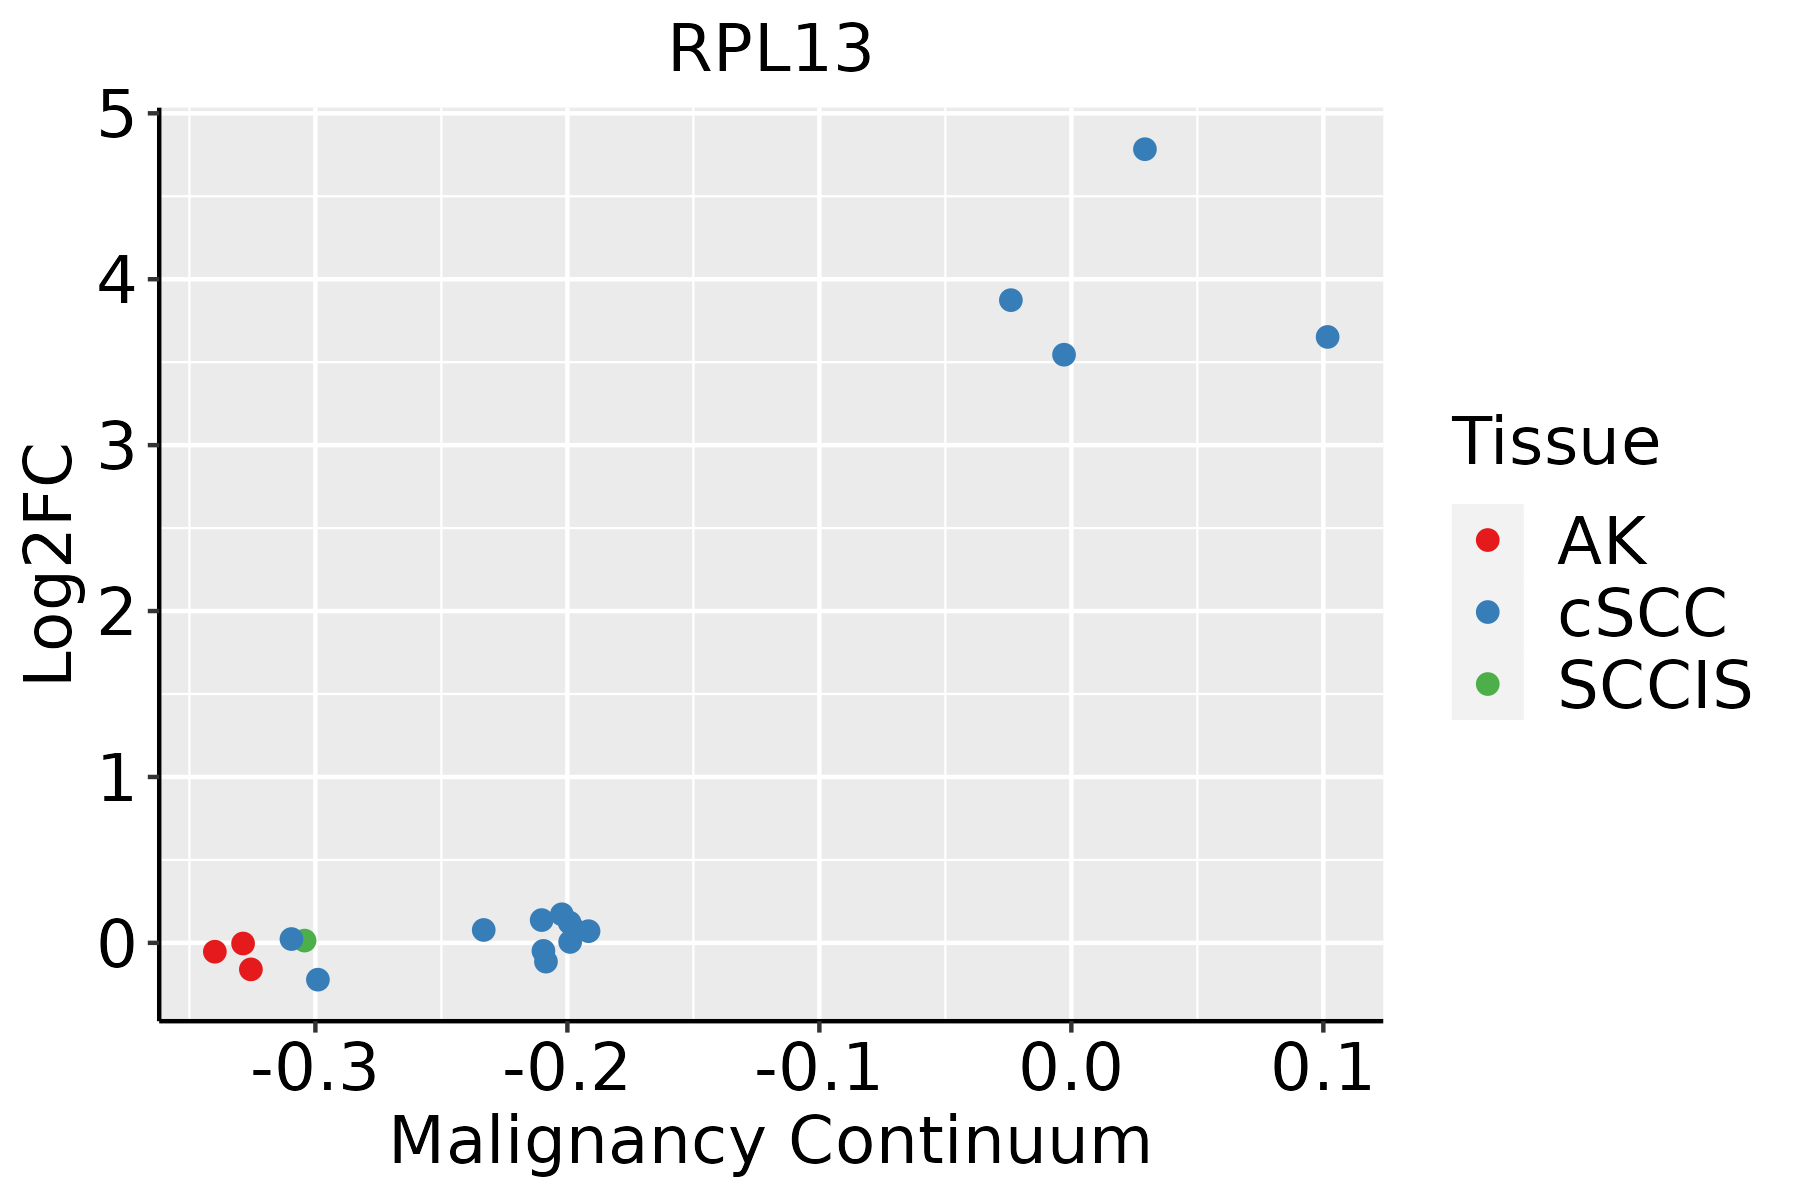 | AK: Actinic keratosis |
| cSCC: Cutaneous squamous cell carcinoma | ||
| SCCIS:squamous cell carcinoma in situ | ||
| Thyroid | 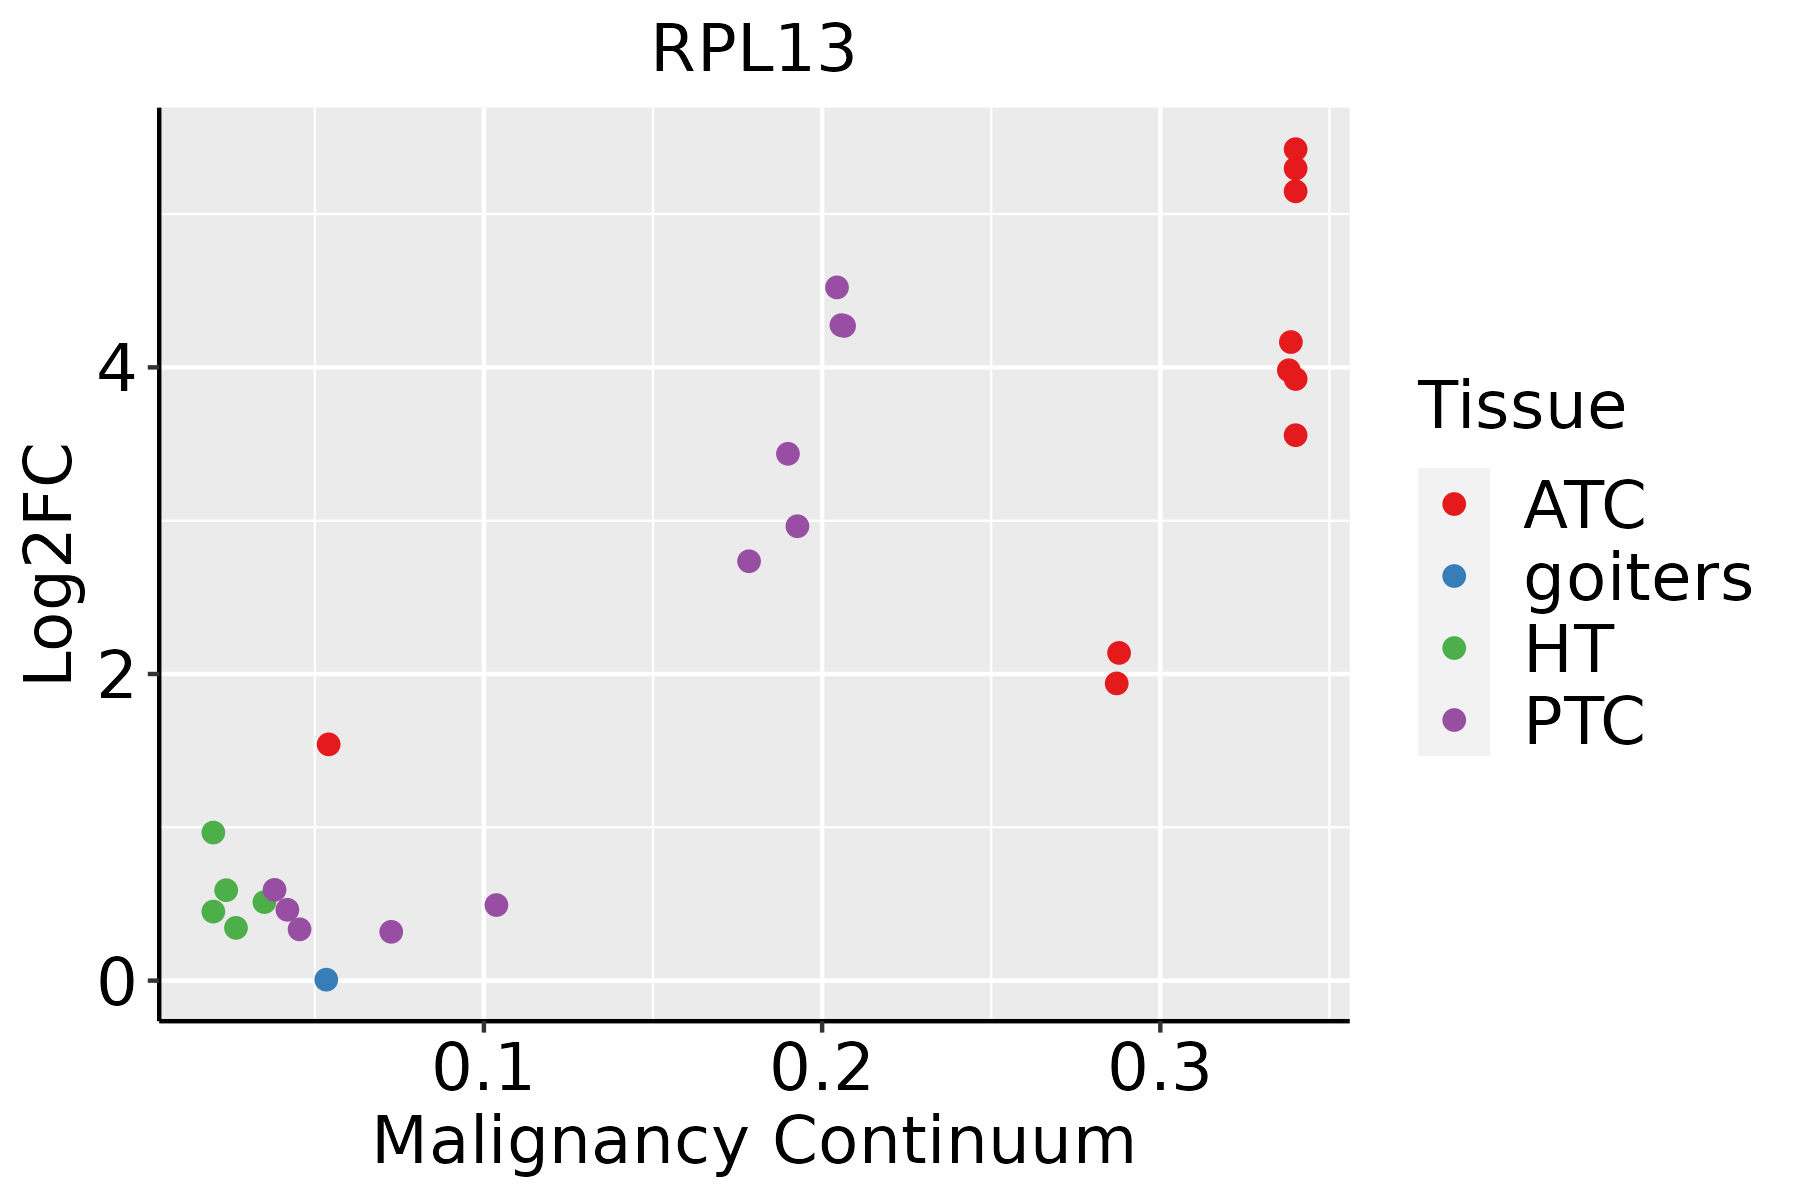 | ATC: Anaplastic thyroid cancer |
| HT: Hashimoto's thyroiditis | ||
| PTC: Papillary thyroid cancer |
| ∗log2FC in expression of this searched gene in stem-like cells from each diseased tissue sample relative to stem-like cells in normal samples in each tissue plotted against the malignancy continuum. Samples are colored based on if they are from different disease stage. |
Top |
Malignant transformation related pathway analysis |
| Find out the enriched GO biological processes and KEGG pathways involved in transition from healthy to precancer to cancer |
| Tissue | Disease Stage | Enriched GO biological Processes |
| Esophagus | ESCC |  |
| Skin | AK |  |
| Skin | SCCIS |  |
| Skin | cSCC |  |
| Thyroid | HT |  |
| ∗Top 15 enriched GO BP terms are showed in the bar plot of each disease state in each tissue. Each row represents a significant GO biological process which is colored according to the -log10(p.adjust). |
| Page: 1 2 3 4 5 6 7 8 9 |
| GO ID | Tissue | Disease Stage | Description | Gene Ratio | Bg Ratio | pvalue | p.adjust | Count |
| GO:00021819 | Breast | Precancer | cytoplasmic translation | 80/1080 | 148/18723 | 1.59e-59 | 8.54e-56 | 80 |
| GO:00226139 | Breast | Precancer | ribonucleoprotein complex biogenesis | 79/1080 | 463/18723 | 2.11e-18 | 1.03e-15 | 79 |
| GO:00718269 | Breast | Precancer | ribonucleoprotein complex subunit organization | 48/1080 | 227/18723 | 2.68e-15 | 8.45e-13 | 48 |
| GO:00226189 | Breast | Precancer | ribonucleoprotein complex assembly | 47/1080 | 220/18723 | 3.47e-15 | 1.03e-12 | 47 |
| GO:00064138 | Breast | Precancer | translational initiation | 30/1080 | 118/18723 | 3.23e-12 | 5.58e-10 | 30 |
| GO:00064179 | Breast | Precancer | regulation of translation | 67/1080 | 468/18723 | 4.71e-12 | 7.64e-10 | 67 |
| GO:00064466 | Breast | Precancer | regulation of translational initiation | 19/1080 | 79/18723 | 7.99e-08 | 4.60e-06 | 19 |
| GO:00432549 | Breast | Precancer | regulation of protein-containing complex assembly | 50/1080 | 428/18723 | 1.63e-06 | 5.97e-05 | 50 |
| GO:00021838 | Breast | Precancer | cytoplasmic translational initiation | 11/1080 | 34/18723 | 1.87e-06 | 6.63e-05 | 11 |
| GO:00313338 | Breast | Precancer | negative regulation of protein-containing complex assembly | 18/1080 | 141/18723 | 1.27e-03 | 1.35e-02 | 18 |
| GO:00017017 | Breast | Precancer | in utero embryonic development | 35/1080 | 367/18723 | 2.47e-03 | 2.27e-02 | 35 |
| GO:000218114 | Breast | IDC | cytoplasmic translation | 82/1434 | 148/18723 | 2.60e-52 | 1.48e-48 | 82 |
| GO:002261314 | Breast | IDC | ribonucleoprotein complex biogenesis | 83/1434 | 463/18723 | 2.01e-13 | 5.20e-11 | 83 |
| GO:007182614 | Breast | IDC | ribonucleoprotein complex subunit organization | 52/1434 | 227/18723 | 5.18e-13 | 1.21e-10 | 52 |
| GO:002261814 | Breast | IDC | ribonucleoprotein complex assembly | 51/1434 | 220/18723 | 5.32e-13 | 1.21e-10 | 51 |
| GO:000641313 | Breast | IDC | translational initiation | 31/1434 | 118/18723 | 7.29e-10 | 7.52e-08 | 31 |
| GO:000641714 | Breast | IDC | regulation of translation | 74/1434 | 468/18723 | 1.67e-09 | 1.53e-07 | 74 |
| GO:000644613 | Breast | IDC | regulation of translational initiation | 20/1434 | 79/18723 | 1.40e-06 | 6.00e-05 | 20 |
| GO:004325414 | Breast | IDC | regulation of protein-containing complex assembly | 61/1434 | 428/18723 | 1.77e-06 | 7.31e-05 | 61 |
| GO:000218313 | Breast | IDC | cytoplasmic translational initiation | 12/1434 | 34/18723 | 4.35e-06 | 1.53e-04 | 12 |
| Page: 1 2 3 4 5 6 7 8 9 10 11 12 13 14 15 16 17 18 19 20 21 22 23 24 25 |
| Pathway ID | Tissue | Disease Stage | Description | Gene Ratio | Bg Ratio | pvalue | p.adjust | qvalue | Count |
| hsa0301018 | Breast | Precancer | Ribosome | 80/684 | 167/8465 | 7.33e-44 | 2.32e-41 | 1.77e-41 | 80 |
| hsa0517118 | Breast | Precancer | Coronavirus disease - COVID-19 | 81/684 | 232/8465 | 3.74e-32 | 2.36e-30 | 1.81e-30 | 81 |
| hsa0301019 | Breast | Precancer | Ribosome | 80/684 | 167/8465 | 7.33e-44 | 2.32e-41 | 1.77e-41 | 80 |
| hsa0517119 | Breast | Precancer | Coronavirus disease - COVID-19 | 81/684 | 232/8465 | 3.74e-32 | 2.36e-30 | 1.81e-30 | 81 |
| hsa0301024 | Breast | IDC | Ribosome | 83/867 | 167/8465 | 6.07e-39 | 9.87e-37 | 7.38e-37 | 83 |
| hsa0517124 | Breast | IDC | Coronavirus disease - COVID-19 | 86/867 | 232/8465 | 1.50e-28 | 9.72e-27 | 7.27e-27 | 86 |
| hsa0301034 | Breast | IDC | Ribosome | 83/867 | 167/8465 | 6.07e-39 | 9.87e-37 | 7.38e-37 | 83 |
| hsa0517134 | Breast | IDC | Coronavirus disease - COVID-19 | 86/867 | 232/8465 | 1.50e-28 | 9.72e-27 | 7.27e-27 | 86 |
| hsa0301044 | Breast | DCIS | Ribosome | 82/846 | 167/8465 | 8.69e-39 | 1.40e-36 | 1.03e-36 | 82 |
| hsa0517144 | Breast | DCIS | Coronavirus disease - COVID-19 | 86/846 | 232/8465 | 2.42e-29 | 1.56e-27 | 1.15e-27 | 86 |
| hsa0301054 | Breast | DCIS | Ribosome | 82/846 | 167/8465 | 8.69e-39 | 1.40e-36 | 1.03e-36 | 82 |
| hsa0517154 | Breast | DCIS | Coronavirus disease - COVID-19 | 86/846 | 232/8465 | 2.42e-29 | 1.56e-27 | 1.15e-27 | 86 |
| hsa0517120 | Cervix | CC | Coronavirus disease - COVID-19 | 111/1267 | 232/8465 | 1.82e-33 | 5.90e-31 | 3.49e-31 | 111 |
| hsa0301020 | Cervix | CC | Ribosome | 85/1267 | 167/8465 | 3.17e-28 | 5.14e-26 | 3.04e-26 | 85 |
| hsa05171110 | Cervix | CC | Coronavirus disease - COVID-19 | 111/1267 | 232/8465 | 1.82e-33 | 5.90e-31 | 3.49e-31 | 111 |
| hsa03010110 | Cervix | CC | Ribosome | 85/1267 | 167/8465 | 3.17e-28 | 5.14e-26 | 3.04e-26 | 85 |
| hsa0301025 | Cervix | HSIL_HPV | Ribosome | 80/459 | 167/8465 | 9.61e-58 | 2.82e-55 | 2.28e-55 | 80 |
| hsa0517125 | Cervix | HSIL_HPV | Coronavirus disease - COVID-19 | 91/459 | 232/8465 | 2.14e-56 | 3.13e-54 | 2.53e-54 | 91 |
| hsa0301035 | Cervix | HSIL_HPV | Ribosome | 80/459 | 167/8465 | 9.61e-58 | 2.82e-55 | 2.28e-55 | 80 |
| hsa0517135 | Cervix | HSIL_HPV | Coronavirus disease - COVID-19 | 91/459 | 232/8465 | 2.14e-56 | 3.13e-54 | 2.53e-54 | 91 |
| Page: 1 2 3 4 5 6 7 |
Top |
Cell-cell communication analysis |
| Identification of potential cell-cell interactions between two cell types and their ligand-receptor pairs for different disease states |
| Ligand | Receptor | LRpair | Pathway | Tissue | Disease Stage |
| Page: 1 |
Top |
Single-cell gene regulatory network inference analysis |
| Find out the significant the regulons (TFs) and the target genes of each regulon across cell types for different disease states |
| TF | Cell Type | Tissue | Disease Stage | Target Gene | RSS | Regulon Activity |
| ∗The dot plots of a searched regulon are shown for all cell subpopulations in each disease state of each tissue based on the regulon specific score inferred using pySCENIC and by calculating the average expression. |
| Page: 1 |
Top |
Somatic mutation of malignant transformation related genes |
| Annotation of somatic variants for genes involved in malignant transformation |
| Hugo Symbol | Variant Class | Variant Classification | dbSNP RS | HGVSc | HGVSp | HGVSp Short | SWISSPROT | BIOTYPE | SIFT | PolyPhen | Tumor Sample Barcode | Tissue | Histology | Sex | Age | Stage | Therapy Types | Drugs | Outcome |
| RPL13 | SNV | Missense_Mutation | novel | c.605C>T | p.Ala202Val | p.A202V | P26373 | protein_coding | deleterious(0.02) | possibly_damaging(0.521) | TCGA-A8-A06Z-01 | Breast | breast invasive carcinoma | Female | >=65 | I/II | Unknown | Unknown | SD |
| RPL13 | SNV | Missense_Mutation | c.419C>T | p.Ser140Phe | p.S140F | P26373 | protein_coding | deleterious(0) | possibly_damaging(0.858) | TCGA-2W-A8YY-01 | Cervix | cervical & endocervical cancer | Female | <65 | I/II | Chemotherapy | cisplatin | CR | |
| RPL13 | SNV | Missense_Mutation | c.298C>A | p.Pro100Thr | p.P100T | P26373 | protein_coding | tolerated(0.35) | benign(0.03) | TCGA-G4-6588-01 | Colorectum | colon adenocarcinoma | Female | <65 | I/II | Unknown | Unknown | SD | |
| RPL13 | SNV | Missense_Mutation | rs772105032 | c.583C>T | p.Arg195Trp | p.R195W | P26373 | protein_coding | deleterious(0) | benign(0.025) | TCGA-AJ-A3BG-01 | Endometrium | uterine corpus endometrioid carcinoma | Female | >=65 | I/II | Chemotherapy | carboplatin | PD |
| RPL13 | SNV | Missense_Mutation | novel | c.586N>A | p.Ala196Thr | p.A196T | P26373 | protein_coding | tolerated(0.24) | benign(0.254) | TCGA-B5-A3FA-01 | Endometrium | uterine corpus endometrioid carcinoma | Female | >=65 | I/II | Unknown | Unknown | SD |
| RPL13 | SNV | Missense_Mutation | c.290C>A | p.Ser97Tyr | p.S97Y | P26373 | protein_coding | deleterious(0) | probably_damaging(0.926) | TCGA-BS-A0UF-01 | Endometrium | uterine corpus endometrioid carcinoma | Female | >=65 | I/II | Unknown | Unknown | SD | |
| RPL13 | SNV | Missense_Mutation | rs140485395 | c.427G>A | p.Glu143Lys | p.E143K | P26373 | protein_coding | deleterious(0.02) | possibly_damaging(0.897) | TCGA-18-3415-01 | Lung | lung squamous cell carcinoma | Male | >=65 | I/II | Chemotherapy | navelbine | CR |
| RPL13 | SNV | Missense_Mutation | novel | c.466N>T | p.Pro156Ser | p.P156S | P26373 | protein_coding | deleterious(0.02) | probably_damaging(0.994) | TCGA-56-8624-01 | Lung | lung squamous cell carcinoma | Male | >=65 | I/II | Chemotherapy | carboplatin | CR |
| RPL13 | SNV | Missense_Mutation | novel | c.469N>A | p.Val157Ile | p.V157I | P26373 | protein_coding | tolerated(1) | benign(0) | TCGA-68-7757-01 | Lung | lung squamous cell carcinoma | Male | >=65 | I/II | Unknown | Unknown | SD |
| Page: 1 |
Top |
Related drugs of malignant transformation related genes |
| Identification of chemicals and drugs interact with genes involved in malignant transfromation |
| (DGIdb 4.0) |
| Entrez ID | Symbol | Category | Interaction Types | Drug Claim Name | Drug Name | PMIDs |
| 6137 | RPL13 | NA | docetaxel | DOCETAXEL | 20038957 | |
| 6137 | RPL13 | NA | thalidomide | THALIDOMIDE | 20038957 |
| Page: 1 |

Copyright 2023-Present -The University of Texas Health Science Center at Houston |