
|
|||||
|
 | |
| |
| |
| |
| |
| |
|
Gene: PEDS1 |
Gene summary for PEDS1 |
| Gene information | Species | Human | Gene symbol | PEDS1 | Gene ID | 387521 |
| Gene name | plasmanylethanolamine desaturase 1 | |
| Gene Alias | CarF | |
| Cytomap | 20q13.13 | |
| Gene Type | protein-coding | GO ID | GO:0006082 | UniProtAcc | A5PLL7 |
Top |
Malignant transformation analysis |
| Identification of the aberrant gene expression in precancerous and cancerous lesions by comparing the gene expression of stem-like cells in diseased tissues with normal stem cells |
| Entrez ID | Symbol | Replicates | Species | Organ | Tissue | Adj P-value | Log2FC | Malignancy |
| 387521 | PEDS1 | HTA11_2487_2000001011 | Human | Colorectum | SER | 1.03e-09 | 3.40e-01 | -0.1808 |
| 387521 | PEDS1 | HTA11_2951_2000001011 | Human | Colorectum | AD | 3.40e-02 | 1.93e-01 | 0.0216 |
| 387521 | PEDS1 | HTA11_1938_2000001011 | Human | Colorectum | AD | 7.73e-09 | 3.30e-01 | -0.0811 |
| 387521 | PEDS1 | HTA11_78_2000001011 | Human | Colorectum | AD | 8.26e-09 | 2.34e-01 | -0.1088 |
| 387521 | PEDS1 | HTA11_347_2000001011 | Human | Colorectum | AD | 2.61e-17 | 3.08e-01 | -0.1954 |
| 387521 | PEDS1 | HTA11_411_2000001011 | Human | Colorectum | SER | 1.20e-07 | 5.69e-01 | -0.2602 |
| 387521 | PEDS1 | HTA11_2112_2000001011 | Human | Colorectum | SER | 6.90e-09 | 5.07e-01 | -0.2196 |
| 387521 | PEDS1 | HTA11_3361_2000001011 | Human | Colorectum | AD | 7.91e-05 | 2.24e-01 | -0.1207 |
| 387521 | PEDS1 | HTA11_83_2000001011 | Human | Colorectum | SER | 2.92e-07 | 2.84e-01 | -0.1526 |
| 387521 | PEDS1 | HTA11_696_2000001011 | Human | Colorectum | AD | 6.35e-15 | 3.19e-01 | -0.1464 |
| 387521 | PEDS1 | HTA11_866_2000001011 | Human | Colorectum | AD | 9.32e-10 | 2.01e-01 | -0.1001 |
| 387521 | PEDS1 | HTA11_1391_2000001011 | Human | Colorectum | AD | 1.17e-15 | 4.10e-01 | -0.059 |
| 387521 | PEDS1 | HTA11_5212_2000001011 | Human | Colorectum | AD | 3.97e-04 | 2.15e-01 | -0.2061 |
| 387521 | PEDS1 | HTA11_5216_2000001011 | Human | Colorectum | SER | 3.40e-03 | 2.80e-01 | -0.1462 |
| 387521 | PEDS1 | HTA11_546_2000001011 | Human | Colorectum | AD | 4.83e-05 | 2.15e-01 | -0.0842 |
| 387521 | PEDS1 | HTA11_866_3004761011 | Human | Colorectum | AD | 1.15e-09 | 2.39e-01 | 0.096 |
| 387521 | PEDS1 | HTA11_8622_2000001021 | Human | Colorectum | SER | 3.19e-02 | 1.83e-01 | 0.0528 |
| 387521 | PEDS1 | HTA11_7663_2000001011 | Human | Colorectum | SER | 7.26e-05 | 2.58e-01 | 0.0131 |
| 387521 | PEDS1 | HTA11_10623_2000001011 | Human | Colorectum | AD | 1.79e-09 | 3.53e-01 | -0.0177 |
| 387521 | PEDS1 | HTA11_6801_2000001011 | Human | Colorectum | SER | 2.21e-02 | 2.38e-01 | 0.0171 |
| Page: 1 2 |
| Tissue | Expression Dynamics | Abbreviation |
| Colorectum (GSE201348) |  | FAP: Familial adenomatous polyposis |
| CRC: Colorectal cancer | ||
| Colorectum (HTA11) | 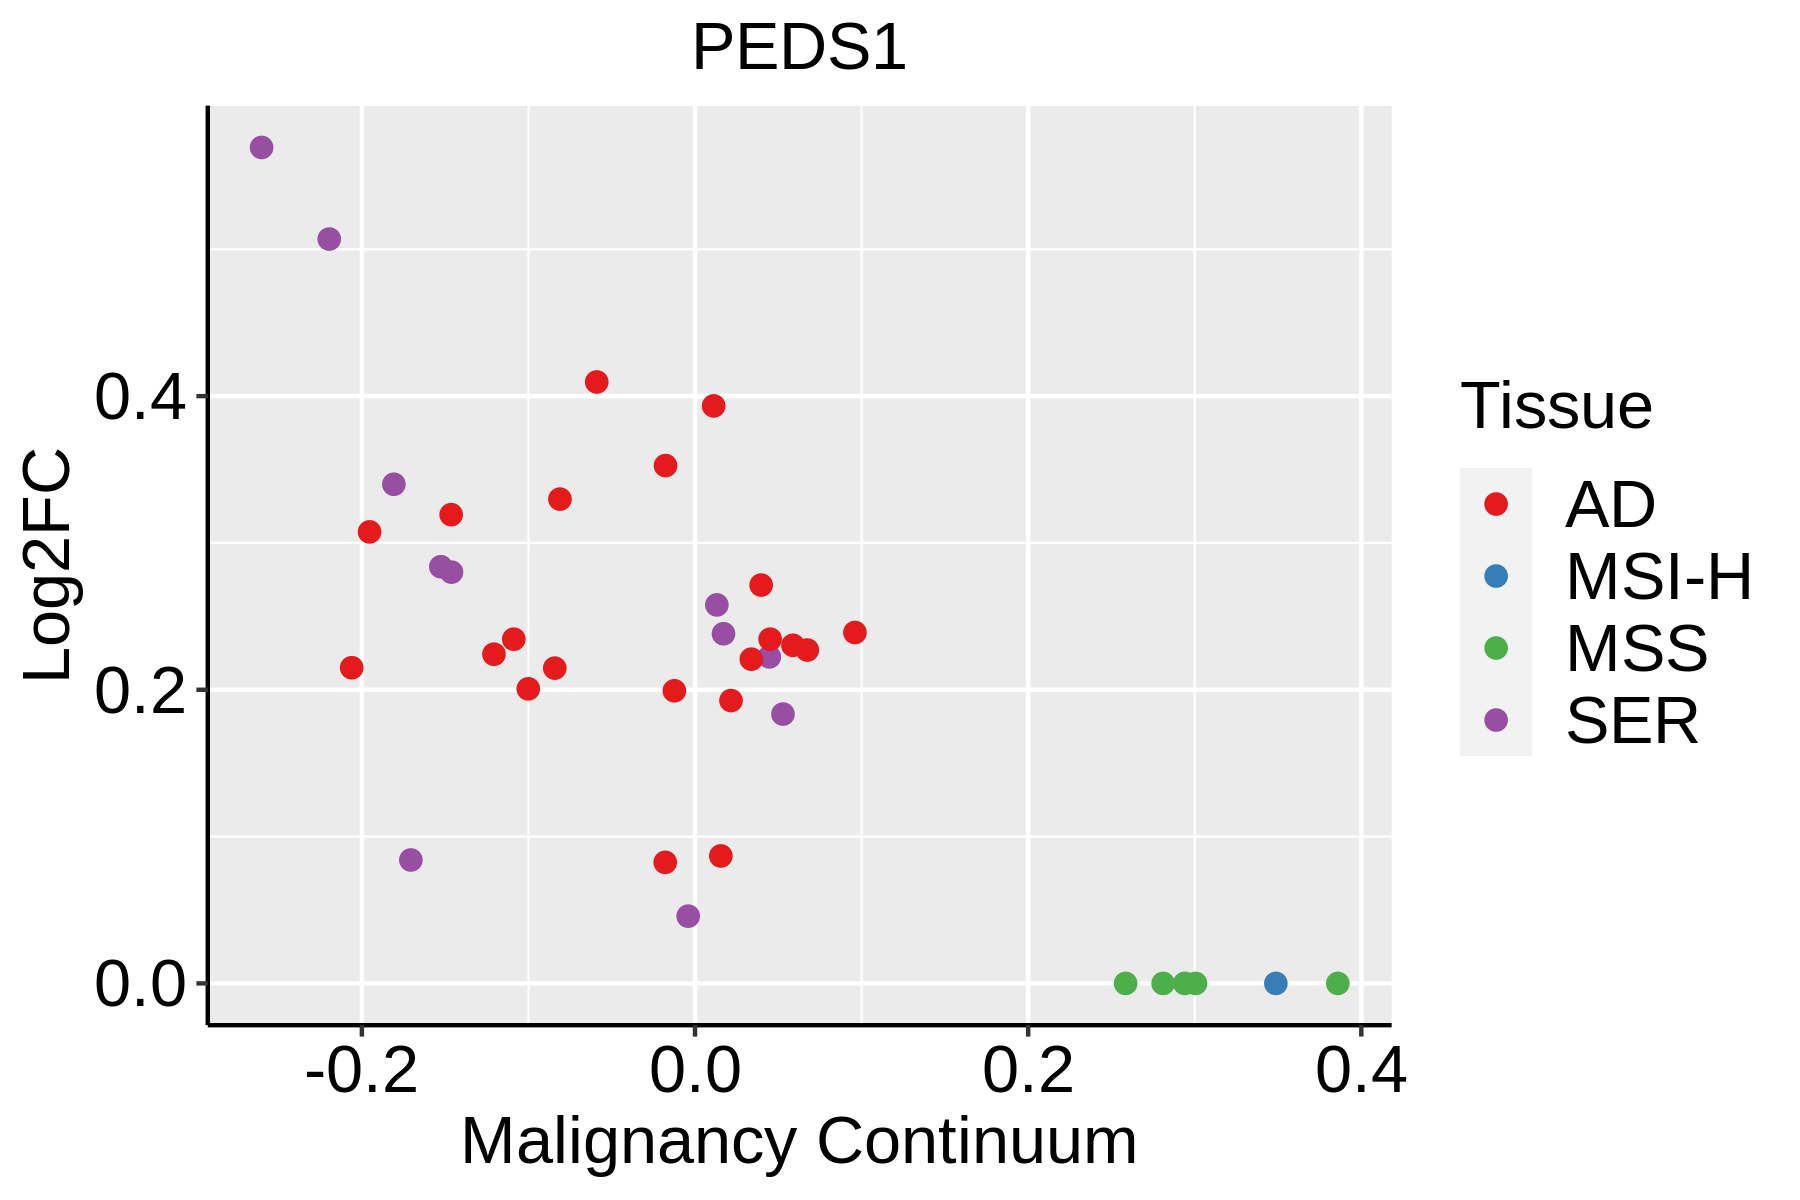 | AD: Adenomas |
| SER: Sessile serrated lesions | ||
| MSI-H: Microsatellite-high colorectal cancer | ||
| MSS: Microsatellite stable colorectal cancer |
| ∗log2FC in expression of this searched gene in stem-like cells from each diseased tissue sample relative to stem-like cells in normal samples in each tissue plotted against the malignancy continuum. Samples are colored based on if they are from different disease stage. |
Top |
Malignant transformation related pathway analysis |
| Find out the enriched GO biological processes and KEGG pathways involved in transition from healthy to precancer to cancer |
| Tissue | Disease Stage | Enriched GO biological Processes |
| Esophagus | ESCC |  |
| Skin | AK |  |
| Skin | SCCIS |  |
| Skin | cSCC |  |
| Thyroid | HT |  |
| ∗Top 15 enriched GO BP terms are showed in the bar plot of each disease state in each tissue. Each row represents a significant GO biological process which is colored according to the -log10(p.adjust). |
| Page: 1 2 3 4 5 6 7 8 9 |
| GO ID | Tissue | Disease Stage | Description | Gene Ratio | Bg Ratio | pvalue | p.adjust | Count |
| GO:0006631 | Colorectum | AD | fatty acid metabolic process | 114/3918 | 390/18723 | 5.58e-05 | 9.44e-04 | 114 |
| GO:0018904 | Colorectum | AD | ether metabolic process | 14/3918 | 27/18723 | 3.72e-04 | 4.29e-03 | 14 |
| GO:0006662 | Colorectum | AD | glycerol ether metabolic process | 12/3918 | 22/18723 | 5.38e-04 | 5.74e-03 | 12 |
| GO:0046485 | Colorectum | AD | ether lipid metabolic process | 10/3918 | 20/18723 | 3.67e-03 | 2.60e-02 | 10 |
| GO:00066621 | Colorectum | SER | glycerol ether metabolic process | 9/2897 | 22/18723 | 3.66e-03 | 3.06e-02 | 9 |
| GO:00189041 | Colorectum | SER | ether metabolic process | 10/2897 | 27/18723 | 5.18e-03 | 3.95e-02 | 10 |
| GO:00066311 | Colorectum | SER | fatty acid metabolic process | 79/2897 | 390/18723 | 6.34e-03 | 4.56e-02 | 79 |
| Page: 1 |
| Pathway ID | Tissue | Disease Stage | Description | Gene Ratio | Bg Ratio | pvalue | p.adjust | qvalue | Count |
| Page: 1 |
Top |
Cell-cell communication analysis |
| Identification of potential cell-cell interactions between two cell types and their ligand-receptor pairs for different disease states |
| Ligand | Receptor | LRpair | Pathway | Tissue | Disease Stage |
| Page: 1 |
Top |
Single-cell gene regulatory network inference analysis |
| Find out the significant the regulons (TFs) and the target genes of each regulon across cell types for different disease states |
| TF | Cell Type | Tissue | Disease Stage | Target Gene | RSS | Regulon Activity |
| ∗The dot plots of a searched regulon are shown for all cell subpopulations in each disease state of each tissue based on the regulon specific score inferred using pySCENIC and by calculating the average expression. |
| Page: 1 |
Top |
Somatic mutation of malignant transformation related genes |
| Annotation of somatic variants for genes involved in malignant transformation |
| Hugo Symbol | Variant Class | Variant Classification | dbSNP RS | HGVSc | HGVSp | HGVSp Short | SWISSPROT | BIOTYPE | SIFT | PolyPhen | Tumor Sample Barcode | Tissue | Histology | Sex | Age | Stage | Therapy Types | Drugs | Outcome |
| Page: 1 |
Top |
Related drugs of malignant transformation related genes |
| Identification of chemicals and drugs interact with genes involved in malignant transfromation |
| (DGIdb 4.0) |
| Entrez ID | Symbol | Category | Interaction Types | Drug Claim Name | Drug Name | PMIDs |
| Page: 1 |

Copyright 2023-Present -The University of Texas Health Science Center at Houston |