
|
|||||
|
 | |
| |
| |
| |
| |
| |
|
Gene: MOG |
Gene summary for MOG |
| Gene information | Species | Human | Gene symbol | MOG | Gene ID | 4340 |
| Gene name | myelin oligodendrocyte glycoprotein | |
| Gene Alias | BTN6 | |
| Cytomap | 6p22.1 | |
| Gene Type | protein-coding | GO ID | GO:0001816 | UniProtAcc | Q16653 |
Top |
Malignant transformation analysis |
| Identification of the aberrant gene expression in precancerous and cancerous lesions by comparing the gene expression of stem-like cells in diseased tissues with normal stem cells |
| Entrez ID | Symbol | Replicates | Species | Organ | Tissue | Adj P-value | Log2FC | Malignancy |
| 4340 | MOG | HCC1 | Human | Liver | HCC | 1.34e-09 | 1.08e+00 | 0.5336 |
| 4340 | MOG | HCC2 | Human | Liver | HCC | 2.67e-18 | 1.23e+00 | 0.5341 |
| 4340 | MOG | HCC5 | Human | Liver | HCC | 5.01e-21 | 1.50e+00 | 0.4932 |
| Page: 1 |
| Tissue | Expression Dynamics | Abbreviation |
| Liver | 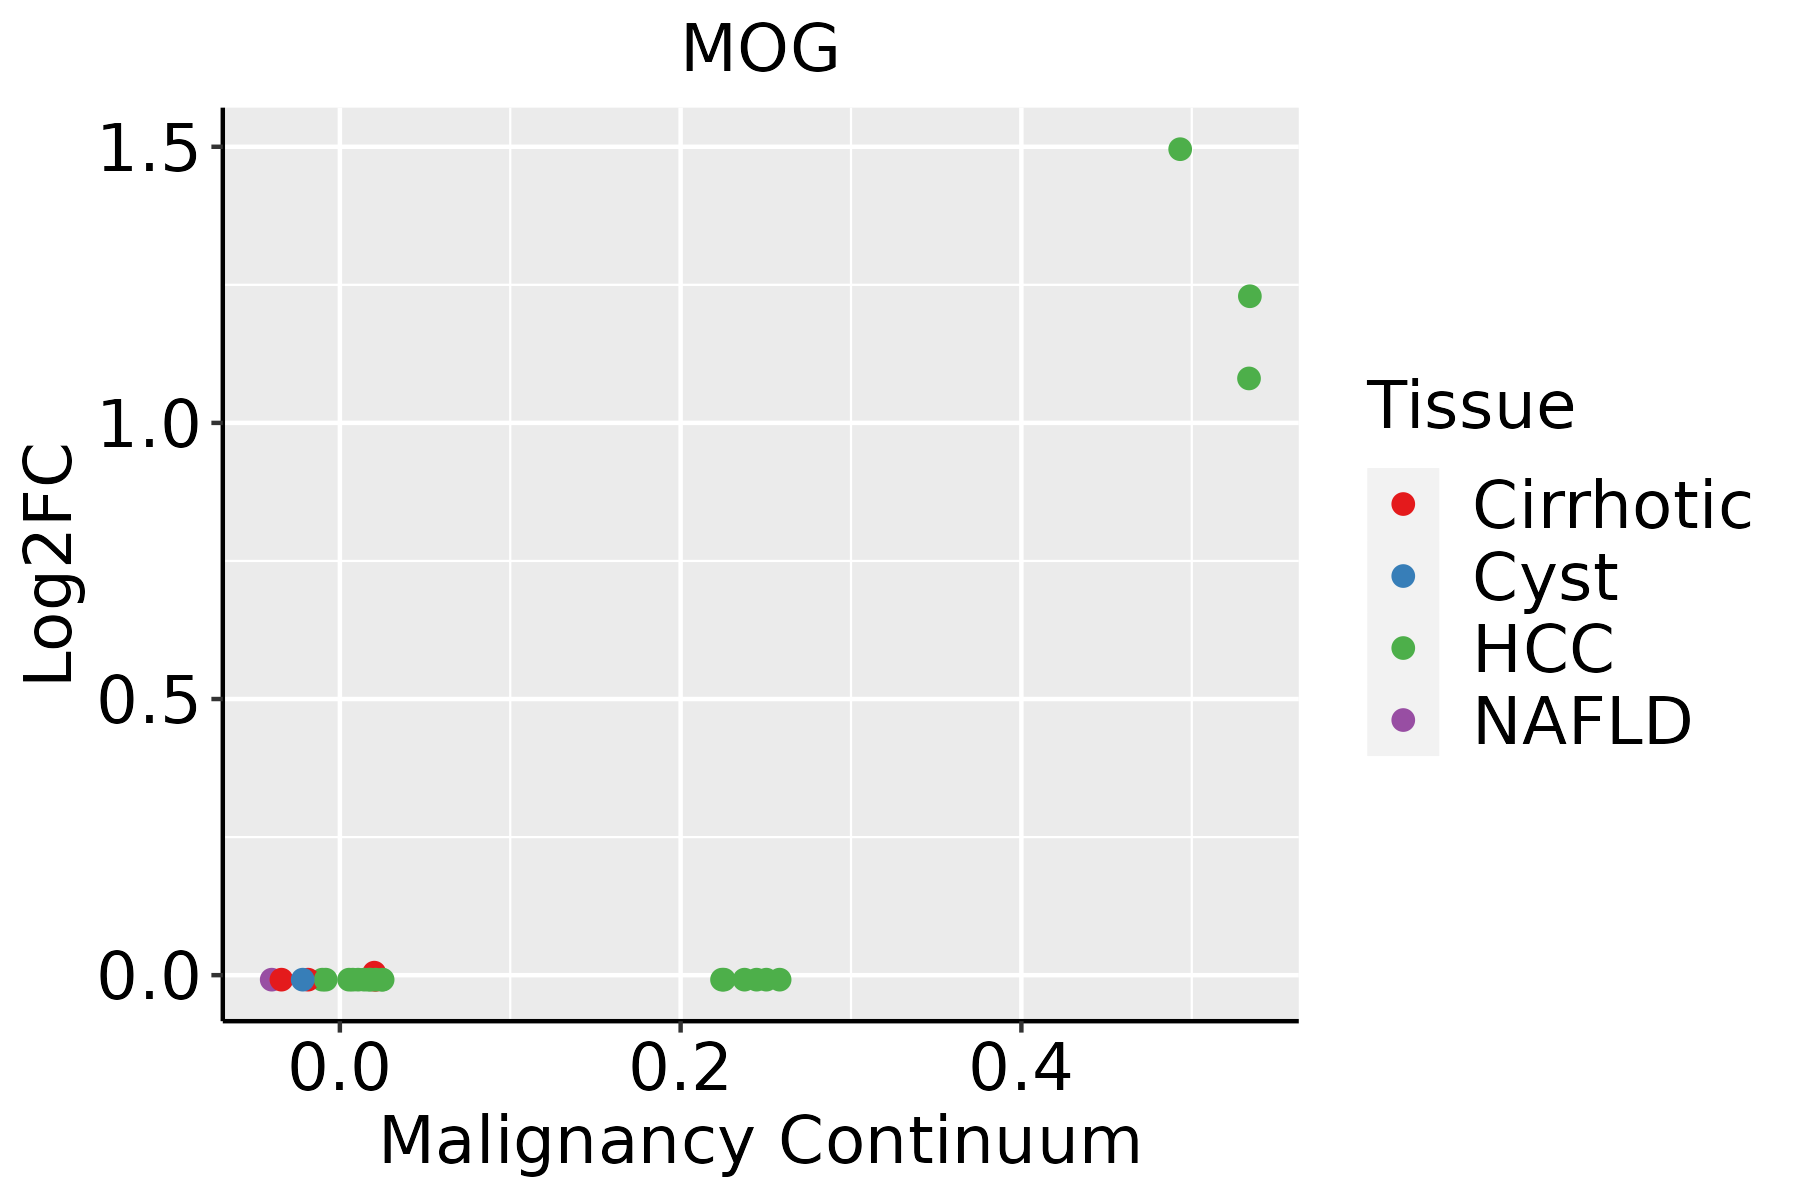 | HCC: Hepatocellular carcinoma |
| NAFLD: Non-alcoholic fatty liver disease |
| ∗log2FC in expression of this searched gene in stem-like cells from each diseased tissue sample relative to stem-like cells in normal samples in each tissue plotted against the malignancy continuum. Samples are colored based on if they are from different disease stage. |
Top |
Malignant transformation related pathway analysis |
| Find out the enriched GO biological processes and KEGG pathways involved in transition from healthy to precancer to cancer |
| Tissue | Disease Stage | Enriched GO biological Processes |
| Esophagus | ESCC |  |
| Skin | AK |  |
| Skin | SCCIS |  |
| Skin | cSCC |  |
| Thyroid | HT |  |
| ∗Top 15 enriched GO BP terms are showed in the bar plot of each disease state in each tissue. Each row represents a significant GO biological process which is colored according to the -log10(p.adjust). |
| Page: 1 2 3 4 5 6 7 8 9 |
| GO ID | Tissue | Disease Stage | Description | Gene Ratio | Bg Ratio | pvalue | p.adjust | Count |
| GO:0016032 | Colorectum | AD | viral process | 168/3918 | 415/18723 | 4.67e-20 | 3.66e-17 | 168 |
| GO:0019080 | Colorectum | AD | viral gene expression | 42/3918 | 94/18723 | 1.90e-07 | 8.02e-06 | 42 |
| GO:0006457 | Colorectum | AD | protein folding | 73/3918 | 212/18723 | 3.24e-06 | 9.10e-05 | 73 |
| GO:0019082 | Colorectum | AD | viral protein processing | 17/3918 | 29/18723 | 1.04e-05 | 2.40e-04 | 17 |
| GO:0006066 | Colorectum | AD | alcohol metabolic process | 106/3918 | 353/18723 | 3.02e-05 | 5.57e-04 | 106 |
| GO:0044262 | Colorectum | AD | cellular carbohydrate metabolic process | 87/3918 | 283/18723 | 6.00e-05 | 1.01e-03 | 87 |
| GO:0006487 | Colorectum | AD | protein N-linked glycosylation | 25/3918 | 65/18723 | 9.12e-04 | 8.71e-03 | 25 |
| GO:0006486 | Colorectum | AD | protein glycosylation | 64/3918 | 226/18723 | 4.86e-03 | 3.27e-02 | 64 |
| GO:0043413 | Colorectum | AD | macromolecule glycosylation | 64/3918 | 226/18723 | 4.86e-03 | 3.27e-02 | 64 |
| GO:0070085 | Colorectum | AD | glycosylation | 67/3918 | 240/18723 | 5.78e-03 | 3.67e-02 | 67 |
| GO:0045017 | Colorectum | AD | glycerolipid biosynthetic process | 69/3918 | 252/18723 | 8.33e-03 | 4.88e-02 | 69 |
| GO:00160321 | Colorectum | SER | viral process | 118/2897 | 415/18723 | 8.36e-12 | 1.65e-09 | 118 |
| GO:00064571 | Colorectum | SER | protein folding | 54/2897 | 212/18723 | 1.04e-04 | 2.18e-03 | 54 |
| GO:00190801 | Colorectum | SER | viral gene expression | 29/2897 | 94/18723 | 1.32e-04 | 2.66e-03 | 29 |
| GO:00060661 | Colorectum | SER | alcohol metabolic process | 79/2897 | 353/18723 | 3.50e-04 | 5.50e-03 | 79 |
| GO:0022600 | Colorectum | SER | digestive system process | 29/2897 | 104/18723 | 8.57e-04 | 1.05e-02 | 29 |
| GO:0046486 | Colorectum | SER | glycerolipid metabolic process | 82/2897 | 392/18723 | 2.26e-03 | 2.17e-02 | 82 |
| GO:0050892 | Colorectum | SER | intestinal absorption | 14/2897 | 41/18723 | 2.45e-03 | 2.32e-02 | 14 |
| GO:00450171 | Colorectum | SER | glycerolipid biosynthetic process | 55/2897 | 252/18723 | 4.47e-03 | 3.56e-02 | 55 |
| GO:00160322 | Colorectum | MSS | viral process | 157/3467 | 415/18723 | 7.94e-21 | 6.19e-18 | 157 |
| Page: 1 2 3 4 5 6 7 |
| Pathway ID | Tissue | Disease Stage | Description | Gene Ratio | Bg Ratio | pvalue | p.adjust | qvalue | Count |
| Page: 1 |
Top |
Cell-cell communication analysis |
| Identification of potential cell-cell interactions between two cell types and their ligand-receptor pairs for different disease states |
| Ligand | Receptor | LRpair | Pathway | Tissue | Disease Stage |
| Page: 1 |
Top |
Single-cell gene regulatory network inference analysis |
| Find out the significant the regulons (TFs) and the target genes of each regulon across cell types for different disease states |
| TF | Cell Type | Tissue | Disease Stage | Target Gene | RSS | Regulon Activity |
| ∗The dot plots of a searched regulon are shown for all cell subpopulations in each disease state of each tissue based on the regulon specific score inferred using pySCENIC and by calculating the average expression. |
| Page: 1 |
Top |
Somatic mutation of malignant transformation related genes |
| Annotation of somatic variants for genes involved in malignant transformation |
| Hugo Symbol | Variant Class | Variant Classification | dbSNP RS | HGVSc | HGVSp | HGVSp Short | SWISSPROT | BIOTYPE | SIFT | PolyPhen | Tumor Sample Barcode | Tissue | Histology | Sex | Age | Stage | Therapy Types | Drugs | Outcome |
| MOG | SNV | Missense_Mutation | novel | c.177G>T | p.Lys59Asn | p.K59N | Q16653 | protein_coding | tolerated(0.06) | possibly_damaging(0.644) | TCGA-A8-A09M-01 | Breast | breast invasive carcinoma | Female | >=65 | III/IV | Chemotherapy | paclitaxel | CR |
| MOG | SNV | Missense_Mutation | c.242N>A | p.Arg81Lys | p.R81K | Q16653 | protein_coding | deleterious(0.03) | possibly_damaging(0.693) | TCGA-OL-A5DA-01 | Breast | breast invasive carcinoma | Female | <65 | I/II | Unknown | Unknown | SD | |
| MOG | insertion | Nonsense_Mutation | novel | c.650_651insCTCTAATGGGAATGAAAACATCTGTGGCTTCCATTGGTAATTAAG | p.Val217_Leu218insSerAsnGlyAsnGluAsnIleCysGlyPheHisTrpTerLeuSer | p.V217_L218insSNGNENICGFHW*LS | Q16653 | protein_coding | TCGA-A2-A0CP-01 | Breast | breast invasive carcinoma | Female | <65 | I/II | Chemotherapy | cytoxan | SD | ||
| MOG | insertion | In_Frame_Ins | novel | c.203_204insTGAGGA | p.Trp68delinsCysGluGlu | p.W68delinsCEE | Q16653 | protein_coding | TCGA-AO-A0JI-01 | Breast | breast invasive carcinoma | Female | <65 | I/II | Chemotherapy | cyclophosphamide | SD | ||
| MOG | insertion | Nonsense_Mutation | novel | c.205_206insGAGGGCCTCAGGAATCCCCAGCATGTGGGG | p.Tyr69delinsTer | p.Y69delins* | Q16653 | protein_coding | TCGA-AO-A0JI-01 | Breast | breast invasive carcinoma | Female | <65 | I/II | Chemotherapy | cyclophosphamide | SD | ||
| MOG | SNV | Missense_Mutation | novel | c.20C>G | p.Pro7Arg | p.P7R | Q16653 | protein_coding | tolerated(0.07) | benign(0.009) | TCGA-VS-A8EJ-01 | Cervix | cervical & endocervical cancer | Female | <65 | I/II | Chemotherapy | cisplatin | PD |
| MOG | SNV | Missense_Mutation | c.422A>C | p.Glu141Ala | p.E141A | Q16653 | protein_coding | deleterious(0.01) | benign(0.012) | TCGA-AA-A00N-01 | Colorectum | colon adenocarcinoma | Male | >=65 | I/II | Unknown | Unknown | PD | |
| MOG | SNV | Missense_Mutation | c.479N>T | p.Ala160Val | p.A160V | Q16653 | protein_coding | tolerated(0.13) | possibly_damaging(0.551) | TCGA-AA-A010-01 | Colorectum | colon adenocarcinoma | Female | <65 | I/II | Chemotherapy | folinic | CR | |
| MOG | SNV | Missense_Mutation | novel | c.181N>A | p.Ala61Thr | p.A61T | Q16653 | protein_coding | deleterious(0) | possibly_damaging(0.89) | TCGA-AZ-4315-01 | Colorectum | colon adenocarcinoma | Male | <65 | I/II | Unknown | Unknown | SD |
| MOG | SNV | Missense_Mutation | rs781193948 | c.289N>T | p.Arg97Trp | p.R97W | Q16653 | protein_coding | deleterious(0) | probably_damaging(1) | TCGA-CA-6719-01 | Colorectum | colon adenocarcinoma | Male | >=65 | I/II | Unknown | Unknown | PD |
| Page: 1 2 3 4 5 |
Top |
Related drugs of malignant transformation related genes |
| Identification of chemicals and drugs interact with genes involved in malignant transfromation |
| (DGIdb 4.0) |
| Entrez ID | Symbol | Category | Interaction Types | Drug Claim Name | Drug Name | PMIDs |
| Page: 1 |

Copyright 2023-Present -The University of Texas Health Science Center at Houston |