| Tissue | Expression Dynamics | Abbreviation |
| Breast |  | IDC: Invasive ductal carcinoma |
| DCIS: Ductal carcinoma in situ |
| Precancer(BRCA1-mut): Precancerous lesion from BRCA1 mutation carriers |
| Cervix | 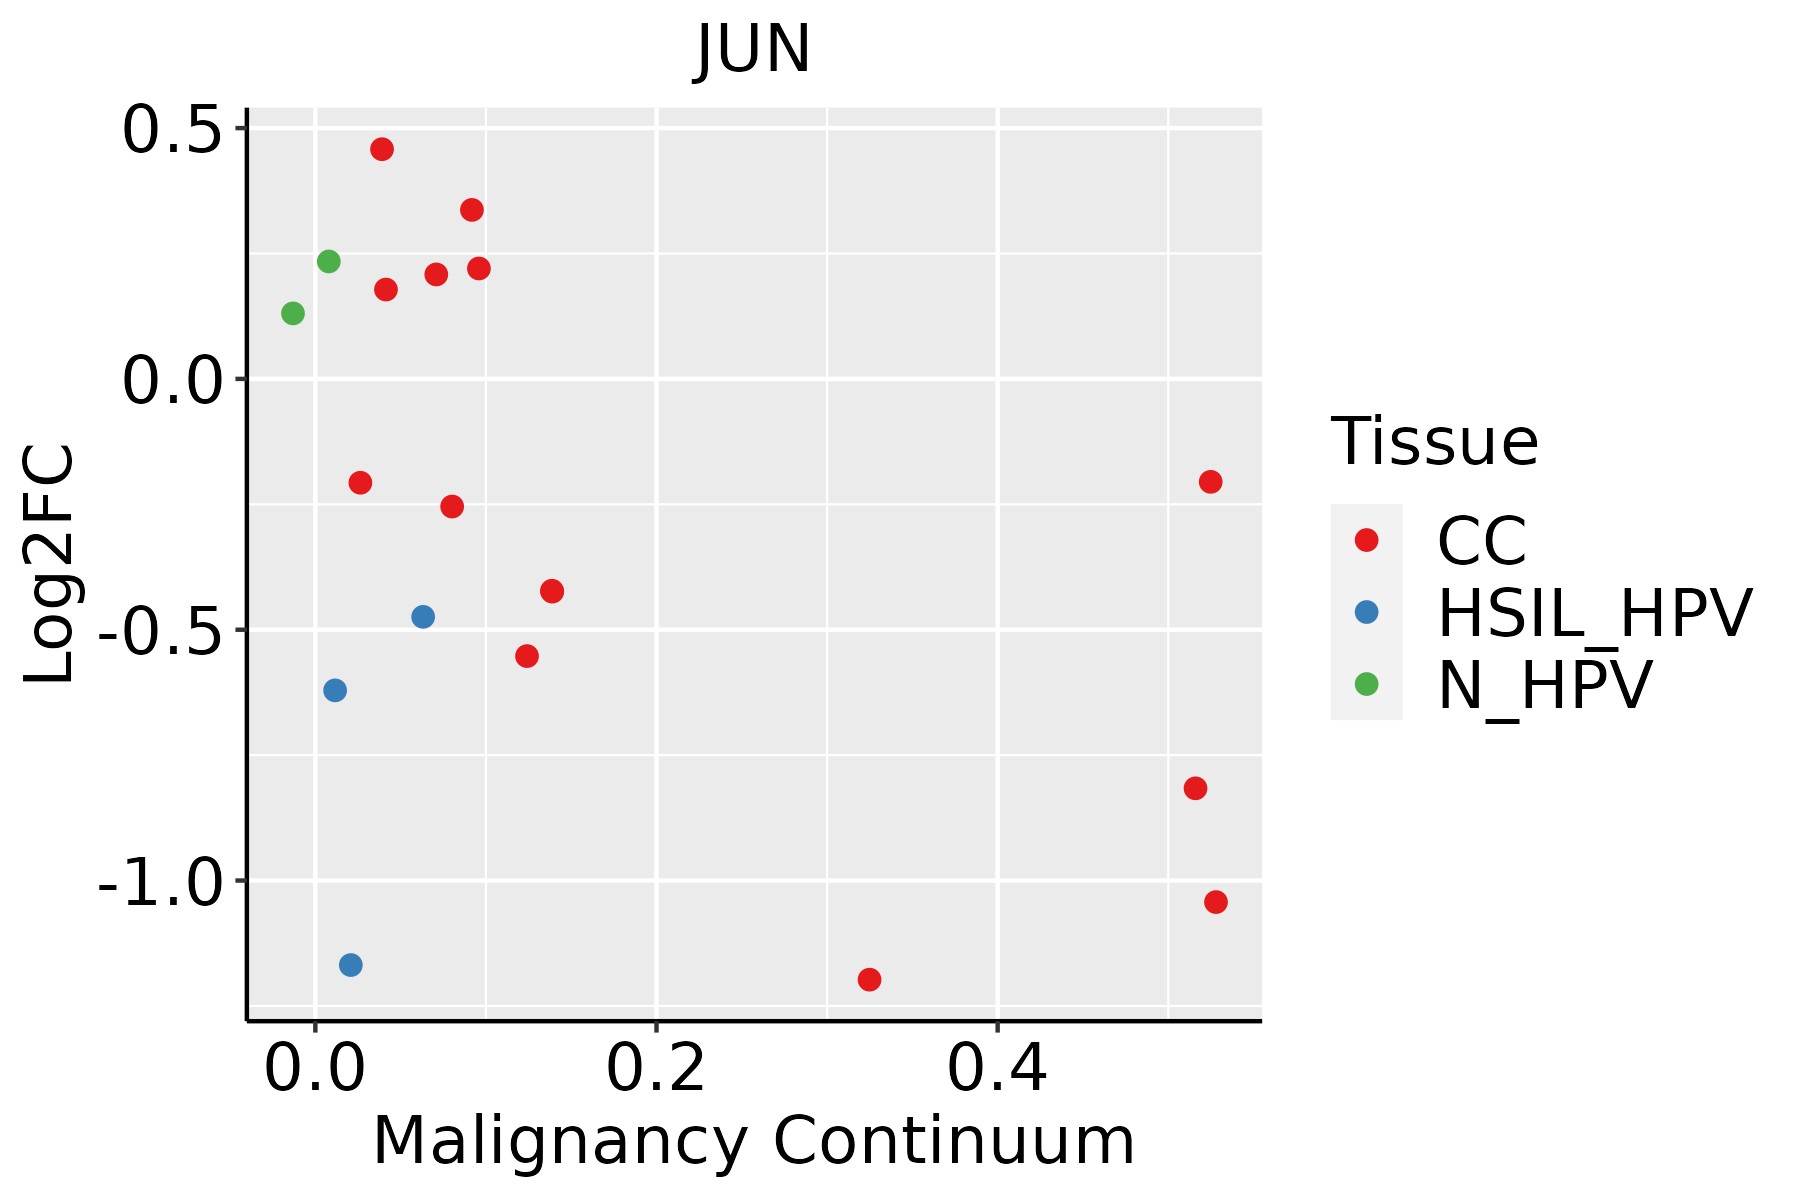 | CC: Cervix cancer |
| HSIL_HPV: HPV-infected high-grade squamous intraepithelial lesions |
| N_HPV: HPV-infected normal cervix |
| Colorectum (GSE201348) |  | FAP: Familial adenomatous polyposis |
| CRC: Colorectal cancer |
| Colorectum (HTA11) | 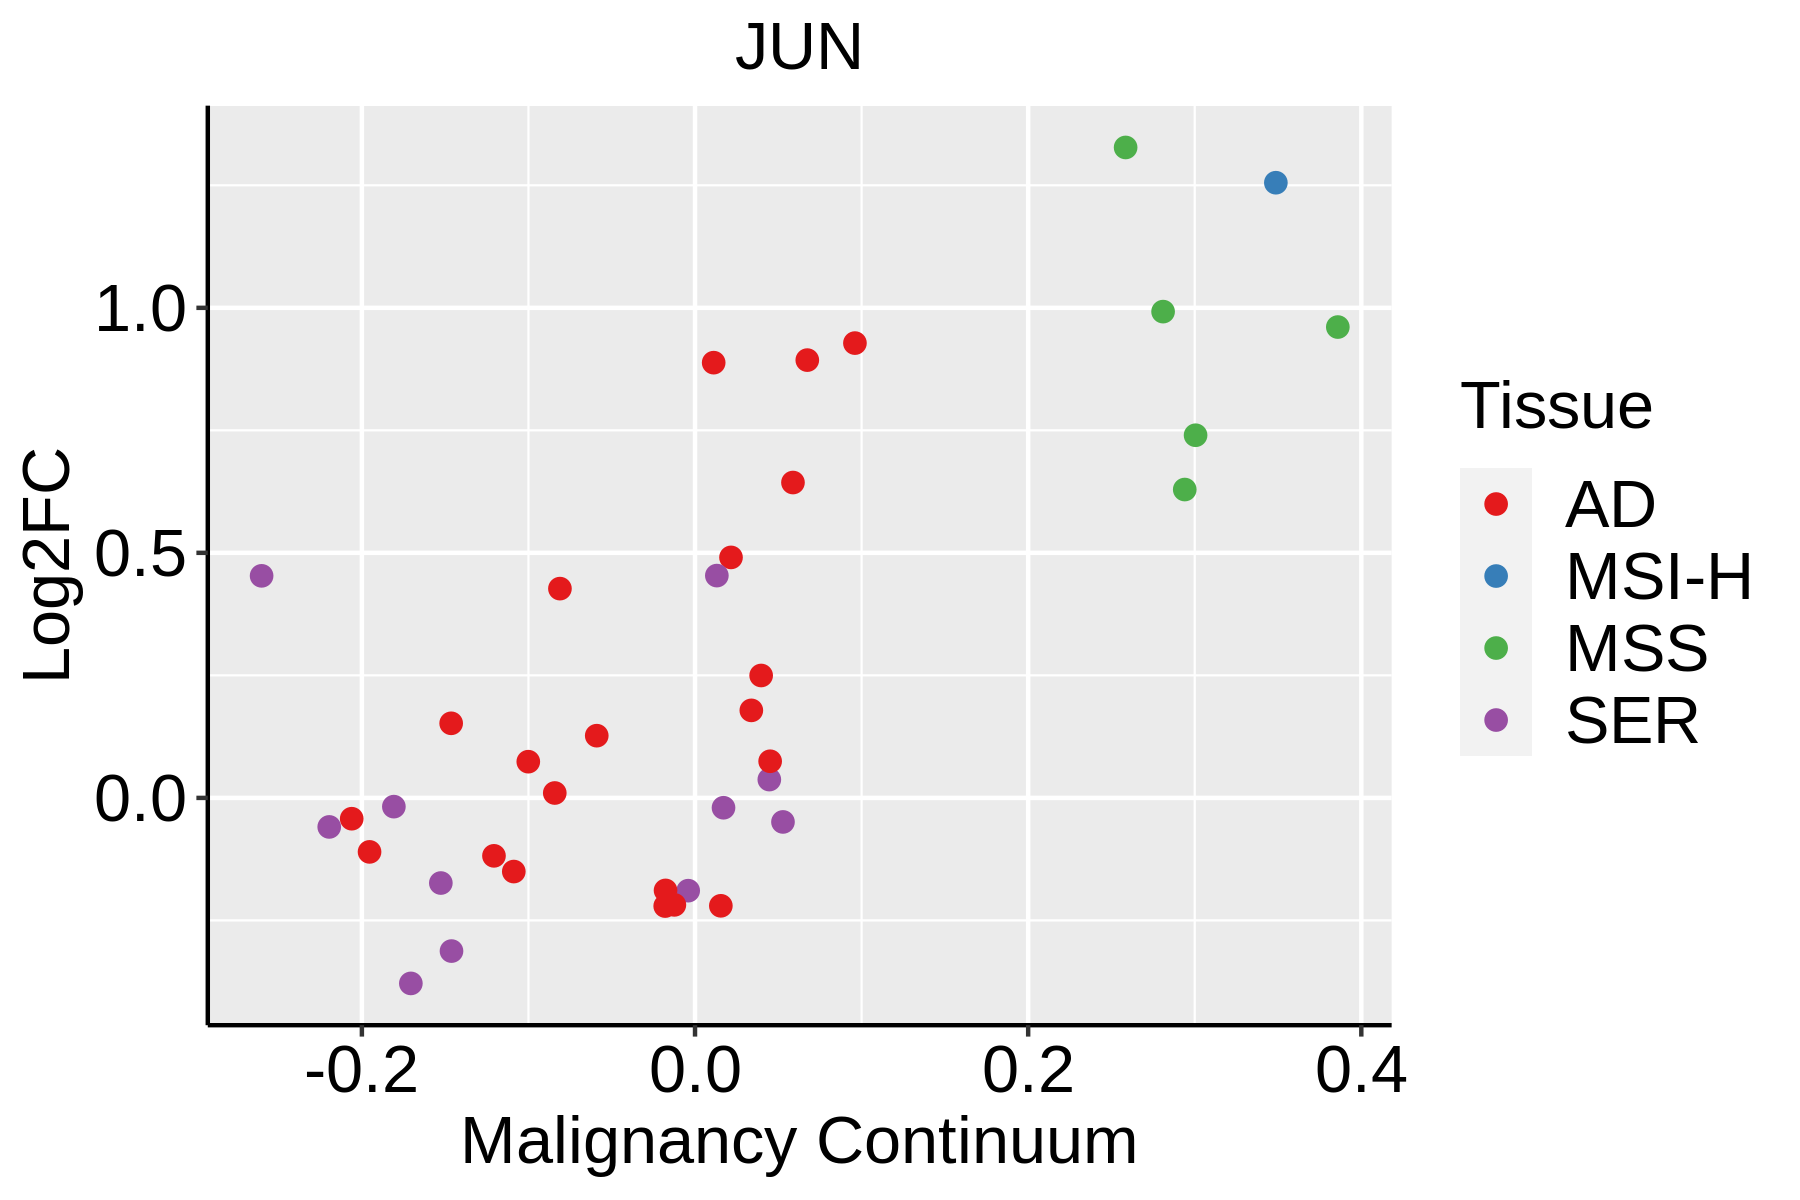 | AD: Adenomas |
| SER: Sessile serrated lesions |
| MSI-H: Microsatellite-high colorectal cancer |
| MSS: Microsatellite stable colorectal cancer |
| Endometrium |  | AEH: Atypical endometrial hyperplasia |
| EEC: Endometrioid Cancer |
| Esophagus |  | ESCC: Esophageal squamous cell carcinoma |
| HGIN: High-grade intraepithelial neoplasias |
| LGIN: Low-grade intraepithelial neoplasias |
| GC | 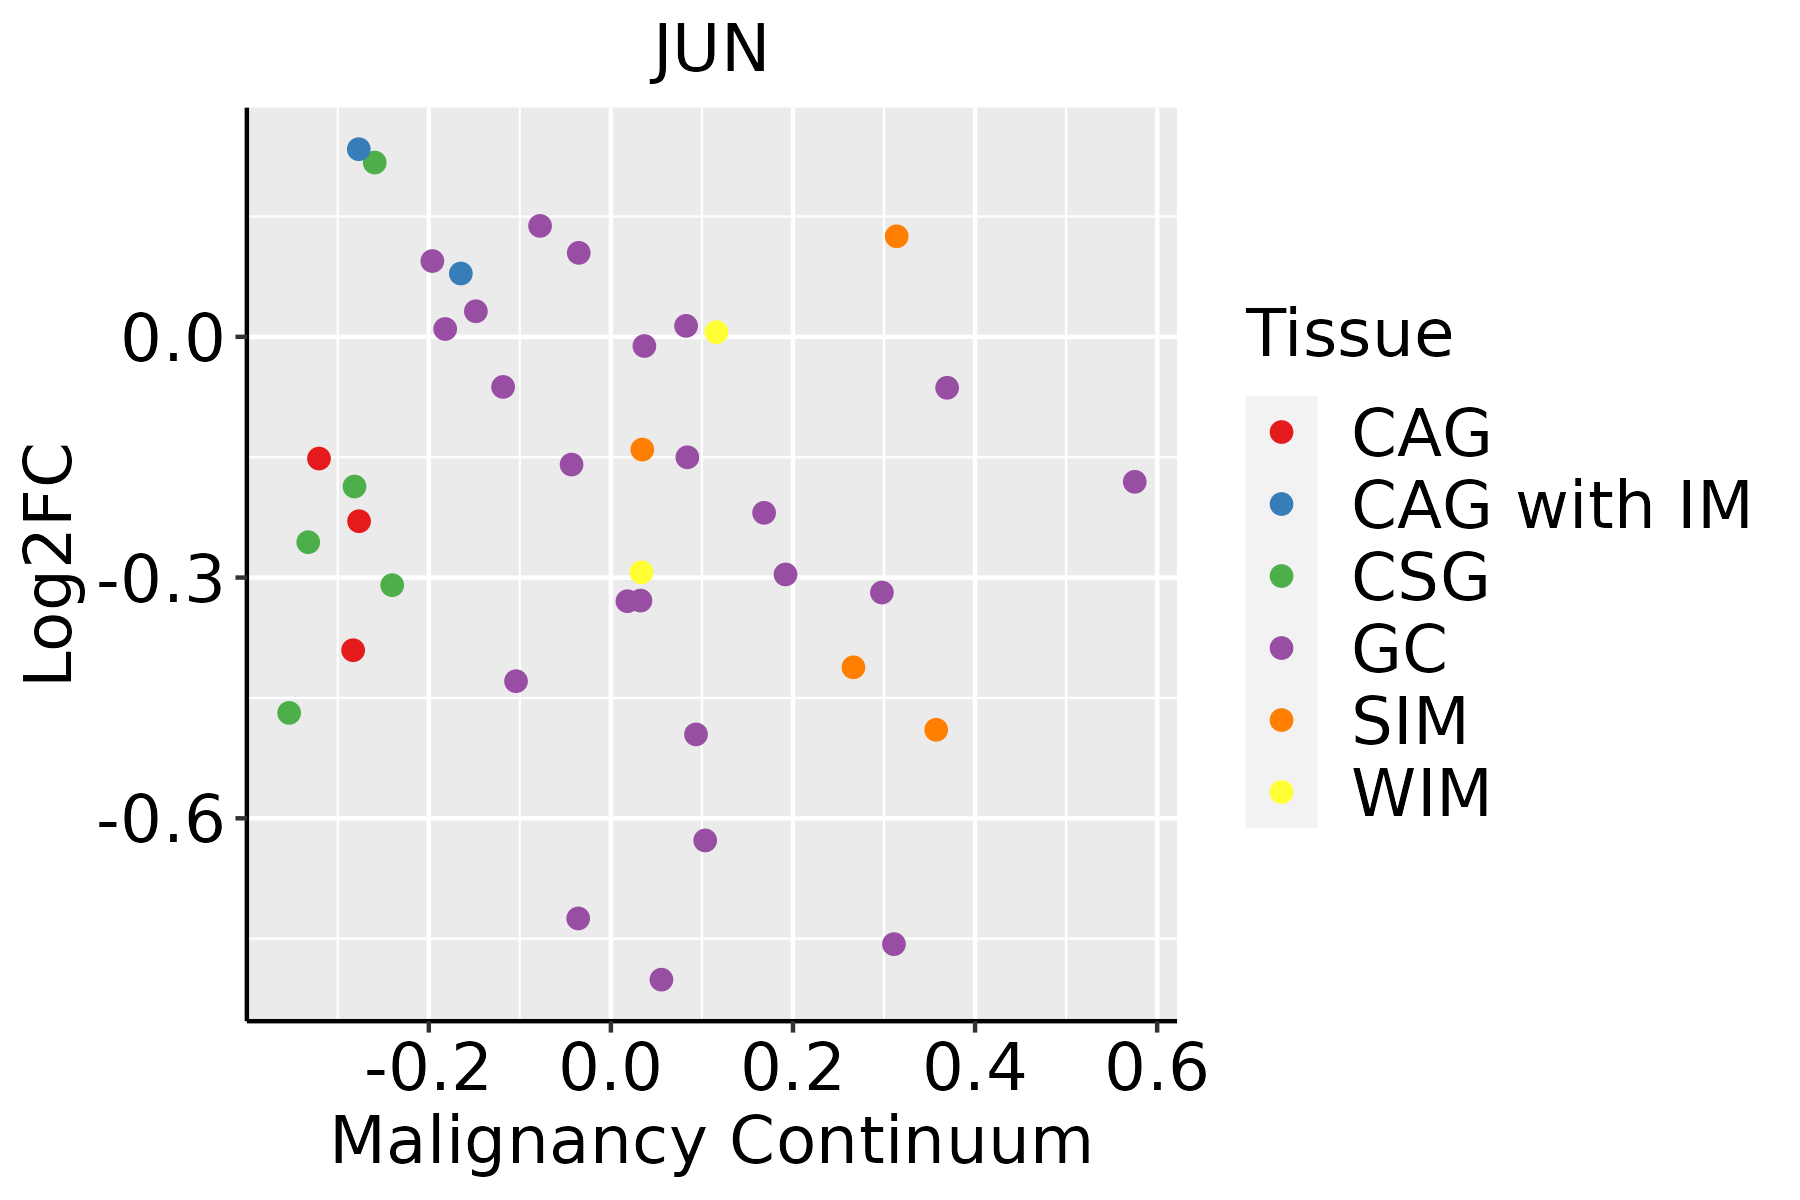 | CAG: Chronic atrophic gastritis |
| CAG with IM: Chronic atrophic gastritis with intestinal metaplasia |
| CSG: Chronic superficial gastritis |
| GC: Gastric cancer |
| SIM: Severe intestinal metaplasia |
| WIM: Wild intestinal metaplasia |
| Liver |  | HCC: Hepatocellular carcinoma |
| NAFLD: Non-alcoholic fatty liver disease |
| Lung |  | AAH: Atypical adenomatous hyperplasia |
| AIS: Adenocarcinoma in situ |
| IAC: Invasive lung adenocarcinoma |
| MIA: Minimally invasive adenocarcinoma |
| Oral Cavity |  | EOLP: Erosive Oral lichen planus |
| LP: leukoplakia |
| NEOLP: Non-erosive oral lichen planus |
| OSCC: Oral squamous cell carcinoma |
| Prostate |  | BPH: Benign Prostatic Hyperplasia |
| Skin | 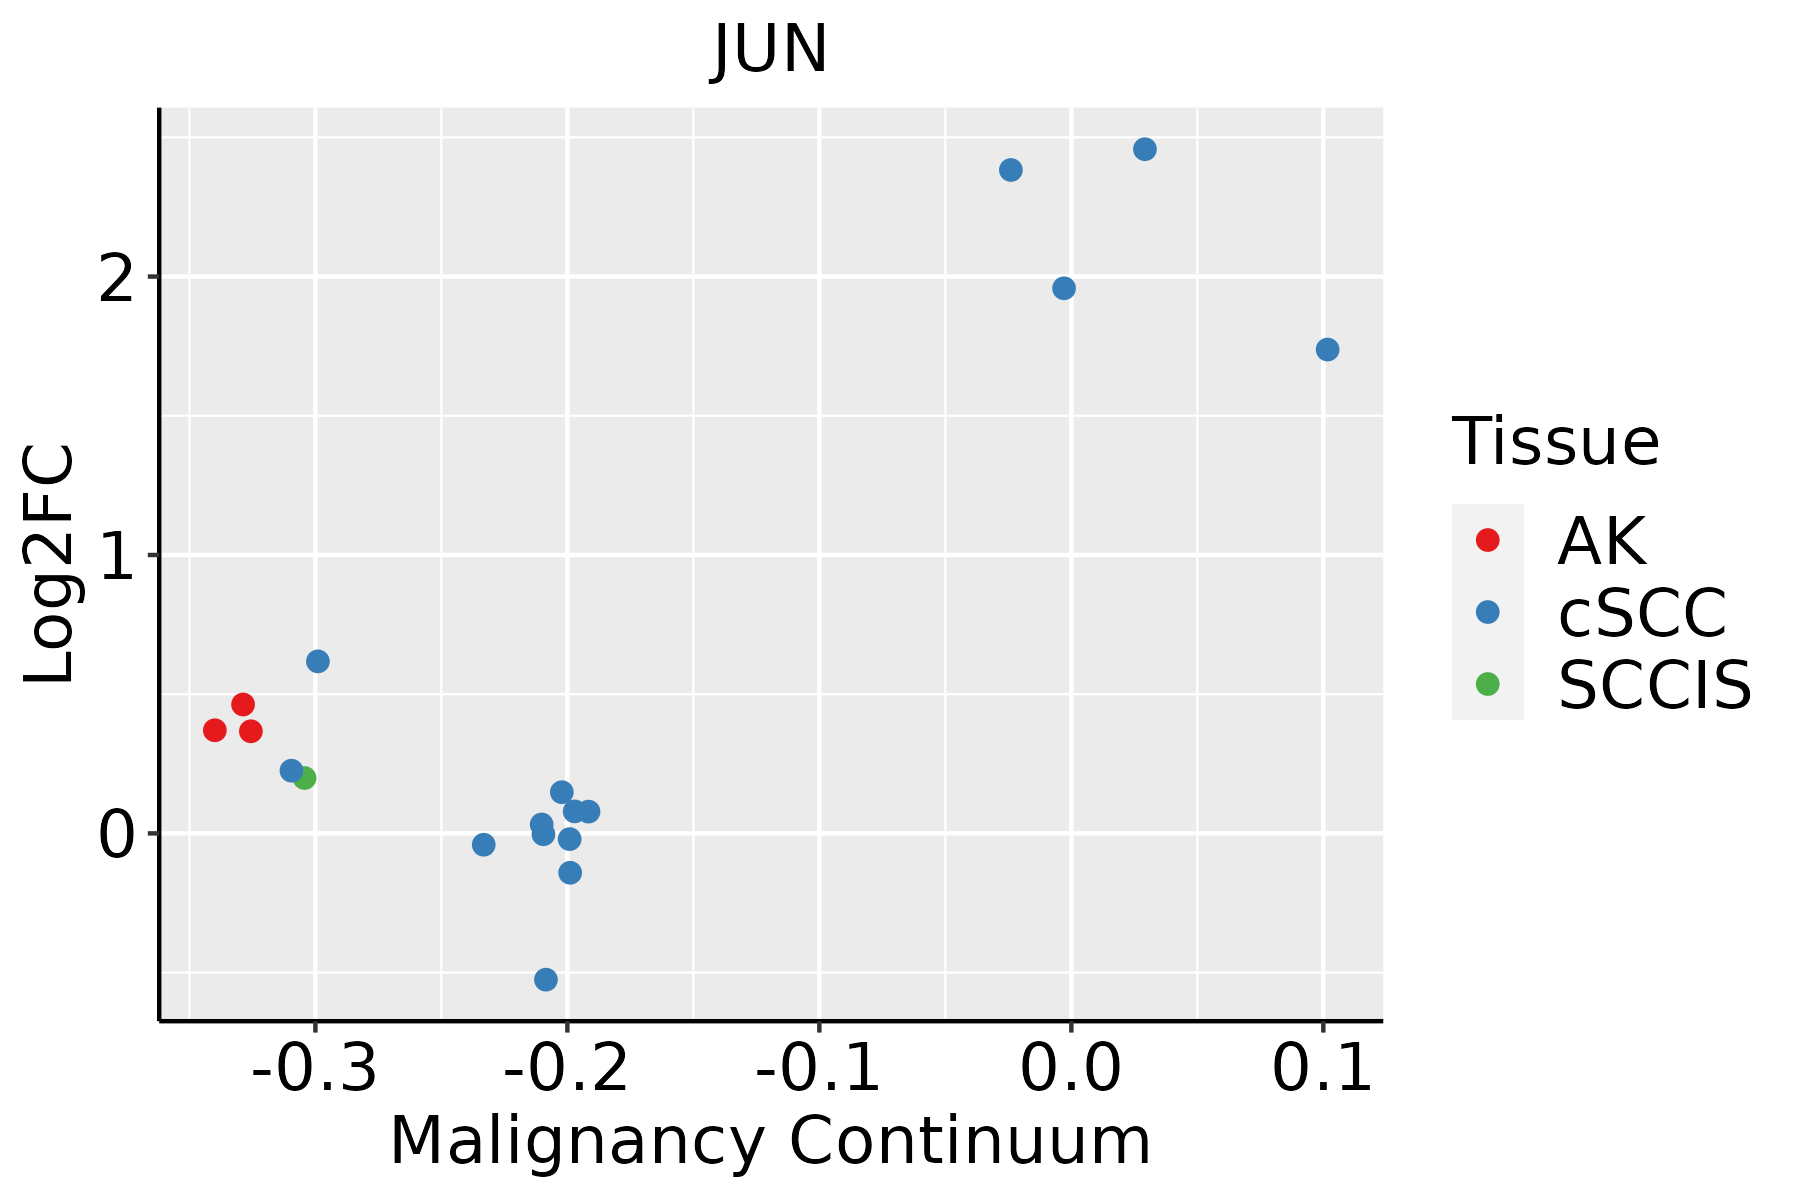 | AK: Actinic keratosis |
| cSCC: Cutaneous squamous cell carcinoma |
| SCCIS:squamous cell carcinoma in situ |
| Thyroid |  | ATC: Anaplastic thyroid cancer |
| HT: Hashimoto's thyroiditis |
| PTC: Papillary thyroid cancer |
| GO ID | Tissue | Disease Stage | Description | Gene Ratio | Bg Ratio | pvalue | p.adjust | Count |
| GO:00069799 | Breast | Precancer | response to oxidative stress | 70/1080 | 446/18723 | 1.59e-14 | 4.26e-12 | 70 |
| GO:00621979 | Breast | Precancer | cellular response to chemical stress | 51/1080 | 337/18723 | 2.40e-10 | 2.34e-08 | 51 |
| GO:00160329 | Breast | Precancer | viral process | 58/1080 | 415/18723 | 3.42e-10 | 3.16e-08 | 58 |
| GO:00003029 | Breast | Precancer | response to reactive oxygen species | 38/1080 | 222/18723 | 1.47e-09 | 1.23e-07 | 38 |
| GO:00709979 | Breast | Precancer | neuron death | 50/1080 | 361/18723 | 7.75e-09 | 5.70e-07 | 50 |
| GO:00514029 | Breast | Precancer | neuron apoptotic process | 38/1080 | 246/18723 | 2.68e-08 | 1.75e-06 | 38 |
| GO:00345999 | Breast | Precancer | cellular response to oxidative stress | 42/1080 | 288/18723 | 2.78e-08 | 1.79e-06 | 42 |
| GO:00444039 | Breast | Precancer | biological process involved in symbiotic interaction | 42/1080 | 290/18723 | 3.40e-08 | 2.11e-06 | 42 |
| GO:00086378 | Breast | Precancer | apoptotic mitochondrial changes | 23/1080 | 107/18723 | 3.44e-08 | 2.12e-06 | 23 |
| GO:00349769 | Breast | Precancer | response to endoplasmic reticulum stress | 38/1080 | 256/18723 | 7.89e-08 | 4.60e-06 | 38 |
| GO:00425429 | Breast | Precancer | response to hydrogen peroxide | 26/1080 | 146/18723 | 2.52e-07 | 1.26e-05 | 26 |
| GO:00100389 | Breast | Precancer | response to metal ion | 47/1080 | 373/18723 | 3.88e-07 | 1.79e-05 | 47 |
| GO:00511019 | Breast | Precancer | regulation of DNA binding | 22/1080 | 118/18723 | 9.28e-07 | 3.71e-05 | 22 |
| GO:19012149 | Breast | Precancer | regulation of neuron death | 41/1080 | 319/18723 | 1.27e-06 | 4.80e-05 | 41 |
| GO:00435237 | Breast | Precancer | regulation of neuron apoptotic process | 31/1080 | 212/18723 | 1.69e-06 | 6.08e-05 | 31 |
| GO:00075653 | Breast | Precancer | female pregnancy | 29/1080 | 193/18723 | 2.07e-06 | 7.31e-05 | 29 |
| GO:00510989 | Breast | Precancer | regulation of binding | 44/1080 | 363/18723 | 2.59e-06 | 8.65e-05 | 44 |
| GO:00447063 | Breast | Precancer | multi-multicellular organism process | 31/1080 | 220/18723 | 3.73e-06 | 1.19e-04 | 31 |
| GO:00300999 | Breast | Precancer | myeloid cell differentiation | 45/1080 | 381/18723 | 4.00e-06 | 1.25e-04 | 45 |
| GO:00018367 | Breast | Precancer | release of cytochrome c from mitochondria | 14/1080 | 59/18723 | 4.80e-06 | 1.47e-04 | 14 |
| Pathway ID | Tissue | Disease Stage | Description | Gene Ratio | Bg Ratio | pvalue | p.adjust | qvalue | Count |
| hsa0493216 | Breast | Precancer | Non-alcoholic fatty liver disease | 48/684 | 155/8465 | 6.16e-17 | 1.50e-15 | 1.15e-15 | 48 |
| hsa0513218 | Breast | Precancer | Salmonella infection | 49/684 | 249/8465 | 2.92e-09 | 6.15e-08 | 4.71e-08 | 49 |
| hsa0513018 | Breast | Precancer | Pathogenic Escherichia coli infection | 38/684 | 197/8465 | 3.12e-07 | 5.81e-06 | 4.45e-06 | 38 |
| hsa0513118 | Breast | Precancer | Shigellosis | 44/684 | 247/8465 | 3.91e-07 | 6.86e-06 | 5.26e-06 | 44 |
| hsa0516718 | Breast | Precancer | Kaposi sarcoma-associated herpesvirus infection | 36/684 | 194/8465 | 1.68e-06 | 2.53e-05 | 1.94e-05 | 36 |
| hsa0491518 | Breast | Precancer | Estrogen signaling pathway | 28/684 | 138/8465 | 4.10e-06 | 5.39e-05 | 4.13e-05 | 28 |
| hsa0541818 | Breast | Precancer | Fluid shear stress and atherosclerosis | 28/684 | 139/8465 | 4.74e-06 | 6.00e-05 | 4.59e-05 | 28 |
| hsa0541718 | Breast | Precancer | Lipid and atherosclerosis | 37/684 | 215/8465 | 7.64e-06 | 9.29e-05 | 7.12e-05 | 37 |
| hsa0516918 | Breast | Precancer | Epstein-Barr virus infection | 35/684 | 202/8465 | 1.15e-05 | 1.26e-04 | 9.64e-05 | 35 |
| hsa0465716 | Breast | Precancer | IL-17 signaling pathway | 20/684 | 94/8465 | 4.74e-05 | 4.54e-04 | 3.48e-04 | 20 |
| hsa042108 | Breast | Precancer | Apoptosis | 25/684 | 136/8465 | 7.61e-05 | 6.87e-04 | 5.26e-04 | 25 |
| hsa0516618 | Breast | Precancer | Human T-cell leukemia virus 1 infection | 33/684 | 222/8465 | 4.29e-04 | 3.31e-03 | 2.53e-03 | 33 |
| hsa0413716 | Breast | Precancer | Mitophagy - animal | 15/684 | 72/8465 | 5.22e-04 | 3.93e-03 | 3.01e-03 | 15 |
| hsa05031 | Breast | Precancer | Amphetamine addiction | 14/684 | 69/8465 | 1.05e-03 | 7.35e-03 | 5.63e-03 | 14 |
| hsa052036 | Breast | Precancer | Viral carcinogenesis | 27/684 | 204/8465 | 7.19e-03 | 4.06e-02 | 3.11e-02 | 27 |
| hsa0493217 | Breast | Precancer | Non-alcoholic fatty liver disease | 48/684 | 155/8465 | 6.16e-17 | 1.50e-15 | 1.15e-15 | 48 |
| hsa0513219 | Breast | Precancer | Salmonella infection | 49/684 | 249/8465 | 2.92e-09 | 6.15e-08 | 4.71e-08 | 49 |
| hsa0513019 | Breast | Precancer | Pathogenic Escherichia coli infection | 38/684 | 197/8465 | 3.12e-07 | 5.81e-06 | 4.45e-06 | 38 |
| hsa0513119 | Breast | Precancer | Shigellosis | 44/684 | 247/8465 | 3.91e-07 | 6.86e-06 | 5.26e-06 | 44 |
| hsa0516719 | Breast | Precancer | Kaposi sarcoma-associated herpesvirus infection | 36/684 | 194/8465 | 1.68e-06 | 2.53e-05 | 1.94e-05 | 36 |
| TF | Cell Type | Tissue | Disease Stage | Target Gene | RSS | Regulon Activity |
| JUN | MLUM | Breast | DCIS | DUSP1,JUNB,MALAT1, etc. | 6.42e-01 |  |
| JUN | CD4TN | Cervix | CC | HSPA1B,DNAJB1,HSPA1A, etc. | 1.26e-01 |  |
| JUN | CD8TEFF | Cervix | CC | HSPA1B,DNAJB1,HSPA1A, etc. | 8.34e-02 | |
| JUN | TFH | Cervix | CC | HSPA1B,DNAJB1,HSPA1A, etc. | 6.17e-02 | |
| JUN | CD8TEXP | Liver | Cirrhotic | HSPA1A,HSPA1B,HSPB1, etc. | 1.35e-01 |  |
| JUN | CD8TCM | Pancreas | PDAC | DNAJB1,HSPA1B,ID2, etc. | 2.45e-01 |  |
| Entrez ID | Symbol | Category | Interaction Types | Drug Claim Name | Drug Name | PMIDs |
| 3725 | JUN | CLINICALLY ACTIONABLE, TRANSCRIPTION FACTOR, DRUGGABLE GENOME, TUMOR SUPPRESSOR, TRANSCRIPTION FACTOR COMPLEX, TRANSCRIPTION FACTOR BINDING | | DIPHENHYDRAMINE HYDROCHLORIDE | DIPHENHYDRAMINE HYDROCHLORIDE | |
| 3725 | JUN | CLINICALLY ACTIONABLE, TRANSCRIPTION FACTOR, DRUGGABLE GENOME, TUMOR SUPPRESSOR, TRANSCRIPTION FACTOR COMPLEX, TRANSCRIPTION FACTOR BINDING | | COLCHICINE | COLCHICINE | |
| 3725 | JUN | CLINICALLY ACTIONABLE, TRANSCRIPTION FACTOR, DRUGGABLE GENOME, TUMOR SUPPRESSOR, TRANSCRIPTION FACTOR COMPLEX, TRANSCRIPTION FACTOR BINDING | | CIPROFIBRATE | CIPROFIBRATE | 16680159 |
| 3725 | JUN | CLINICALLY ACTIONABLE, TRANSCRIPTION FACTOR, DRUGGABLE GENOME, TUMOR SUPPRESSOR, TRANSCRIPTION FACTOR COMPLEX, TRANSCRIPTION FACTOR BINDING | | VINBLASTINE SULFATE | VINBLASTINE SULFATE | |
| 3725 | JUN | CLINICALLY ACTIONABLE, TRANSCRIPTION FACTOR, DRUGGABLE GENOME, TUMOR SUPPRESSOR, TRANSCRIPTION FACTOR COMPLEX, TRANSCRIPTION FACTOR BINDING | | PATULIN | PATULIN | 16680159 |
| 3725 | JUN | CLINICALLY ACTIONABLE, TRANSCRIPTION FACTOR, DRUGGABLE GENOME, TUMOR SUPPRESSOR, TRANSCRIPTION FACTOR COMPLEX, TRANSCRIPTION FACTOR BINDING | | ALPHA-DIFLUOROMETHYLORNITHINE | | 9950818 |
| 3725 | JUN | CLINICALLY ACTIONABLE, TRANSCRIPTION FACTOR, DRUGGABLE GENOME, TUMOR SUPPRESSOR, TRANSCRIPTION FACTOR COMPLEX, TRANSCRIPTION FACTOR BINDING | | METHIMAZOLE | METHIMAZOLE | |
| 3725 | JUN | CLINICALLY ACTIONABLE, TRANSCRIPTION FACTOR, DRUGGABLE GENOME, TUMOR SUPPRESSOR, TRANSCRIPTION FACTOR COMPLEX, TRANSCRIPTION FACTOR BINDING | | DFMO | | 9950818 |
| 3725 | JUN | CLINICALLY ACTIONABLE, TRANSCRIPTION FACTOR, DRUGGABLE GENOME, TUMOR SUPPRESSOR, TRANSCRIPTION FACTOR COMPLEX, TRANSCRIPTION FACTOR BINDING | | 2-MERCAPTOPYRIMIDINE | 2-MERCAPTOPYRIMIDINE | |
| 3725 | JUN | CLINICALLY ACTIONABLE, TRANSCRIPTION FACTOR, DRUGGABLE GENOME, TUMOR SUPPRESSOR, TRANSCRIPTION FACTOR COMPLEX, TRANSCRIPTION FACTOR BINDING | | SODIUM SELENITE | SODIUM SELENITE | |


