
|
|||||
|
 | |
| |
| |
| |
| |
| |
|
Gene: ID2 |
Gene summary for ID2 |
| Gene information | Species | Human | Gene symbol | ID2 | Gene ID | 3398 |
| Gene name | inhibitor of DNA binding 2 | |
| Gene Alias | GIG8 | |
| Cytomap | 2p25.1 | |
| Gene Type | protein-coding | GO ID | GO:0000082 | UniProtAcc | Q02363 |
Top |
Malignant transformation analysis |
| Identification of the aberrant gene expression in precancerous and cancerous lesions by comparing the gene expression of stem-like cells in diseased tissues with normal stem cells |
| Entrez ID | Symbol | Replicates | Species | Organ | Tissue | Adj P-value | Log2FC | Malignancy |
| 3398 | ID2 | GSM4909280 | Human | Breast | Precancer | 3.45e-05 | 7.07e-01 | 0.0305 |
| 3398 | ID2 | GSM4909285 | Human | Breast | IDC | 3.00e-02 | 2.67e-01 | 0.21 |
| 3398 | ID2 | GSM4909290 | Human | Breast | IDC | 1.71e-02 | 3.10e-01 | 0.2096 |
| 3398 | ID2 | GSM4909295 | Human | Breast | IDC | 3.04e-06 | 5.81e-01 | 0.0898 |
| 3398 | ID2 | GSM4909297 | Human | Breast | IDC | 2.82e-06 | 1.53e-01 | 0.1517 |
| 3398 | ID2 | GSM4909298 | Human | Breast | IDC | 4.17e-02 | 1.74e-01 | 0.1551 |
| 3398 | ID2 | GSM4909304 | Human | Breast | IDC | 3.40e-07 | -3.84e-01 | 0.1636 |
| 3398 | ID2 | GSM4909305 | Human | Breast | IDC | 9.89e-06 | 4.04e-01 | 0.0436 |
| 3398 | ID2 | GSM4909306 | Human | Breast | IDC | 2.23e-03 | 3.51e-01 | 0.1564 |
| 3398 | ID2 | GSM4909308 | Human | Breast | IDC | 4.48e-03 | 1.93e-01 | 0.158 |
| 3398 | ID2 | GSM4909311 | Human | Breast | IDC | 6.06e-20 | -3.59e-01 | 0.1534 |
| 3398 | ID2 | GSM4909312 | Human | Breast | IDC | 1.80e-07 | -3.80e-01 | 0.1552 |
| 3398 | ID2 | GSM4909319 | Human | Breast | IDC | 9.66e-22 | -3.19e-01 | 0.1563 |
| 3398 | ID2 | GSM4909321 | Human | Breast | IDC | 3.98e-17 | 5.69e-01 | 0.1559 |
| 3398 | ID2 | NCCBC5 | Human | Breast | DCIS | 5.59e-03 | -2.08e-01 | 0.2046 |
| 3398 | ID2 | P1 | Human | Breast | IDC | 1.61e-07 | -2.36e-01 | 0.1527 |
| 3398 | ID2 | DCIS2 | Human | Breast | DCIS | 3.81e-27 | -1.24e-01 | 0.0085 |
| 3398 | ID2 | CA_HPV_1 | Human | Cervix | CC | 2.02e-05 | -9.19e-02 | 0.0264 |
| 3398 | ID2 | CCI_1 | Human | Cervix | CC | 2.12e-04 | -5.25e-01 | 0.528 |
| 3398 | ID2 | CCI_3 | Human | Cervix | CC | 8.28e-06 | -5.14e-01 | 0.516 |
| Page: 1 2 3 4 5 6 7 8 9 10 11 |
| Tissue | Expression Dynamics | Abbreviation |
| Breast | 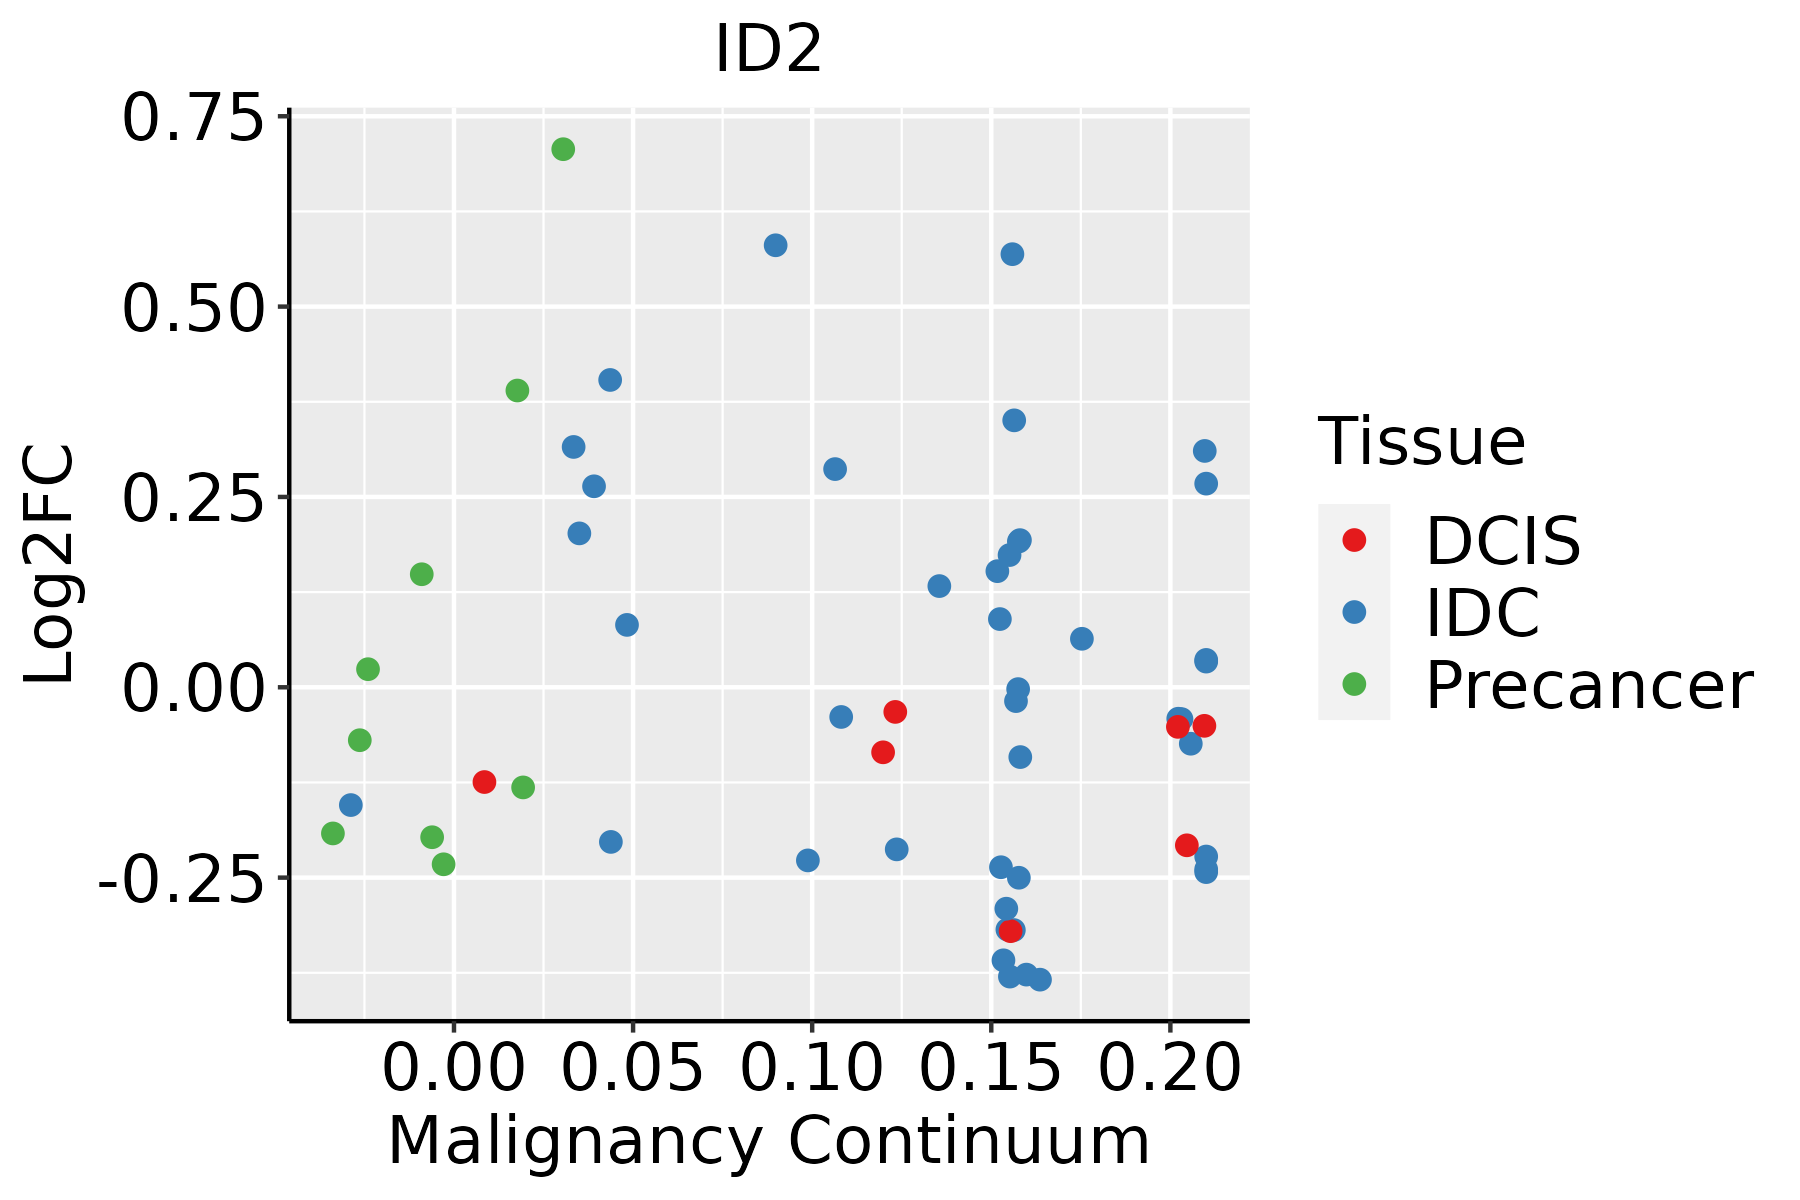 | IDC: Invasive ductal carcinoma |
| DCIS: Ductal carcinoma in situ | ||
| Precancer(BRCA1-mut): Precancerous lesion from BRCA1 mutation carriers | ||
| Cervix | 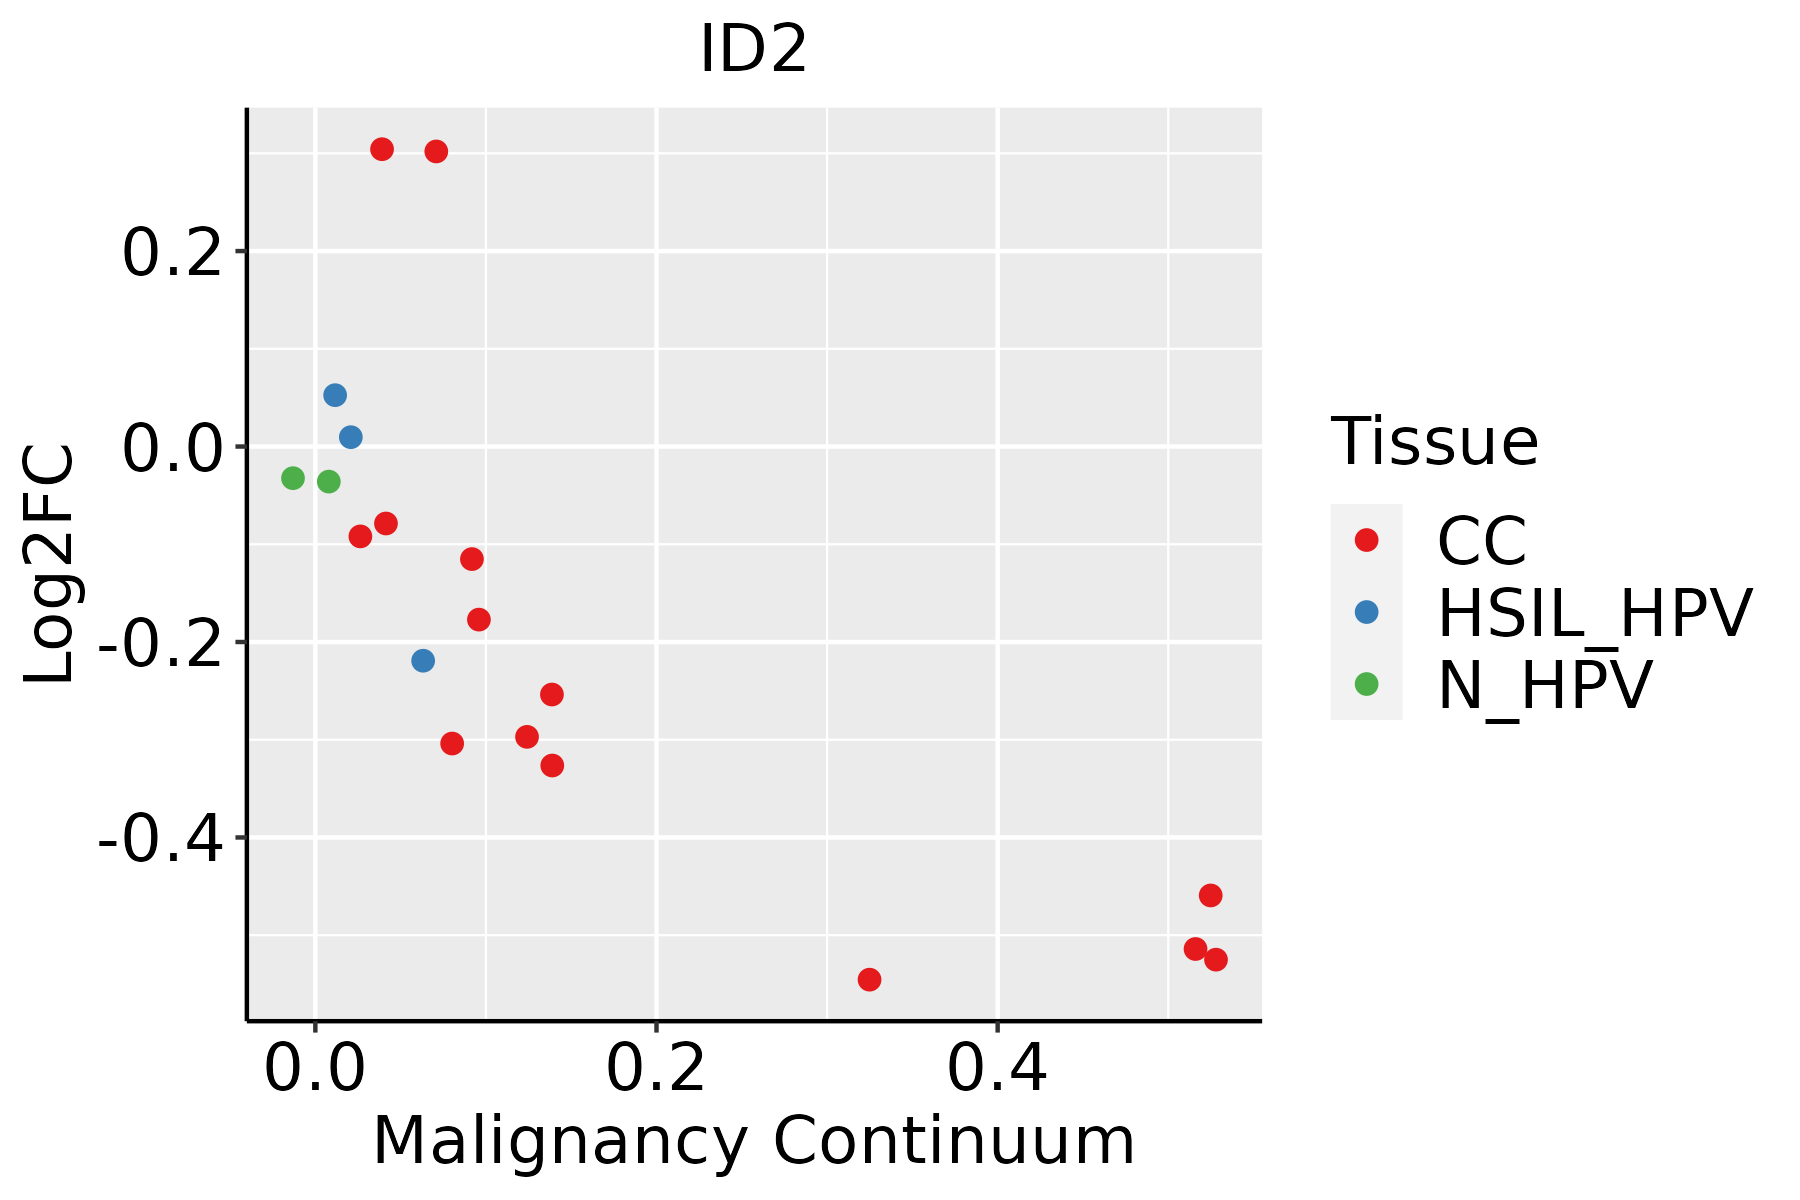 | CC: Cervix cancer |
| HSIL_HPV: HPV-infected high-grade squamous intraepithelial lesions | ||
| N_HPV: HPV-infected normal cervix | ||
| Colorectum (GSE201348) |  | FAP: Familial adenomatous polyposis |
| CRC: Colorectal cancer | ||
| Colorectum (HTA11) |  | AD: Adenomas |
| SER: Sessile serrated lesions | ||
| MSI-H: Microsatellite-high colorectal cancer | ||
| MSS: Microsatellite stable colorectal cancer | ||
| Endometrium |  | AEH: Atypical endometrial hyperplasia |
| EEC: Endometrioid Cancer | ||
| Esophagus |  | ESCC: Esophageal squamous cell carcinoma |
| HGIN: High-grade intraepithelial neoplasias | ||
| LGIN: Low-grade intraepithelial neoplasias | ||
| GC | 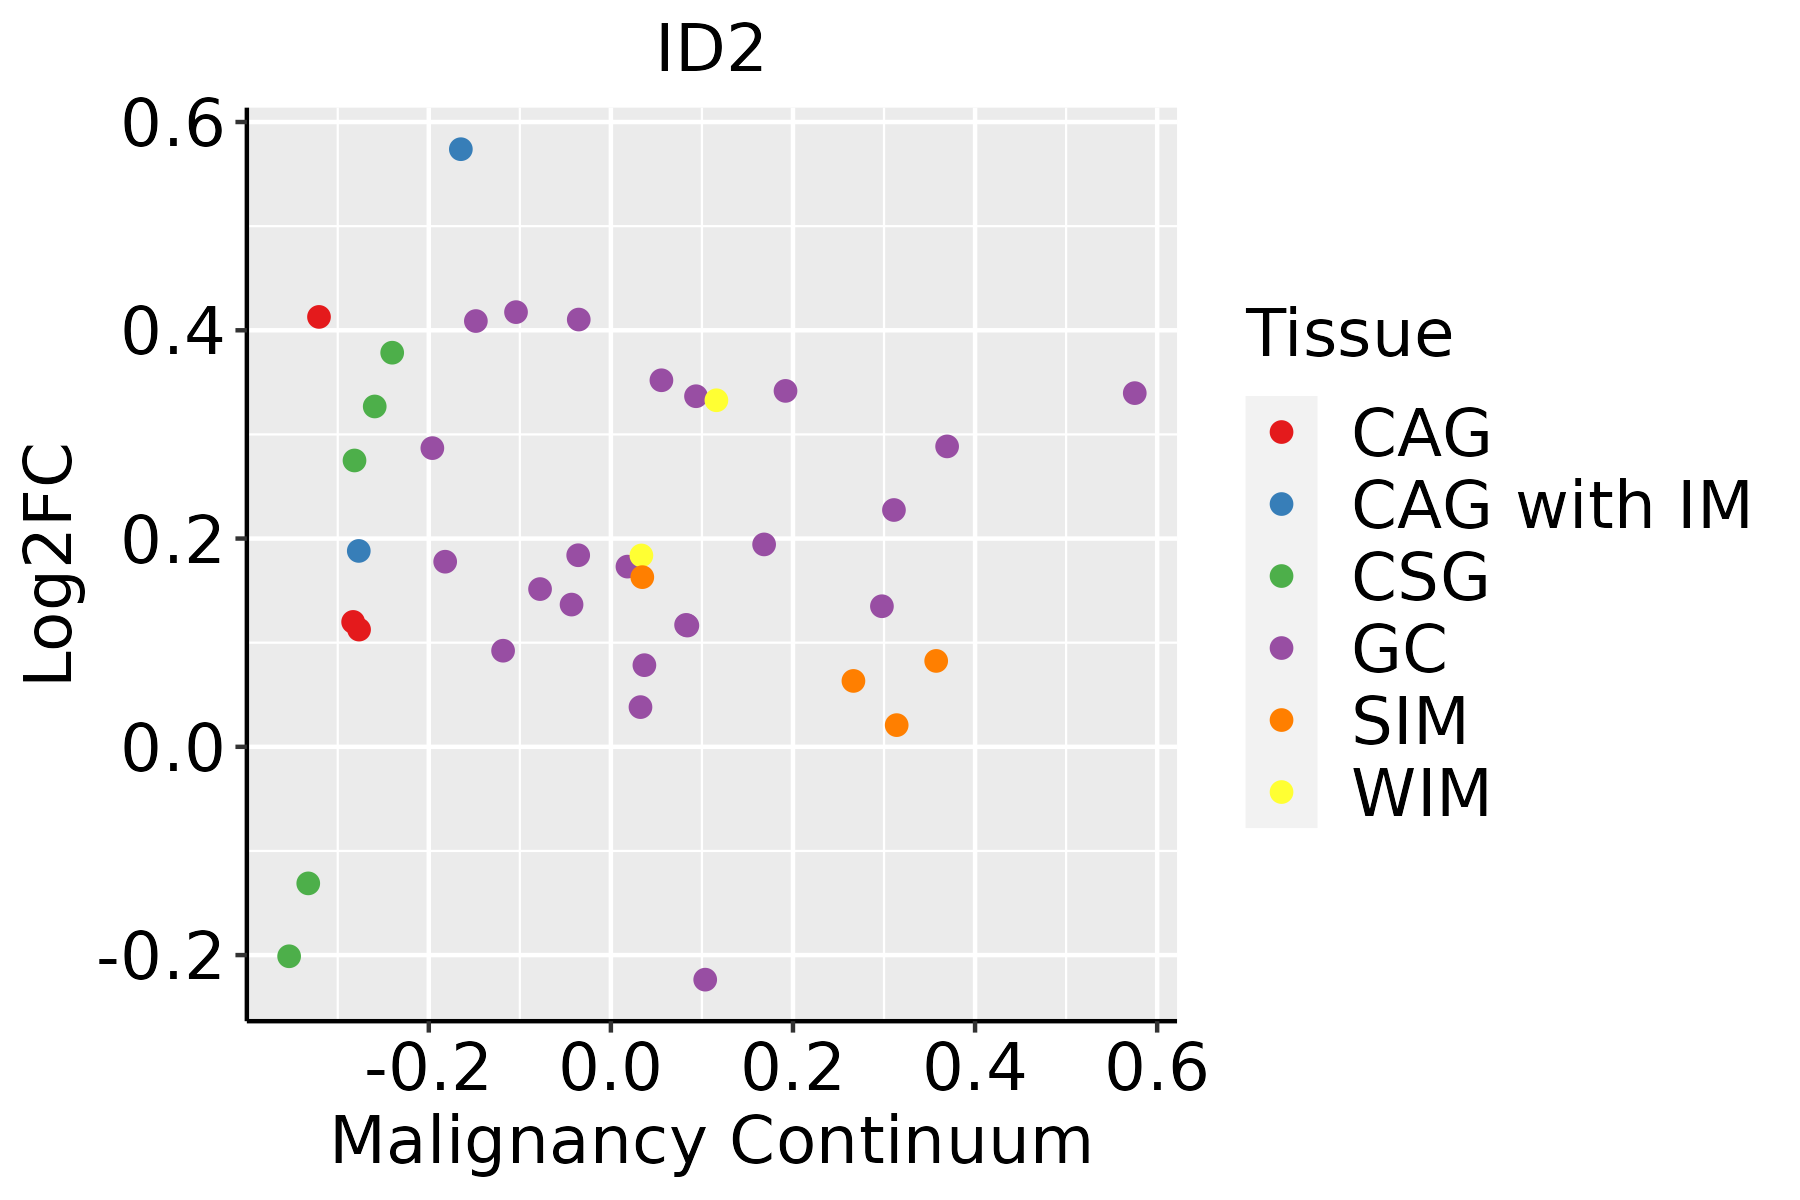 | CAG: Chronic atrophic gastritis |
| CAG with IM: Chronic atrophic gastritis with intestinal metaplasia | ||
| CSG: Chronic superficial gastritis | ||
| GC: Gastric cancer | ||
| SIM: Severe intestinal metaplasia | ||
| WIM: Wild intestinal metaplasia | ||
| Liver | 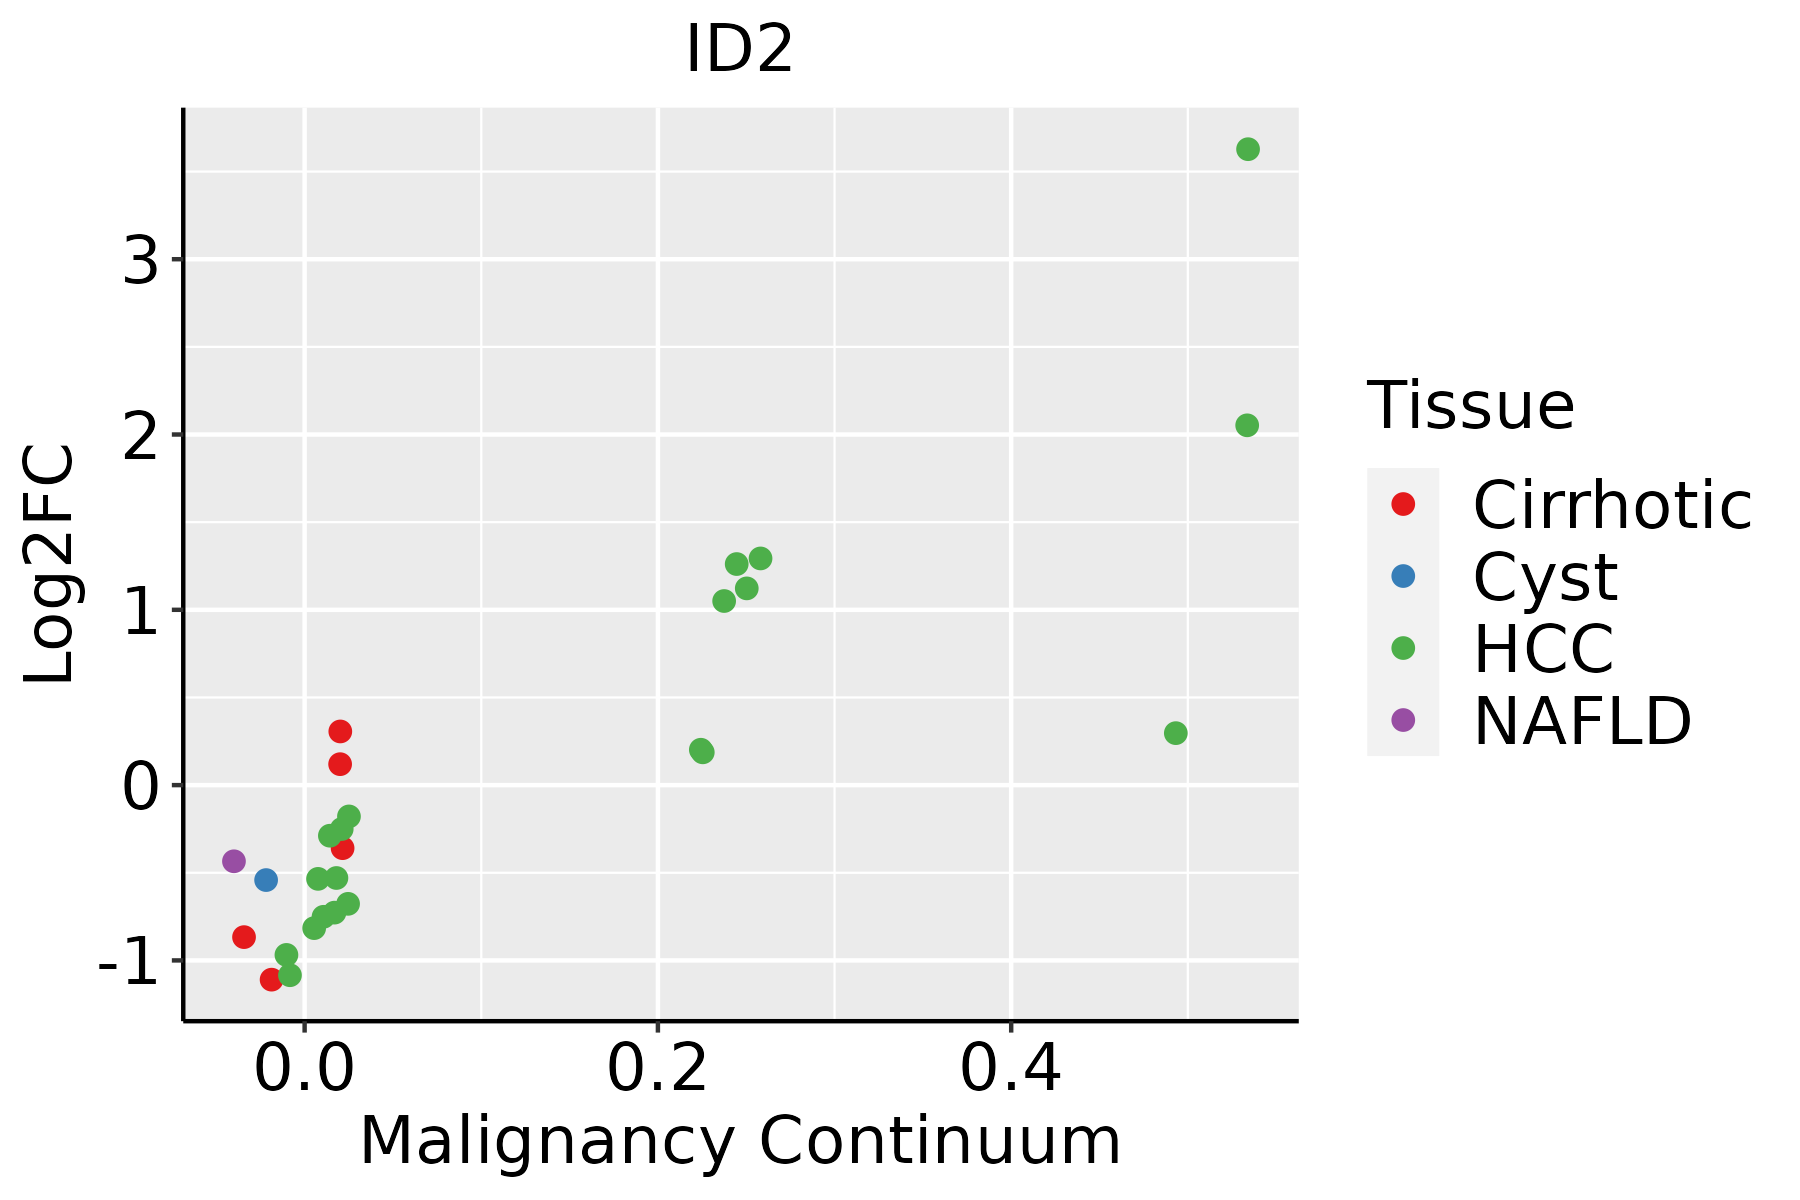 | HCC: Hepatocellular carcinoma |
| NAFLD: Non-alcoholic fatty liver disease | ||
| Oral Cavity | 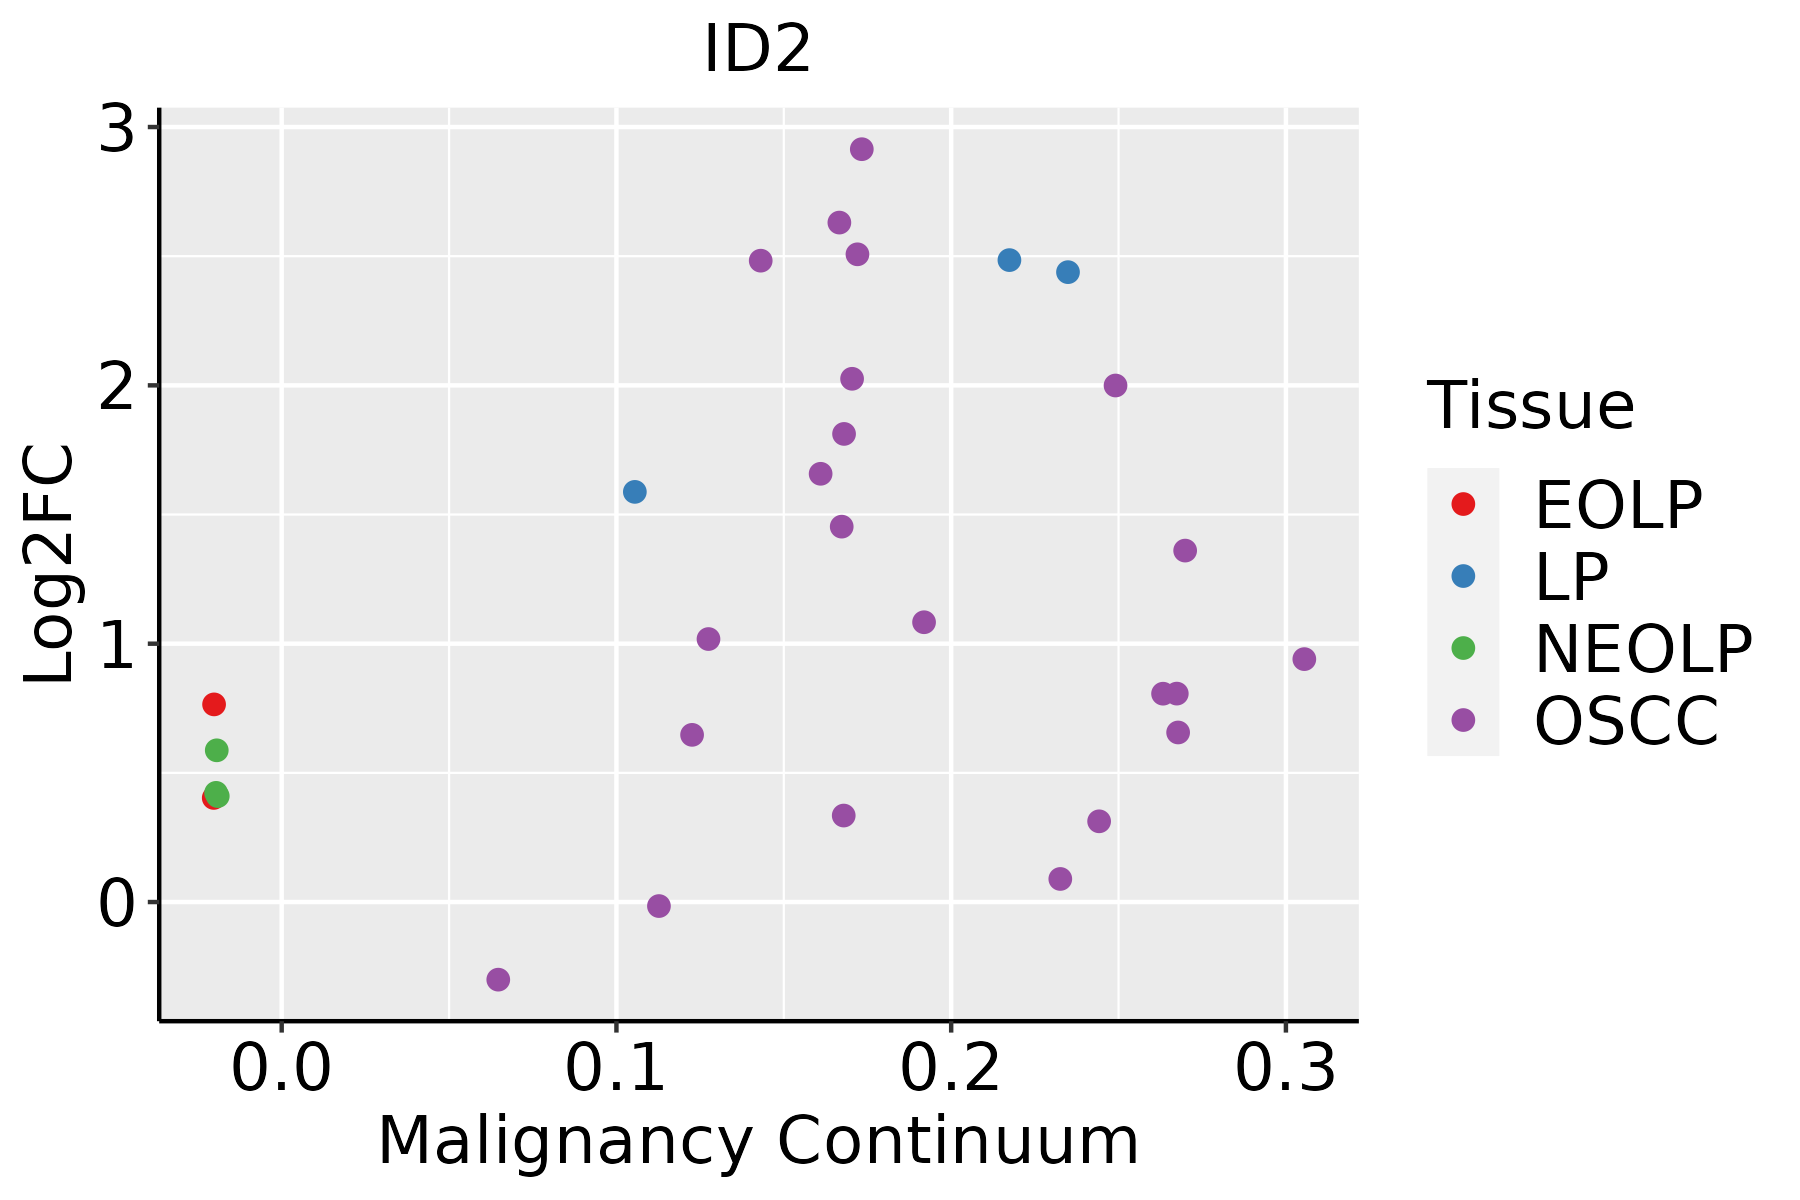 | EOLP: Erosive Oral lichen planus |
| LP: leukoplakia | ||
| NEOLP: Non-erosive oral lichen planus | ||
| OSCC: Oral squamous cell carcinoma | ||
| Prostate | 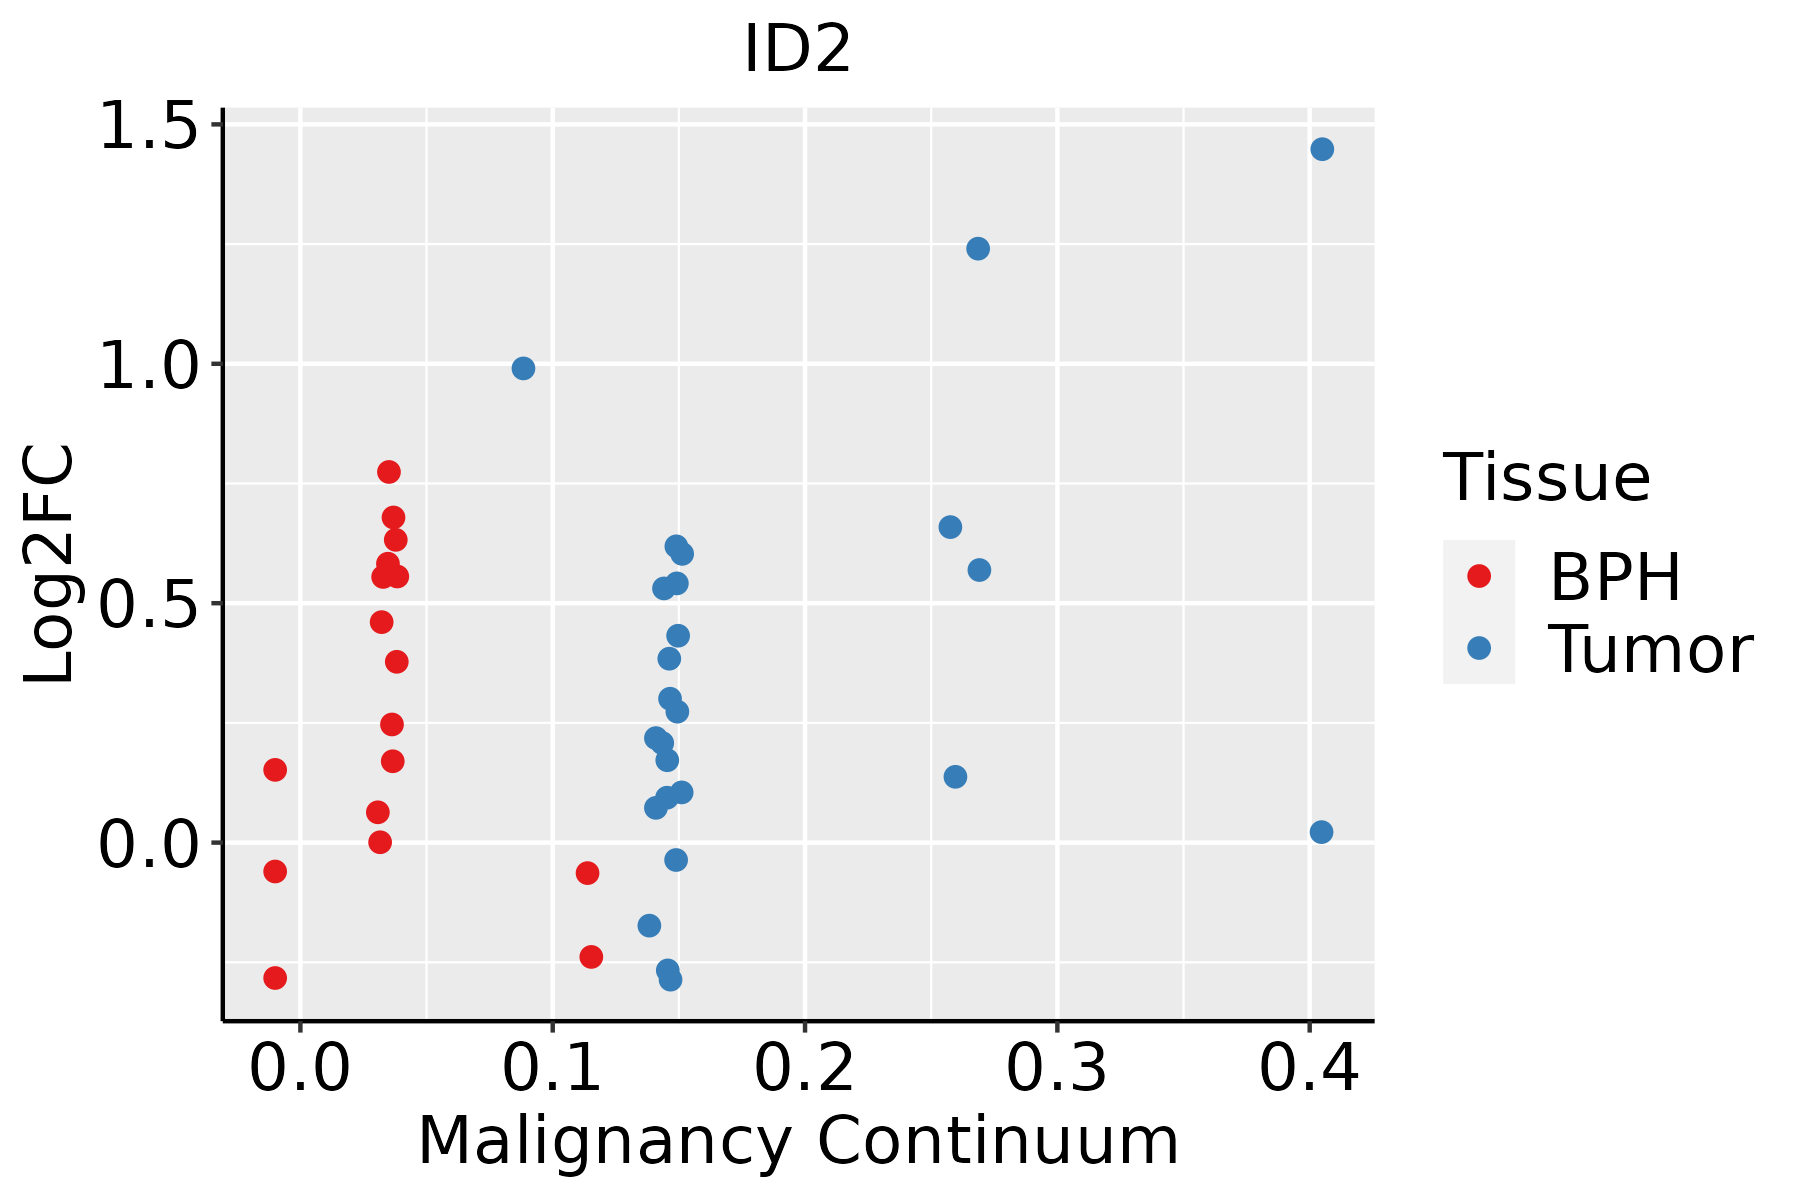 | BPH: Benign Prostatic Hyperplasia |
| Skin | 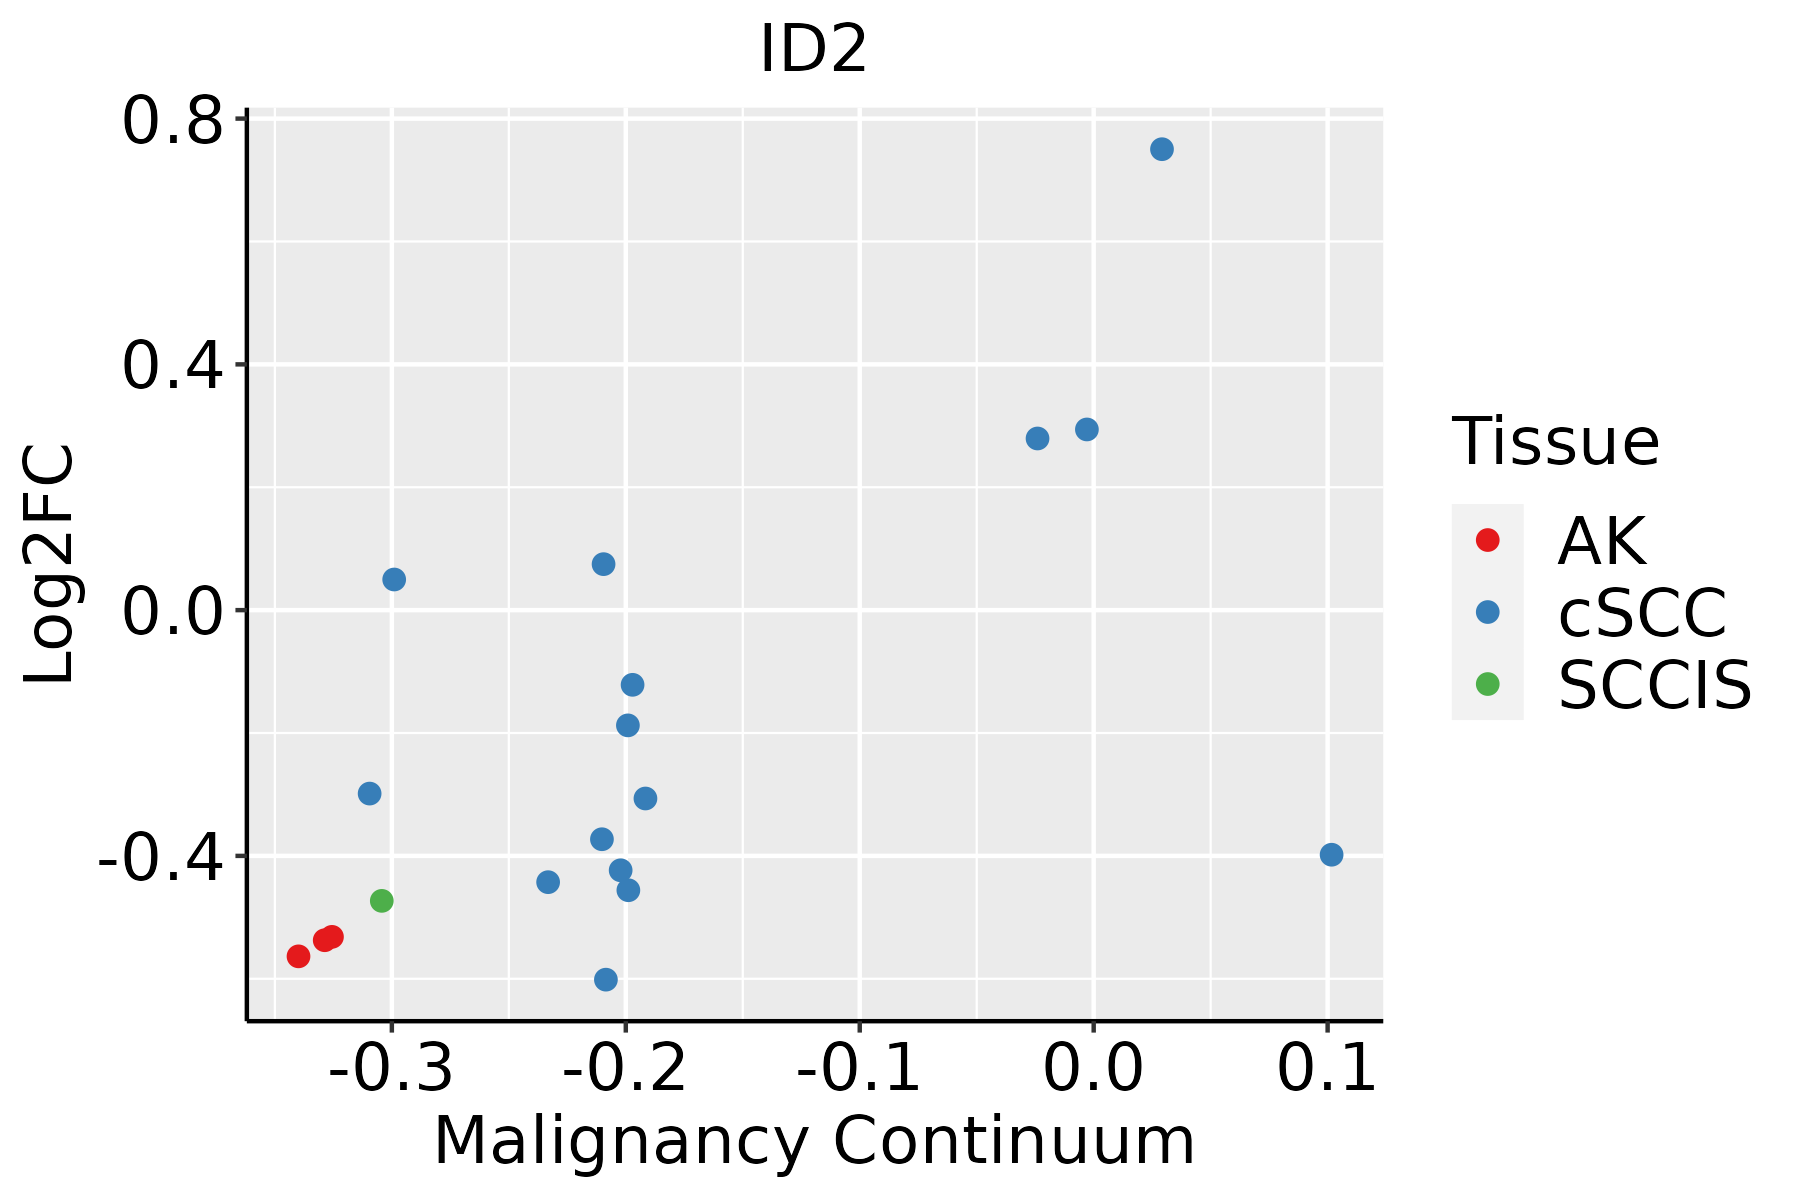 | AK: Actinic keratosis |
| cSCC: Cutaneous squamous cell carcinoma | ||
| SCCIS:squamous cell carcinoma in situ | ||
| Thyroid |  | ATC: Anaplastic thyroid cancer |
| HT: Hashimoto's thyroiditis | ||
| PTC: Papillary thyroid cancer |
| ∗log2FC in expression of this searched gene in stem-like cells from each diseased tissue sample relative to stem-like cells in normal samples in each tissue plotted against the malignancy continuum. Samples are colored based on if they are from different disease stage. |
Top |
Malignant transformation related pathway analysis |
| Find out the enriched GO biological processes and KEGG pathways involved in transition from healthy to precancer to cancer |
| Tissue | Disease Stage | Enriched GO biological Processes |
| Esophagus | ESCC |  |
| Skin | AK |  |
| Skin | SCCIS |  |
| Skin | cSCC |  |
| Thyroid | HT |  |
| ∗Top 15 enriched GO BP terms are showed in the bar plot of each disease state in each tissue. Each row represents a significant GO biological process which is colored according to the -log10(p.adjust). |
| Page: 1 2 3 4 5 6 7 8 9 |
| GO ID | Tissue | Disease Stage | Description | Gene Ratio | Bg Ratio | pvalue | p.adjust | Count |
| GO:00022629 | Breast | Precancer | myeloid cell homeostasis | 27/1080 | 157/18723 | 3.10e-07 | 1.49e-05 | 27 |
| GO:00341019 | Breast | Precancer | erythrocyte homeostasis | 23/1080 | 129/18723 | 1.20e-06 | 4.60e-05 | 23 |
| GO:00300999 | Breast | Precancer | myeloid cell differentiation | 45/1080 | 381/18723 | 4.00e-06 | 1.25e-04 | 45 |
| GO:00075688 | Breast | Precancer | aging | 41/1080 | 339/18723 | 5.95e-06 | 1.71e-04 | 41 |
| GO:00487329 | Breast | Precancer | gland development | 49/1080 | 436/18723 | 6.11e-06 | 1.73e-04 | 49 |
| GO:00456379 | Breast | Precancer | regulation of myeloid cell differentiation | 28/1080 | 210/18723 | 3.05e-05 | 6.72e-04 | 28 |
| GO:19037069 | Breast | Precancer | regulation of hemopoiesis | 41/1080 | 367/18723 | 3.95e-05 | 8.52e-04 | 41 |
| GO:00506736 | Breast | Precancer | epithelial cell proliferation | 46/1080 | 437/18723 | 6.02e-05 | 1.23e-03 | 46 |
| GO:00025737 | Breast | Precancer | myeloid leukocyte differentiation | 27/1080 | 208/18723 | 6.72e-05 | 1.35e-03 | 27 |
| GO:00335983 | Breast | Precancer | mammary gland epithelial cell proliferation | 8/1080 | 26/18723 | 7.33e-05 | 1.44e-03 | 8 |
| GO:00093148 | Breast | Precancer | response to radiation | 47/1080 | 456/18723 | 8.39e-05 | 1.62e-03 | 47 |
| GO:00488729 | Breast | Precancer | homeostasis of number of cells | 32/1080 | 272/18723 | 1.03e-04 | 1.89e-03 | 32 |
| GO:19021055 | Breast | Precancer | regulation of leukocyte differentiation | 32/1080 | 279/18723 | 1.66e-04 | 2.74e-03 | 32 |
| GO:00302189 | Breast | Precancer | erythrocyte differentiation | 18/1080 | 120/18723 | 1.76e-04 | 2.87e-03 | 18 |
| GO:19031313 | Breast | Precancer | mononuclear cell differentiation | 43/1080 | 426/18723 | 2.61e-04 | 3.84e-03 | 43 |
| GO:00420633 | Breast | Precancer | gliogenesis | 33/1080 | 301/18723 | 3.06e-04 | 4.40e-03 | 33 |
| GO:00027613 | Breast | Precancer | regulation of myeloid leukocyte differentiation | 17/1080 | 120/18723 | 5.23e-04 | 6.74e-03 | 17 |
| GO:19021063 | Breast | Precancer | negative regulation of leukocyte differentiation | 15/1080 | 102/18723 | 7.34e-04 | 8.80e-03 | 15 |
| GO:00454444 | Breast | Precancer | fat cell differentiation | 26/1080 | 229/18723 | 7.60e-04 | 9.04e-03 | 26 |
| GO:00192164 | Breast | Precancer | regulation of lipid metabolic process | 34/1080 | 331/18723 | 8.14e-04 | 9.55e-03 | 34 |
| Page: 1 2 3 4 5 6 7 8 9 10 11 12 13 14 15 16 17 18 19 20 21 22 23 24 25 26 27 28 29 30 31 32 33 34 35 36 37 38 39 40 41 42 43 44 45 46 47 48 49 50 51 52 53 54 55 56 57 58 59 60 61 62 63 64 65 66 67 68 69 70 71 72 73 74 75 76 77 78 79 80 81 82 83 84 85 86 87 88 89 90 91 92 93 94 95 96 97 98 99 100 101 102 103 104 105 106 107 108 109 110 111 112 113 114 |
| Pathway ID | Tissue | Disease Stage | Description | Gene Ratio | Bg Ratio | pvalue | p.adjust | qvalue | Count |
| hsa043908 | Cervix | CC | Hippo signaling pathway | 40/1267 | 157/8465 | 3.64e-04 | 1.82e-03 | 1.07e-03 | 40 |
| hsa0439013 | Cervix | CC | Hippo signaling pathway | 40/1267 | 157/8465 | 3.64e-04 | 1.82e-03 | 1.07e-03 | 40 |
| hsa04350 | Colorectum | SER | TGF-beta signaling pathway | 31/1580 | 108/8465 | 7.00e-03 | 3.77e-02 | 2.74e-02 | 31 |
| hsa043501 | Colorectum | SER | TGF-beta signaling pathway | 31/1580 | 108/8465 | 7.00e-03 | 3.77e-02 | 2.74e-02 | 31 |
| hsa04390 | Colorectum | MSS | Hippo signaling pathway | 48/1875 | 157/8465 | 8.32e-03 | 3.10e-02 | 1.90e-02 | 48 |
| hsa043901 | Colorectum | MSS | Hippo signaling pathway | 48/1875 | 157/8465 | 8.32e-03 | 3.10e-02 | 1.90e-02 | 48 |
| hsa043909 | Endometrium | AEH | Hippo signaling pathway | 38/1197 | 157/8465 | 4.79e-04 | 3.38e-03 | 2.47e-03 | 38 |
| hsa043504 | Endometrium | AEH | TGF-beta signaling pathway | 26/1197 | 108/8465 | 3.82e-03 | 2.18e-02 | 1.59e-02 | 26 |
| hsa0439014 | Endometrium | AEH | Hippo signaling pathway | 38/1197 | 157/8465 | 4.79e-04 | 3.38e-03 | 2.47e-03 | 38 |
| hsa0435011 | Endometrium | AEH | TGF-beta signaling pathway | 26/1197 | 108/8465 | 3.82e-03 | 2.18e-02 | 1.59e-02 | 26 |
| hsa0439023 | Endometrium | EEC | Hippo signaling pathway | 39/1237 | 157/8465 | 4.54e-04 | 3.47e-03 | 2.59e-03 | 39 |
| hsa043502 | Endometrium | EEC | TGF-beta signaling pathway | 26/1237 | 108/8465 | 5.95e-03 | 3.12e-02 | 2.33e-02 | 26 |
| hsa0439033 | Endometrium | EEC | Hippo signaling pathway | 39/1237 | 157/8465 | 4.54e-04 | 3.47e-03 | 2.59e-03 | 39 |
| hsa043503 | Endometrium | EEC | TGF-beta signaling pathway | 26/1237 | 108/8465 | 5.95e-03 | 3.12e-02 | 2.33e-02 | 26 |
| hsa043507 | Esophagus | ESCC | TGF-beta signaling pathway | 69/4205 | 108/8465 | 1.92e-03 | 5.54e-03 | 2.84e-03 | 69 |
| hsa052028 | Esophagus | ESCC | Transcriptional misregulation in cancer | 116/4205 | 193/8465 | 2.08e-03 | 5.95e-03 | 3.05e-03 | 116 |
| hsa0439018 | Esophagus | ESCC | Hippo signaling pathway | 92/4205 | 157/8465 | 1.46e-02 | 3.31e-02 | 1.69e-02 | 92 |
| hsa0435014 | Esophagus | ESCC | TGF-beta signaling pathway | 69/4205 | 108/8465 | 1.92e-03 | 5.54e-03 | 2.84e-03 | 69 |
| hsa0520213 | Esophagus | ESCC | Transcriptional misregulation in cancer | 116/4205 | 193/8465 | 2.08e-03 | 5.95e-03 | 3.05e-03 | 116 |
| hsa0439019 | Esophagus | ESCC | Hippo signaling pathway | 92/4205 | 157/8465 | 1.46e-02 | 3.31e-02 | 1.69e-02 | 92 |
| Page: 1 2 |
Top |
Cell-cell communication analysis |
| Identification of potential cell-cell interactions between two cell types and their ligand-receptor pairs for different disease states |
| Ligand | Receptor | LRpair | Pathway | Tissue | Disease Stage |
| Page: 1 |
Top |
Single-cell gene regulatory network inference analysis |
| Find out the significant the regulons (TFs) and the target genes of each regulon across cell types for different disease states |
| TF | Cell Type | Tissue | Disease Stage | Target Gene | RSS | Regulon Activity |
| ∗The dot plots of a searched regulon are shown for all cell subpopulations in each disease state of each tissue based on the regulon specific score inferred using pySCENIC and by calculating the average expression. |
| Page: 1 |
Top |
Somatic mutation of malignant transformation related genes |
| Annotation of somatic variants for genes involved in malignant transformation |
| Hugo Symbol | Variant Class | Variant Classification | dbSNP RS | HGVSc | HGVSp | HGVSp Short | SWISSPROT | BIOTYPE | SIFT | PolyPhen | Tumor Sample Barcode | Tissue | Histology | Sex | Age | Stage | Therapy Types | Drugs | Outcome |
| ID2 | SNV | Missense_Mutation | c.254T>C | p.Ile85Thr | p.I85T | Q02363 | protein_coding | tolerated(0.12) | benign(0.037) | TCGA-A1-A0SM-01 | Breast | breast invasive carcinoma | Male | >=65 | I/II | Unknown | Unknown | SD | |
| ID2 | SNV | Missense_Mutation | c.203N>C | p.Val68Ala | p.V68A | Q02363 | protein_coding | deleterious(0) | probably_damaging(0.915) | TCGA-A5-A0VP-01 | Endometrium | uterine corpus endometrioid carcinoma | Female | >=65 | I/II | Unknown | Unknown | SD | |
| ID2 | SNV | Missense_Mutation | novel | c.127N>G | p.Tyr43Asp | p.Y43D | Q02363 | protein_coding | deleterious(0) | probably_damaging(1) | TCGA-AP-A1DV-01 | Endometrium | uterine corpus endometrioid carcinoma | Female | <65 | I/II | Unknown | Unknown | SD |
| ID2 | SNV | Missense_Mutation | novel | c.174G>T | p.Lys58Asn | p.K58N | Q02363 | protein_coding | tolerated(0.12) | benign(0.015) | TCGA-AX-A2HC-01 | Endometrium | uterine corpus endometrioid carcinoma | Female | <65 | III/IV | Chemotherapy | paclitaxel | PD |
| ID2 | SNV | Missense_Mutation | novel | c.49G>A | p.Asp17Asn | p.D17N | Q02363 | protein_coding | deleterious(0) | benign(0.021) | TCGA-62-A470-01 | Lung | lung adenocarcinoma | Male | >=65 | I/II | Unknown | Unknown | PD |
| ID2 | SNV | Missense_Mutation | c.47N>T | p.Ser16Leu | p.S16L | Q02363 | protein_coding | deleterious(0.03) | benign(0.086) | TCGA-69-7761-01 | Lung | lung adenocarcinoma | Male | >=65 | I/II | Chemotherapy | alimta | SD | |
| ID2 | SNV | Missense_Mutation | c.384N>G | p.Asp128Glu | p.D128E | Q02363 | protein_coding | tolerated(0.13) | benign(0.005) | TCGA-95-7039-01 | Lung | lung adenocarcinoma | Female | <65 | I/II | Unknown | Unknown | PD | |
| ID2 | SNV | Missense_Mutation | novel | c.266N>G | p.His89Arg | p.H89R | Q02363 | protein_coding | tolerated(0.33) | benign(0.039) | TCGA-BA-A4II-01 | Oral cavity | head & neck squamous cell carcinoma | Male | <65 | I/II | Unknown | Unknown | PD |
| ID2 | SNV | Missense_Mutation | novel | c.38N>G | p.Asn13Ser | p.N13S | Q02363 | protein_coding | tolerated(0.77) | benign(0) | TCGA-HU-A4G8-01 | Stomach | stomach adenocarcinoma | Female | >=65 | I/II | Chemotherapy | 5-fluorouracil | SD |
| ID2 | SNV | Missense_Mutation | c.242N>T | p.Ser81Leu | p.S81L | Q02363 | protein_coding | tolerated(0.06) | benign(0) | TCGA-EM-A1YB-01 | Thyroid | thyroid carcinoma | Female | >=65 | I/II | Unknown | Unknown | SD |
| Page: 1 |
Top |
Related drugs of malignant transformation related genes |
| Identification of chemicals and drugs interact with genes involved in malignant transfromation |
| (DGIdb 4.0) |
| Entrez ID | Symbol | Category | Interaction Types | Drug Claim Name | Drug Name | PMIDs |
| Page: 1 |

Copyright 2023-Present -The University of Texas Health Science Center at Houston |