
|
|||||
|
 | |
| |
| |
| |
| |
| |
|
Gene: FNBP4 |
Gene summary for FNBP4 |
| Gene information | Species | Human | Gene symbol | FNBP4 | Gene ID | 23360 |
| Gene name | formin binding protein 4 | |
| Gene Alias | FBP30 | |
| Cytomap | 11p11.2 | |
| Gene Type | protein-coding | GO ID | GO:0005575 | UniProtAcc | Q8N3X1 |
Top |
Malignant transformation analysis |
| Identification of the aberrant gene expression in precancerous and cancerous lesions by comparing the gene expression of stem-like cells in diseased tissues with normal stem cells |
| Entrez ID | Symbol | Replicates | Species | Organ | Tissue | Adj P-value | Log2FC | Malignancy |
| 23360 | FNBP4 | HTA11_3410_2000001011 | Human | Colorectum | AD | 9.43e-06 | -2.34e-01 | 0.0155 |
| 23360 | FNBP4 | HTA11_99999970781_79442 | Human | Colorectum | MSS | 1.04e-05 | 5.48e-01 | 0.294 |
| 23360 | FNBP4 | HTA11_99999965062_69753 | Human | Colorectum | MSI-H | 1.40e-02 | 8.41e-01 | 0.3487 |
| 23360 | FNBP4 | HTA11_99999971662_82457 | Human | Colorectum | MSS | 1.43e-02 | 5.88e-01 | 0.3859 |
| 23360 | FNBP4 | A002-C-010 | Human | Colorectum | FAP | 4.59e-03 | -1.54e-01 | 0.242 |
| 23360 | FNBP4 | A001-C-207 | Human | Colorectum | FAP | 1.70e-04 | -1.05e-01 | 0.1278 |
| 23360 | FNBP4 | A015-C-203 | Human | Colorectum | FAP | 2.12e-30 | -8.30e-02 | -0.1294 |
| 23360 | FNBP4 | A015-C-204 | Human | Colorectum | FAP | 2.56e-04 | -8.98e-02 | -0.0228 |
| 23360 | FNBP4 | A014-C-040 | Human | Colorectum | FAP | 5.94e-04 | -1.49e-01 | -0.1184 |
| 23360 | FNBP4 | A002-C-201 | Human | Colorectum | FAP | 6.79e-12 | -2.20e-01 | 0.0324 |
| 23360 | FNBP4 | A002-C-203 | Human | Colorectum | FAP | 1.48e-03 | -1.81e-01 | 0.2786 |
| 23360 | FNBP4 | A001-C-119 | Human | Colorectum | FAP | 3.18e-12 | 2.01e-01 | -0.1557 |
| 23360 | FNBP4 | A001-C-108 | Human | Colorectum | FAP | 9.64e-18 | -4.59e-02 | -0.0272 |
| 23360 | FNBP4 | A002-C-205 | Human | Colorectum | FAP | 2.32e-26 | -9.87e-02 | -0.1236 |
| 23360 | FNBP4 | A001-C-104 | Human | Colorectum | FAP | 1.47e-04 | 7.83e-02 | 0.0184 |
| 23360 | FNBP4 | A015-C-005 | Human | Colorectum | FAP | 2.25e-02 | 1.12e-01 | -0.0336 |
| 23360 | FNBP4 | A015-C-006 | Human | Colorectum | FAP | 9.43e-19 | -4.93e-04 | -0.0994 |
| 23360 | FNBP4 | A015-C-106 | Human | Colorectum | FAP | 2.75e-11 | -1.73e-01 | -0.0511 |
| 23360 | FNBP4 | A002-C-114 | Human | Colorectum | FAP | 3.77e-20 | -3.31e-02 | -0.1561 |
| 23360 | FNBP4 | A015-C-104 | Human | Colorectum | FAP | 1.82e-32 | -1.98e-02 | -0.1899 |
| Page: 1 2 3 4 5 6 7 8 9 10 |
| Tissue | Expression Dynamics | Abbreviation |
| Colorectum (GSE201348) |  | FAP: Familial adenomatous polyposis |
| CRC: Colorectal cancer | ||
| Colorectum (HTA11) |  | AD: Adenomas |
| SER: Sessile serrated lesions | ||
| MSI-H: Microsatellite-high colorectal cancer | ||
| MSS: Microsatellite stable colorectal cancer | ||
| Esophagus | 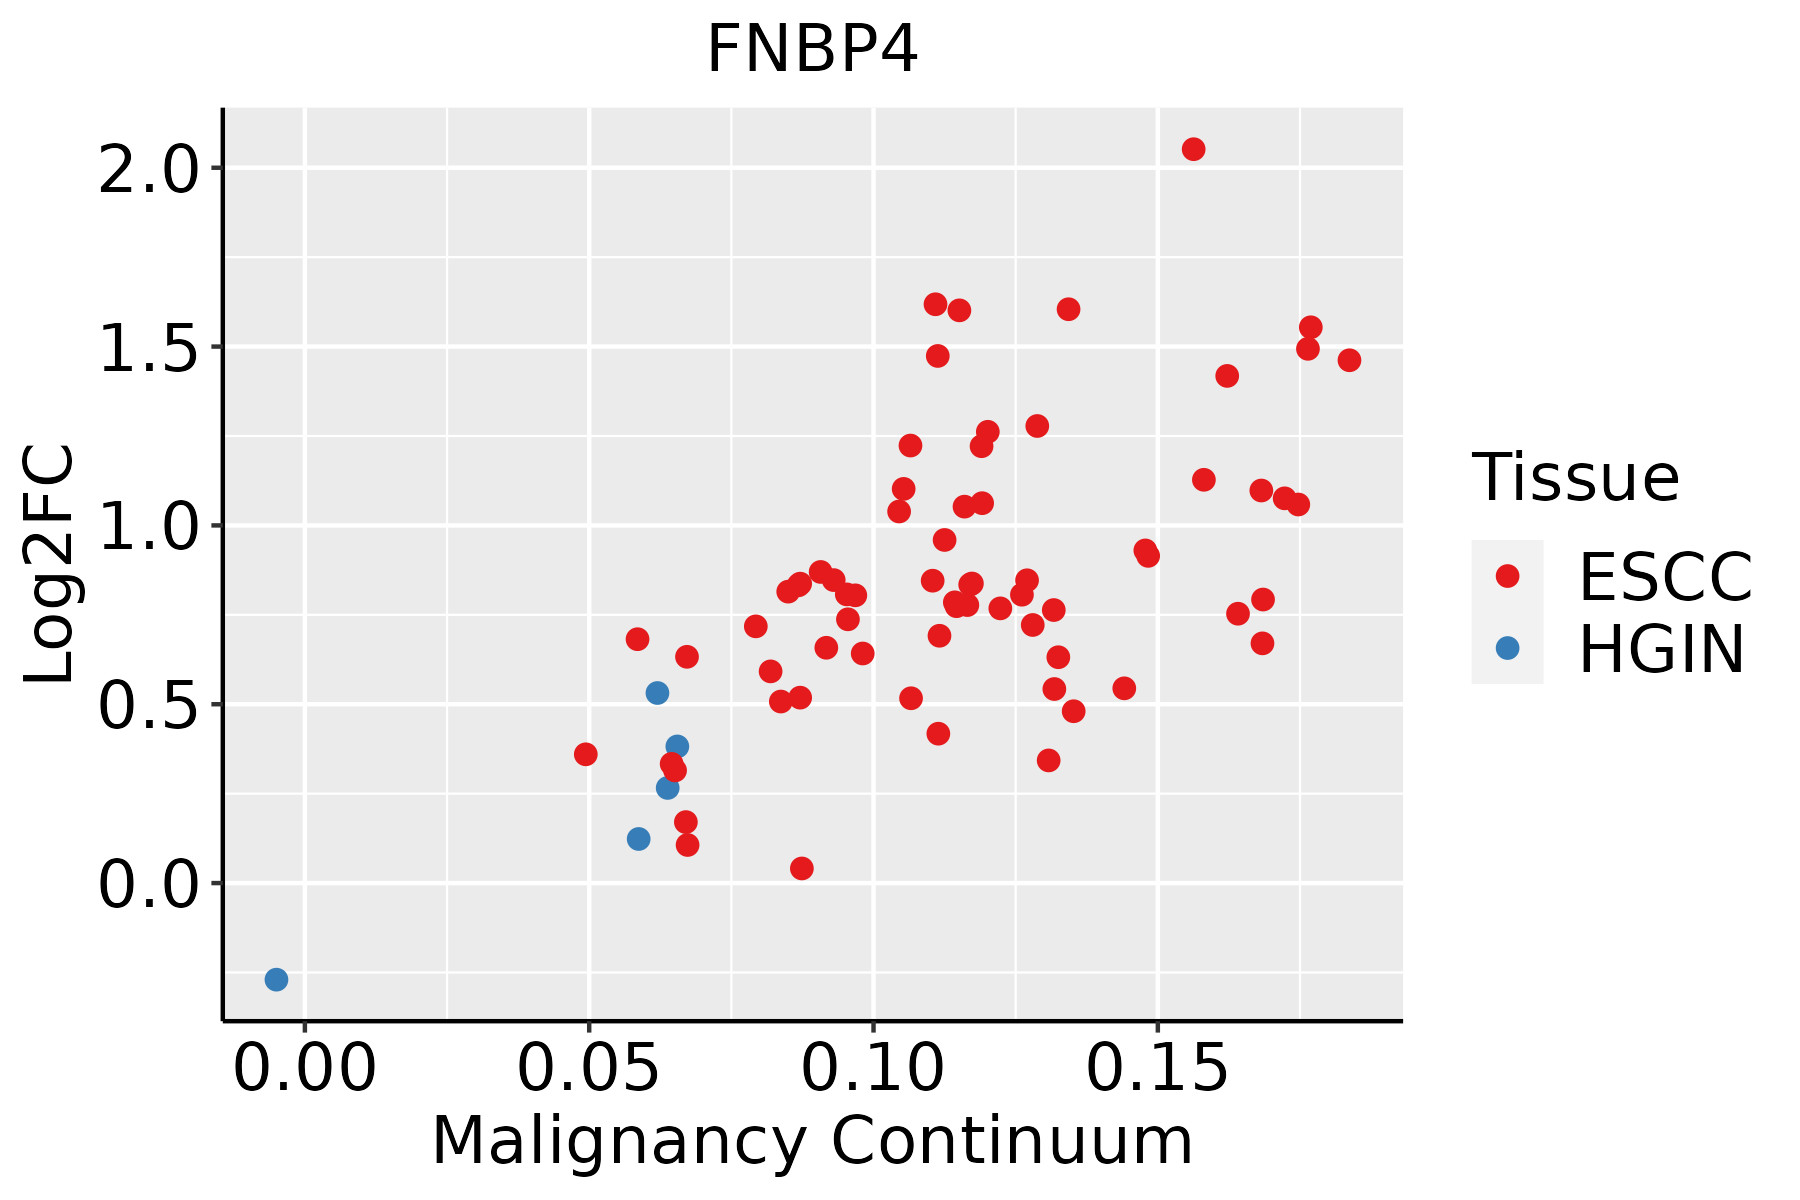 | ESCC: Esophageal squamous cell carcinoma |
| HGIN: High-grade intraepithelial neoplasias | ||
| LGIN: Low-grade intraepithelial neoplasias | ||
| Liver | 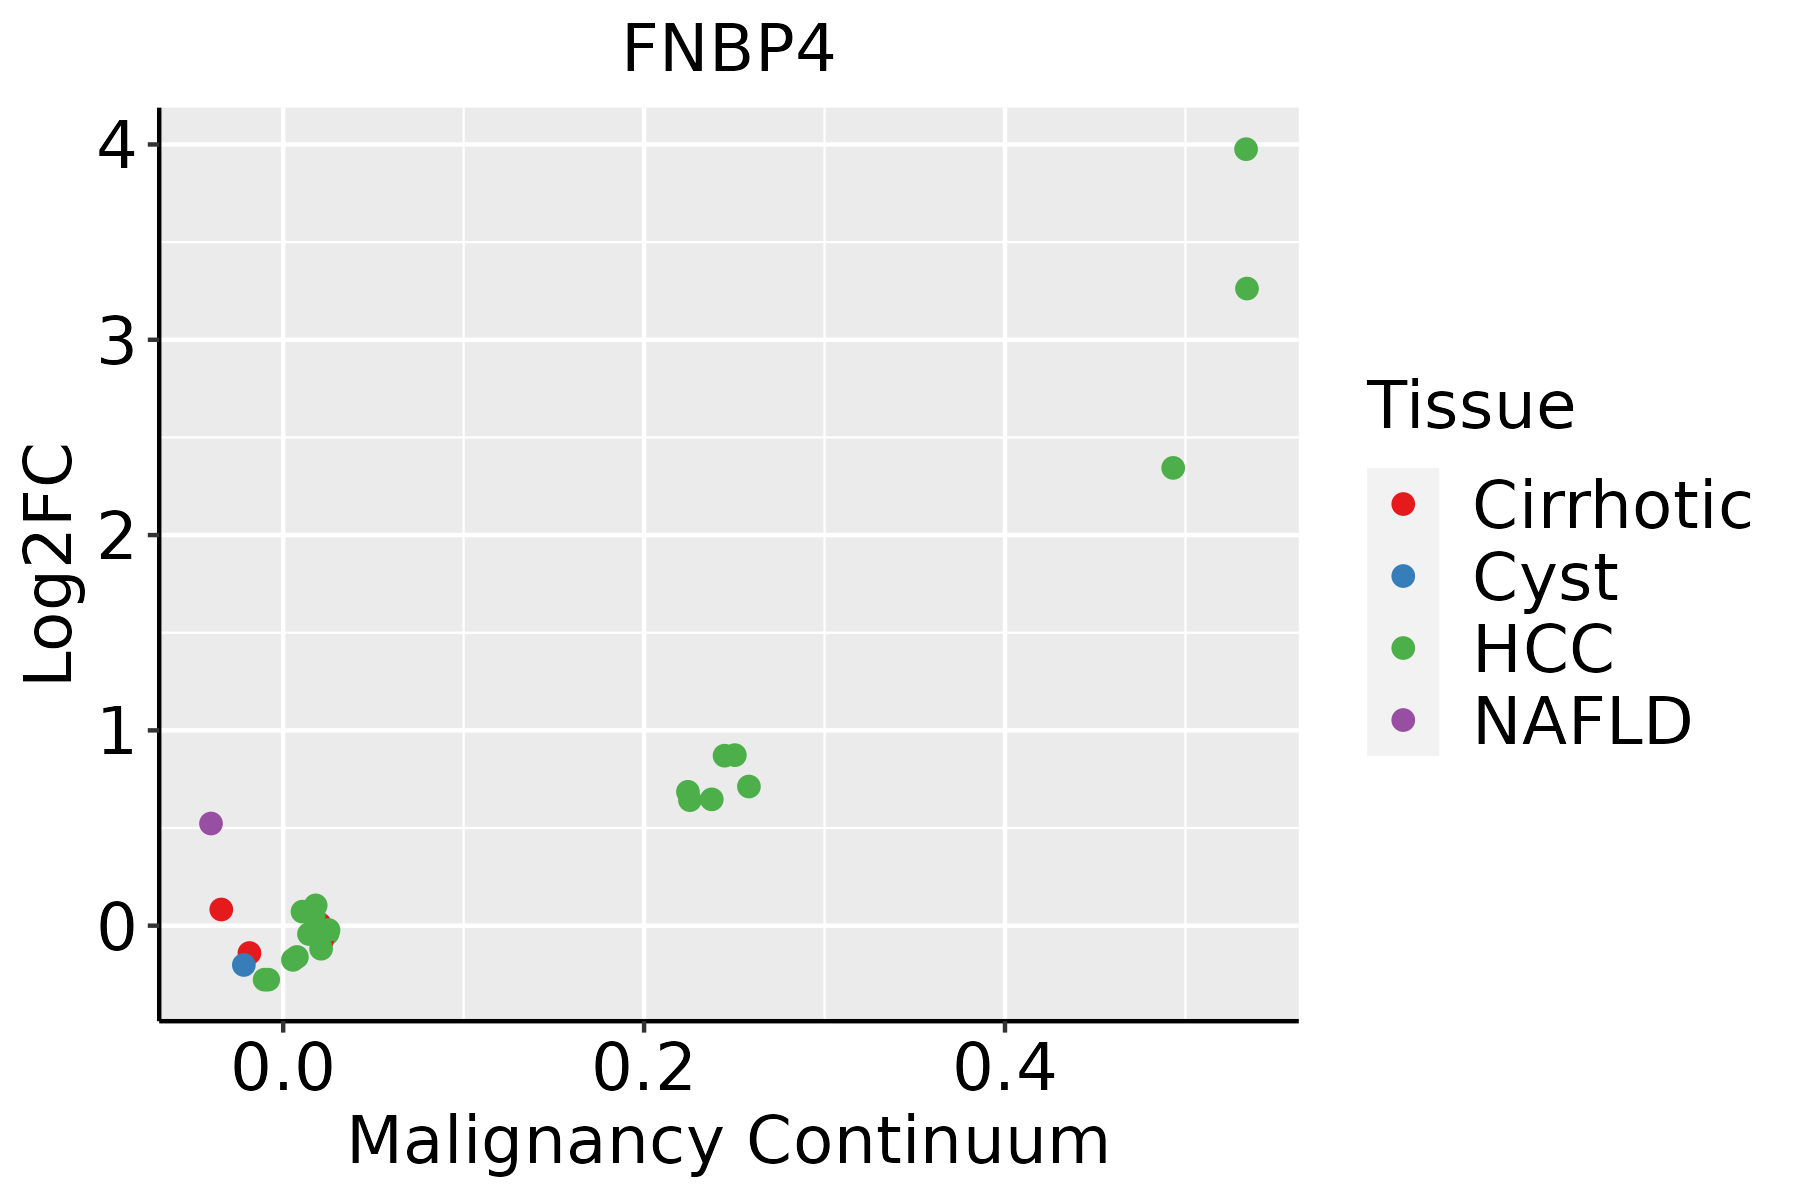 | HCC: Hepatocellular carcinoma |
| NAFLD: Non-alcoholic fatty liver disease | ||
| Lung | 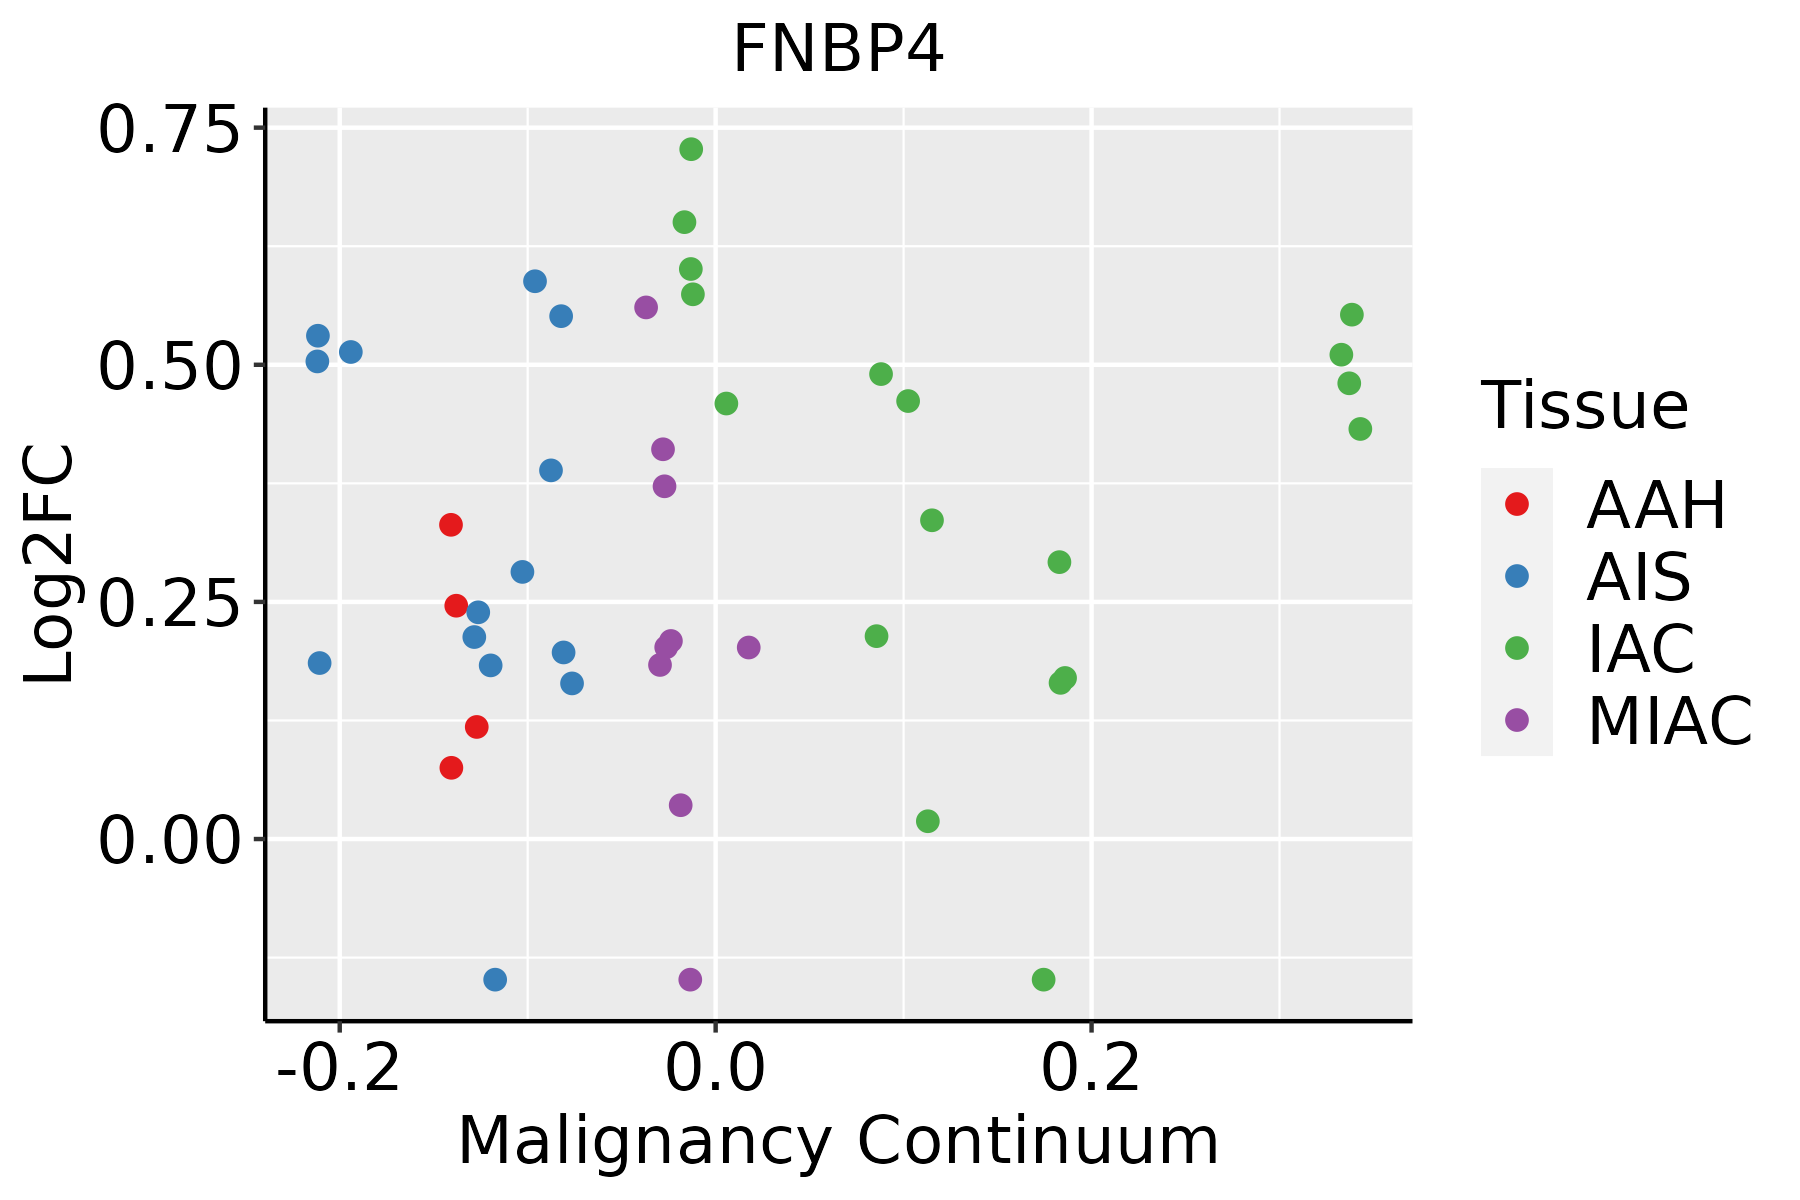 | AAH: Atypical adenomatous hyperplasia |
| AIS: Adenocarcinoma in situ | ||
| IAC: Invasive lung adenocarcinoma | ||
| MIA: Minimally invasive adenocarcinoma | ||
| Oral Cavity | 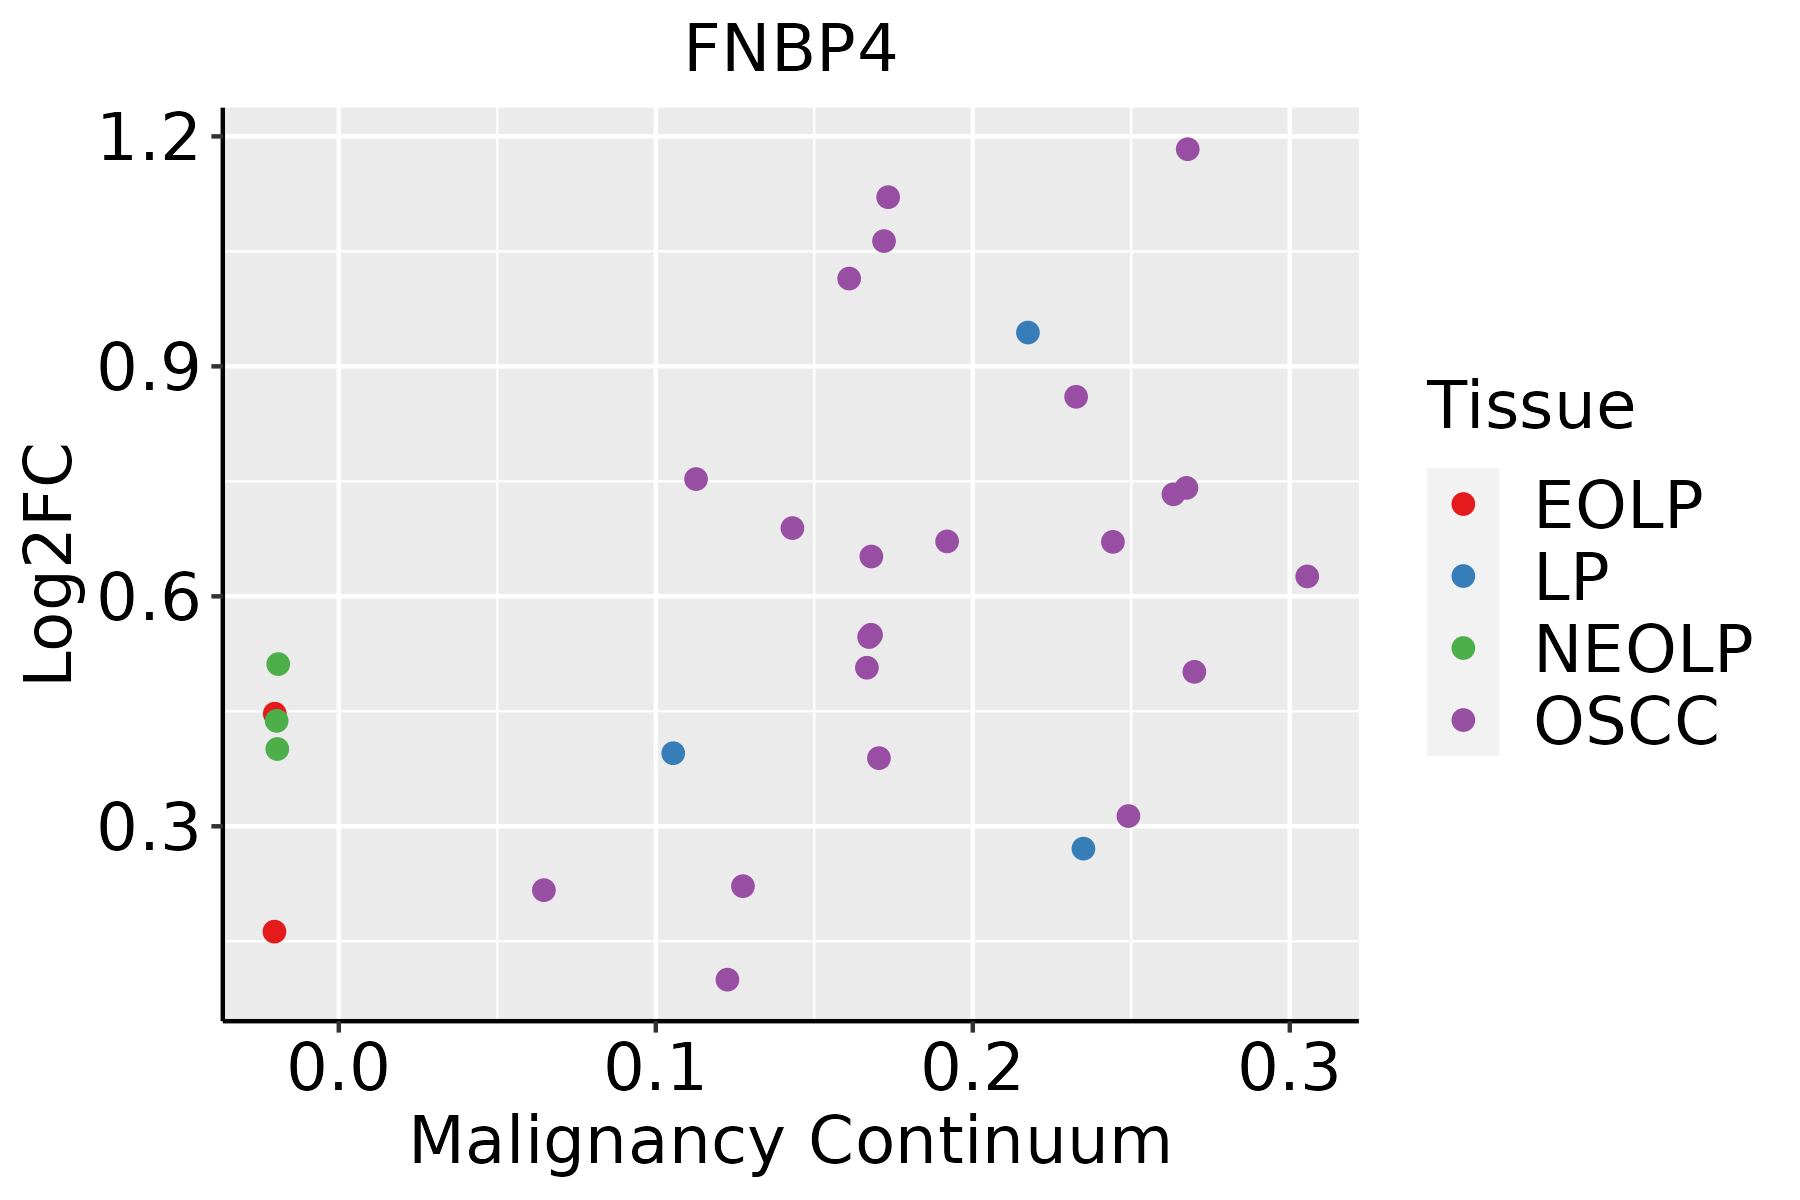 | EOLP: Erosive Oral lichen planus |
| LP: leukoplakia | ||
| NEOLP: Non-erosive oral lichen planus | ||
| OSCC: Oral squamous cell carcinoma | ||
| Prostate |  | BPH: Benign Prostatic Hyperplasia |
| Skin | 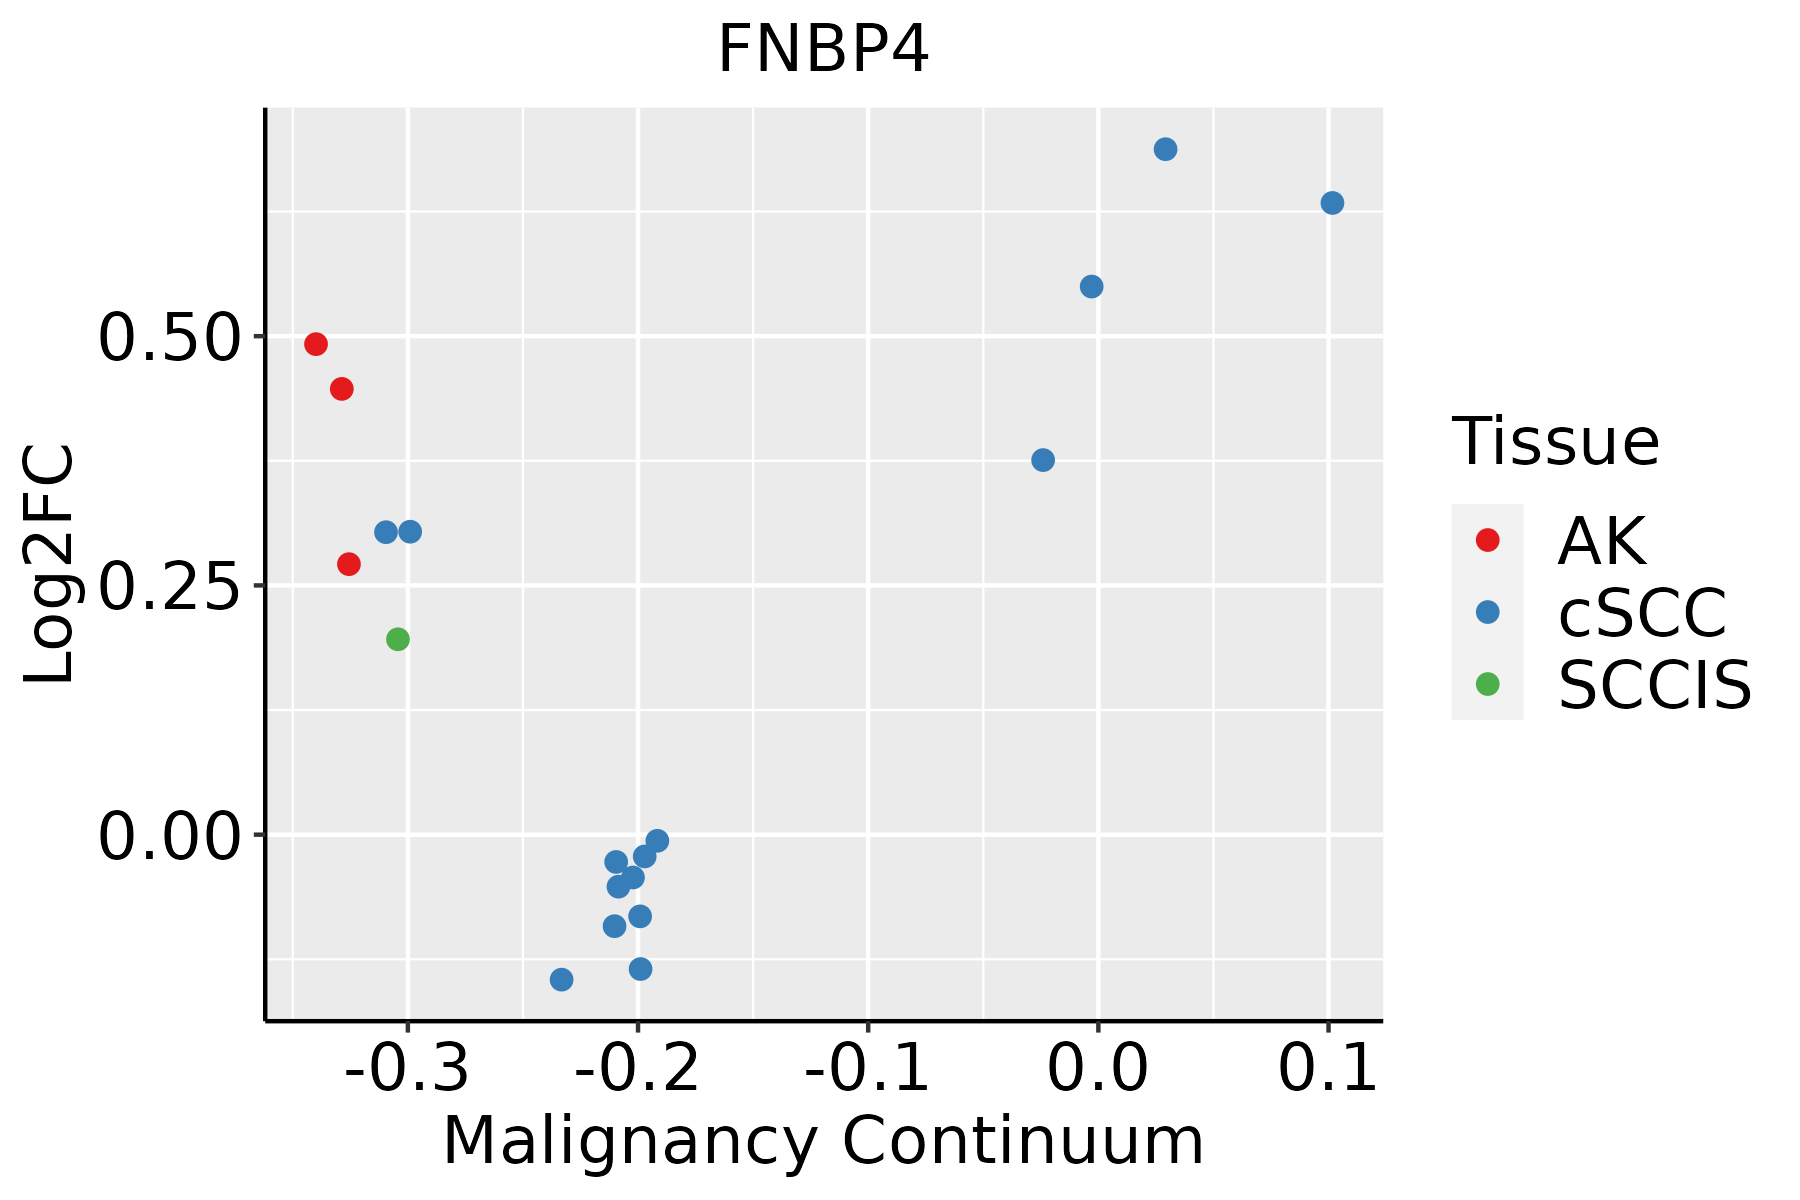 | AK: Actinic keratosis |
| cSCC: Cutaneous squamous cell carcinoma | ||
| SCCIS:squamous cell carcinoma in situ | ||
| Thyroid | 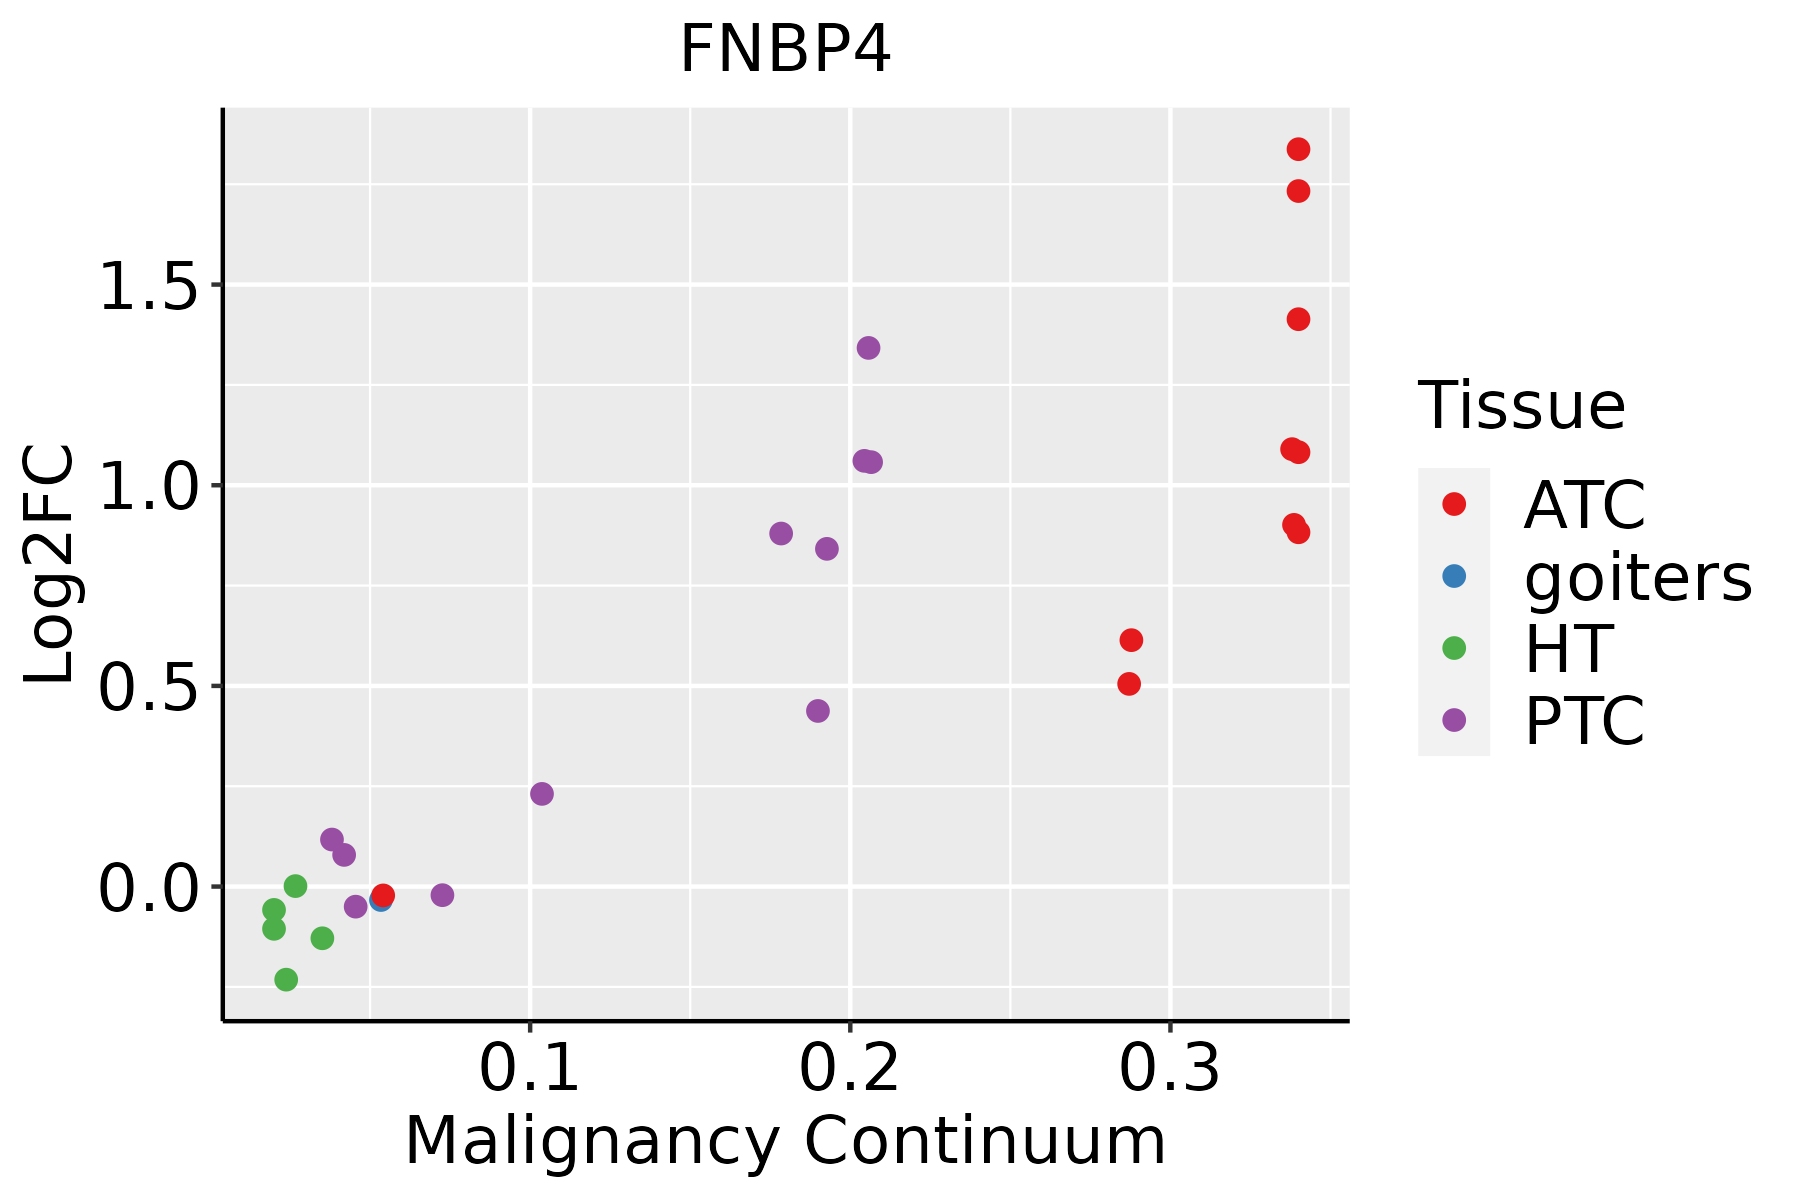 | ATC: Anaplastic thyroid cancer |
| HT: Hashimoto's thyroiditis | ||
| PTC: Papillary thyroid cancer |
| ∗log2FC in expression of this searched gene in stem-like cells from each diseased tissue sample relative to stem-like cells in normal samples in each tissue plotted against the malignancy continuum. Samples are colored based on if they are from different disease stage. |
Top |
Malignant transformation related pathway analysis |
| Find out the enriched GO biological processes and KEGG pathways involved in transition from healthy to precancer to cancer |
| Tissue | Disease Stage | Enriched GO biological Processes |
| Esophagus | ESCC |  |
| Skin | AK |  |
| Skin | SCCIS |  |
| Skin | cSCC |  |
| Thyroid | HT |  |
| ∗Top 15 enriched GO BP terms are showed in the bar plot of each disease state in each tissue. Each row represents a significant GO biological process which is colored according to the -log10(p.adjust). |
| Page: 1 2 3 4 5 6 7 8 9 |
| GO ID | Tissue | Disease Stage | Description | Gene Ratio | Bg Ratio | pvalue | p.adjust | Count |
| Page: 1 |
| Pathway ID | Tissue | Disease Stage | Description | Gene Ratio | Bg Ratio | pvalue | p.adjust | qvalue | Count |
| Page: 1 |
Top |
Cell-cell communication analysis |
| Identification of potential cell-cell interactions between two cell types and their ligand-receptor pairs for different disease states |
| Ligand | Receptor | LRpair | Pathway | Tissue | Disease Stage |
| Page: 1 |
Top |
Single-cell gene regulatory network inference analysis |
| Find out the significant the regulons (TFs) and the target genes of each regulon across cell types for different disease states |
| TF | Cell Type | Tissue | Disease Stage | Target Gene | RSS | Regulon Activity |
| ∗The dot plots of a searched regulon are shown for all cell subpopulations in each disease state of each tissue based on the regulon specific score inferred using pySCENIC and by calculating the average expression. |
| Page: 1 |
Top |
Somatic mutation of malignant transformation related genes |
| Annotation of somatic variants for genes involved in malignant transformation |
| Hugo Symbol | Variant Class | Variant Classification | dbSNP RS | HGVSc | HGVSp | HGVSp Short | SWISSPROT | BIOTYPE | SIFT | PolyPhen | Tumor Sample Barcode | Tissue | Histology | Sex | Age | Stage | Therapy Types | Drugs | Outcome |
| FNBP4 | SNV | Missense_Mutation | novel | c.1415C>G | p.Ser472Cys | p.S472C | Q8N3X1 | protein_coding | deleterious(0) | probably_damaging(0.996) | TCGA-3C-AALI-01 | Breast | breast invasive carcinoma | Female | <65 | I/II | Unspecific | Poly E | Complete Response |
| FNBP4 | SNV | Missense_Mutation | c.1915N>G | p.Gln639Glu | p.Q639E | Q8N3X1 | protein_coding | tolerated(1) | benign(0.015) | TCGA-A2-A04U-01 | Breast | breast invasive carcinoma | Female | <65 | I/II | Chemotherapy | adriamycin | SD | |
| FNBP4 | SNV | Missense_Mutation | c.1393N>G | p.Pro465Ala | p.P465A | Q8N3X1 | protein_coding | deleterious(0) | probably_damaging(0.994) | TCGA-A2-A0CX-01 | Breast | breast invasive carcinoma | Female | <65 | I/II | Chemotherapy | adriamycin | SD | |
| FNBP4 | SNV | Missense_Mutation | novel | c.1619N>C | p.Lys540Thr | p.K540T | Q8N3X1 | protein_coding | deleterious(0) | probably_damaging(0.997) | TCGA-AN-A046-01 | Breast | breast invasive carcinoma | Female | >=65 | I/II | Unknown | Unknown | SD |
| FNBP4 | SNV | Missense_Mutation | c.1927N>A | p.Asp643Asn | p.D643N | Q8N3X1 | protein_coding | tolerated_low_confidence(0.31) | benign(0.081) | TCGA-D8-A13Y-01 | Breast | breast invasive carcinoma | Female | <65 | I/II | Chemotherapy | doxorubicin | SD | |
| FNBP4 | SNV | Missense_Mutation | rs199966515 | c.854N>T | p.Ser285Phe | p.S285F | Q8N3X1 | protein_coding | deleterious(0.02) | benign(0.275) | TCGA-E2-A10C-01 | Breast | breast invasive carcinoma | Female | <65 | I/II | Chemotherapy | cytoxan | SD |
| FNBP4 | insertion | Nonsense_Mutation | novel | c.1315_1316insTTAGTTGAGTACACCTAGAAGAAAAT | p.Gln439LeufsTer3 | p.Q439Lfs*3 | Q8N3X1 | protein_coding | TCGA-AN-A03X-01 | Breast | breast invasive carcinoma | Female | >=65 | I/II | Unknown | Unknown | SD | ||
| FNBP4 | insertion | In_Frame_Ins | novel | c.702_703insCTACAT | p.Trp234_Asn235insLeuHis | p.W234_N235insLH | Q8N3X1 | protein_coding | TCGA-AR-A0U0-01 | Breast | breast invasive carcinoma | Female | >=65 | I/II | Unknown | Unknown | SD | ||
| FNBP4 | insertion | Nonsense_Mutation | novel | c.701_702insAGTAACCGCTATAAAG | p.Trp234Ter | p.W234* | Q8N3X1 | protein_coding | TCGA-AR-A0U0-01 | Breast | breast invasive carcinoma | Female | >=65 | I/II | Unknown | Unknown | SD | ||
| FNBP4 | deletion | Frame_Shift_Del | novel | c.1423delA | p.Thr475LeufsTer21 | p.T475Lfs*21 | Q8N3X1 | protein_coding | TCGA-EW-A2FV-01 | Breast | breast invasive carcinoma | Female | <65 | III/IV | Chemotherapy | docetaxel | SD |
| Page: 1 2 3 4 5 6 7 8 9 |
Top |
Related drugs of malignant transformation related genes |
| Identification of chemicals and drugs interact with genes involved in malignant transfromation |
| (DGIdb 4.0) |
| Entrez ID | Symbol | Category | Interaction Types | Drug Claim Name | Drug Name | PMIDs |
| Page: 1 |

Copyright 2023-Present -The University of Texas Health Science Center at Houston |