
|
|||||
|
 | |
| |
| |
| |
| |
| |
|
Gene: FBLIM1 |
Gene summary for FBLIM1 |
| Gene information | Species | Human | Gene symbol | FBLIM1 | Gene ID | 54751 |
| Gene name | filamin binding LIM protein 1 | |
| Gene Alias | CAL | |
| Cytomap | 1p36.21 | |
| Gene Type | protein-coding | GO ID | GO:0000902 | UniProtAcc | Q8WUP2 |
Top |
Malignant transformation analysis |
| Identification of the aberrant gene expression in precancerous and cancerous lesions by comparing the gene expression of stem-like cells in diseased tissues with normal stem cells |
| Entrez ID | Symbol | Replicates | Species | Organ | Tissue | Adj P-value | Log2FC | Malignancy |
| 54751 | FBLIM1 | HTA11_2487_2000001011 | Human | Colorectum | SER | 2.78e-07 | 7.35e-01 | -0.1808 |
| 54751 | FBLIM1 | HTA11_347_2000001011 | Human | Colorectum | AD | 1.72e-15 | 7.13e-01 | -0.1954 |
| 54751 | FBLIM1 | HTA11_411_2000001011 | Human | Colorectum | SER | 2.49e-03 | 1.01e+00 | -0.2602 |
| 54751 | FBLIM1 | HTA11_2112_2000001011 | Human | Colorectum | SER | 2.28e-02 | 7.89e-01 | -0.2196 |
| 54751 | FBLIM1 | HTA11_83_2000001011 | Human | Colorectum | SER | 1.77e-03 | 6.15e-01 | -0.1526 |
| 54751 | FBLIM1 | HTA11_696_2000001011 | Human | Colorectum | AD | 3.17e-16 | 8.87e-01 | -0.1464 |
| 54751 | FBLIM1 | HTA11_866_2000001011 | Human | Colorectum | AD | 1.55e-05 | 4.45e-01 | -0.1001 |
| 54751 | FBLIM1 | HTA11_1391_2000001011 | Human | Colorectum | AD | 2.61e-02 | 5.32e-01 | -0.059 |
| 54751 | FBLIM1 | HTA11_546_2000001011 | Human | Colorectum | AD | 1.14e-02 | 5.88e-01 | -0.0842 |
| 54751 | FBLIM1 | F007 | Human | Colorectum | FAP | 3.73e-03 | -3.19e-01 | 0.1176 |
| 54751 | FBLIM1 | A002-C-010 | Human | Colorectum | FAP | 1.15e-02 | -2.60e-01 | 0.242 |
| 54751 | FBLIM1 | A015-C-203 | Human | Colorectum | FAP | 5.94e-19 | -2.69e-01 | -0.1294 |
| 54751 | FBLIM1 | A015-C-204 | Human | Colorectum | FAP | 1.37e-02 | -1.42e-01 | -0.0228 |
| 54751 | FBLIM1 | A002-C-201 | Human | Colorectum | FAP | 6.52e-08 | -2.85e-01 | 0.0324 |
| 54751 | FBLIM1 | A002-C-203 | Human | Colorectum | FAP | 2.17e-07 | -3.00e-01 | 0.2786 |
| 54751 | FBLIM1 | A001-C-119 | Human | Colorectum | FAP | 6.85e-05 | -2.93e-01 | -0.1557 |
| 54751 | FBLIM1 | A001-C-108 | Human | Colorectum | FAP | 2.74e-13 | -3.05e-01 | -0.0272 |
| 54751 | FBLIM1 | A002-C-205 | Human | Colorectum | FAP | 1.45e-15 | -3.28e-01 | -0.1236 |
| 54751 | FBLIM1 | A015-C-005 | Human | Colorectum | FAP | 2.63e-05 | -2.46e-01 | -0.0336 |
| 54751 | FBLIM1 | A015-C-006 | Human | Colorectum | FAP | 3.63e-10 | -4.02e-01 | -0.0994 |
| Page: 1 2 3 4 5 6 7 8 9 |
| Tissue | Expression Dynamics | Abbreviation |
| Colorectum (GSE201348) | 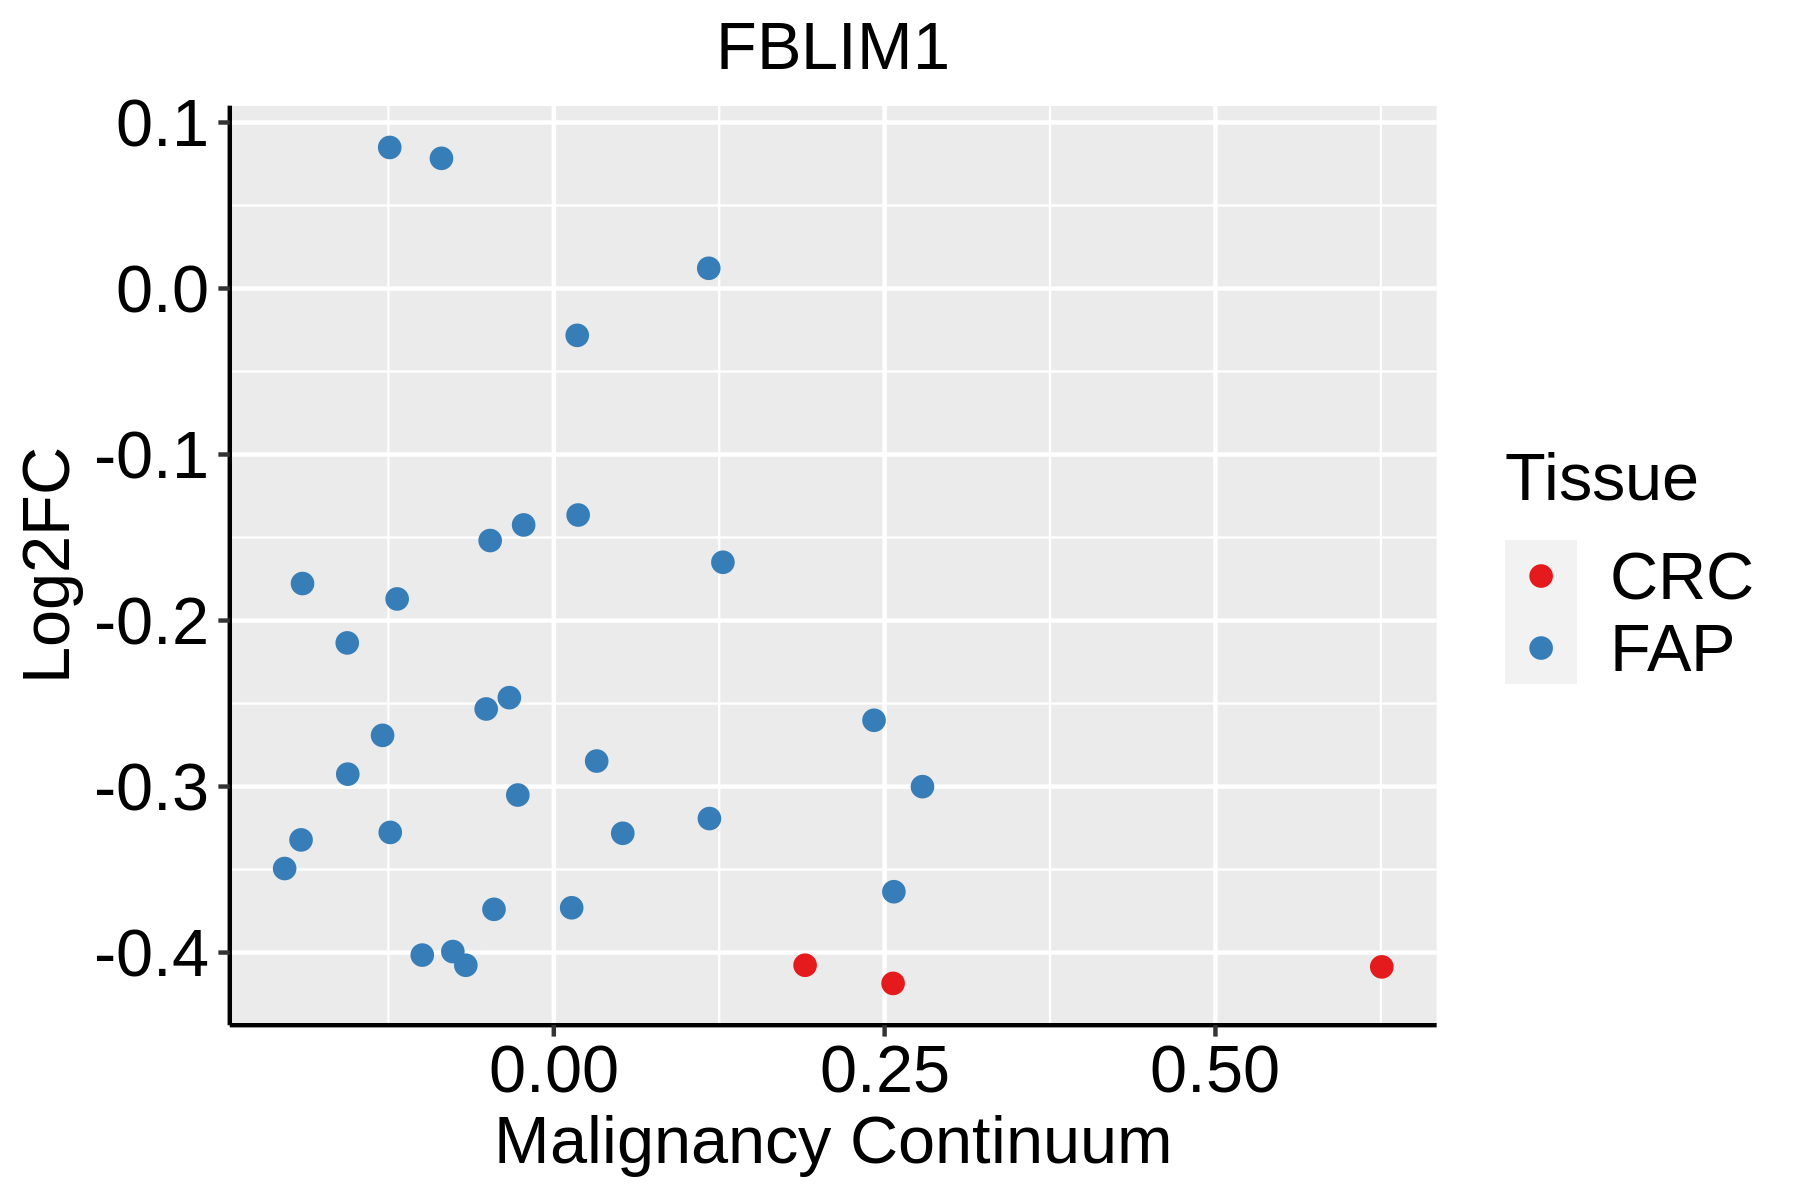 | FAP: Familial adenomatous polyposis |
| CRC: Colorectal cancer | ||
| Colorectum (HTA11) |  | AD: Adenomas |
| SER: Sessile serrated lesions | ||
| MSI-H: Microsatellite-high colorectal cancer | ||
| MSS: Microsatellite stable colorectal cancer | ||
| Esophagus | 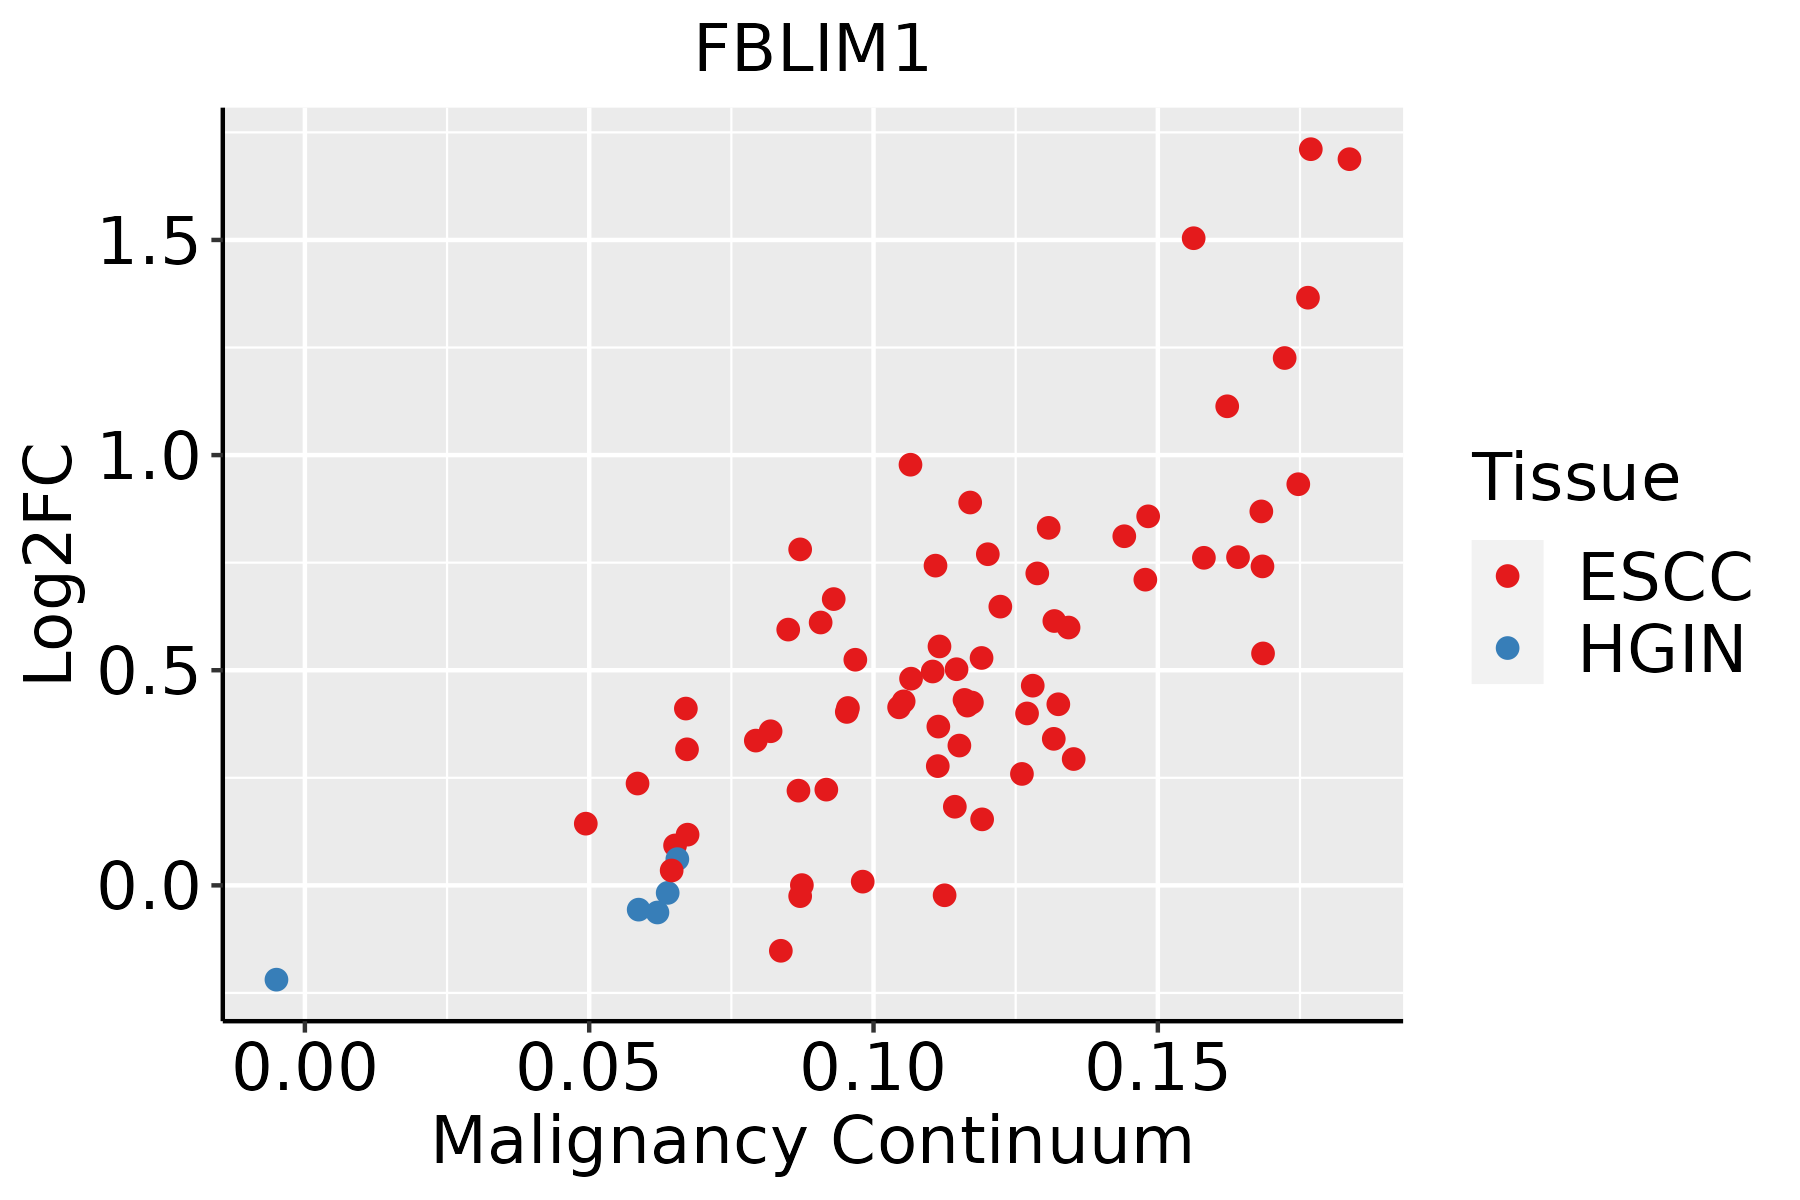 | ESCC: Esophageal squamous cell carcinoma |
| HGIN: High-grade intraepithelial neoplasias | ||
| LGIN: Low-grade intraepithelial neoplasias | ||
| GC | 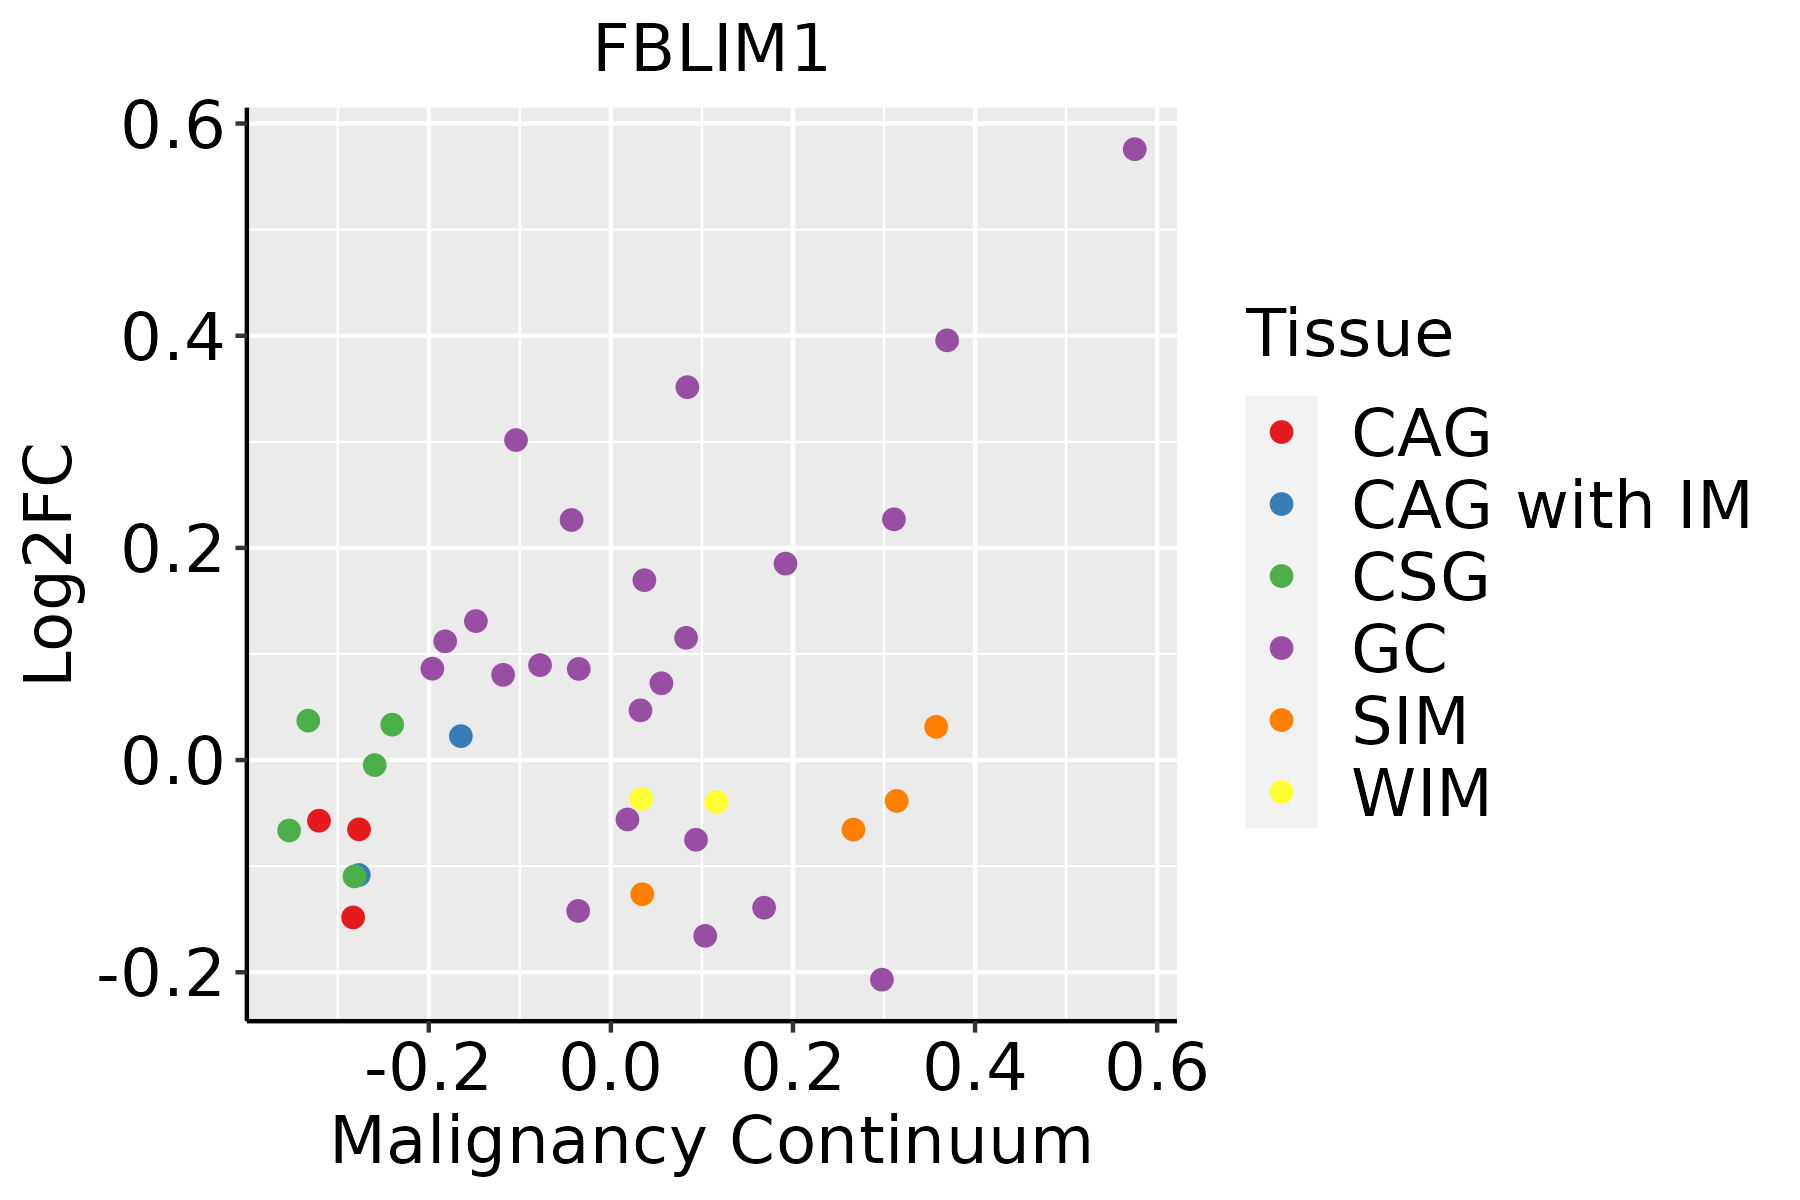 | CAG: Chronic atrophic gastritis |
| CAG with IM: Chronic atrophic gastritis with intestinal metaplasia | ||
| CSG: Chronic superficial gastritis | ||
| GC: Gastric cancer | ||
| SIM: Severe intestinal metaplasia | ||
| WIM: Wild intestinal metaplasia | ||
| Liver | 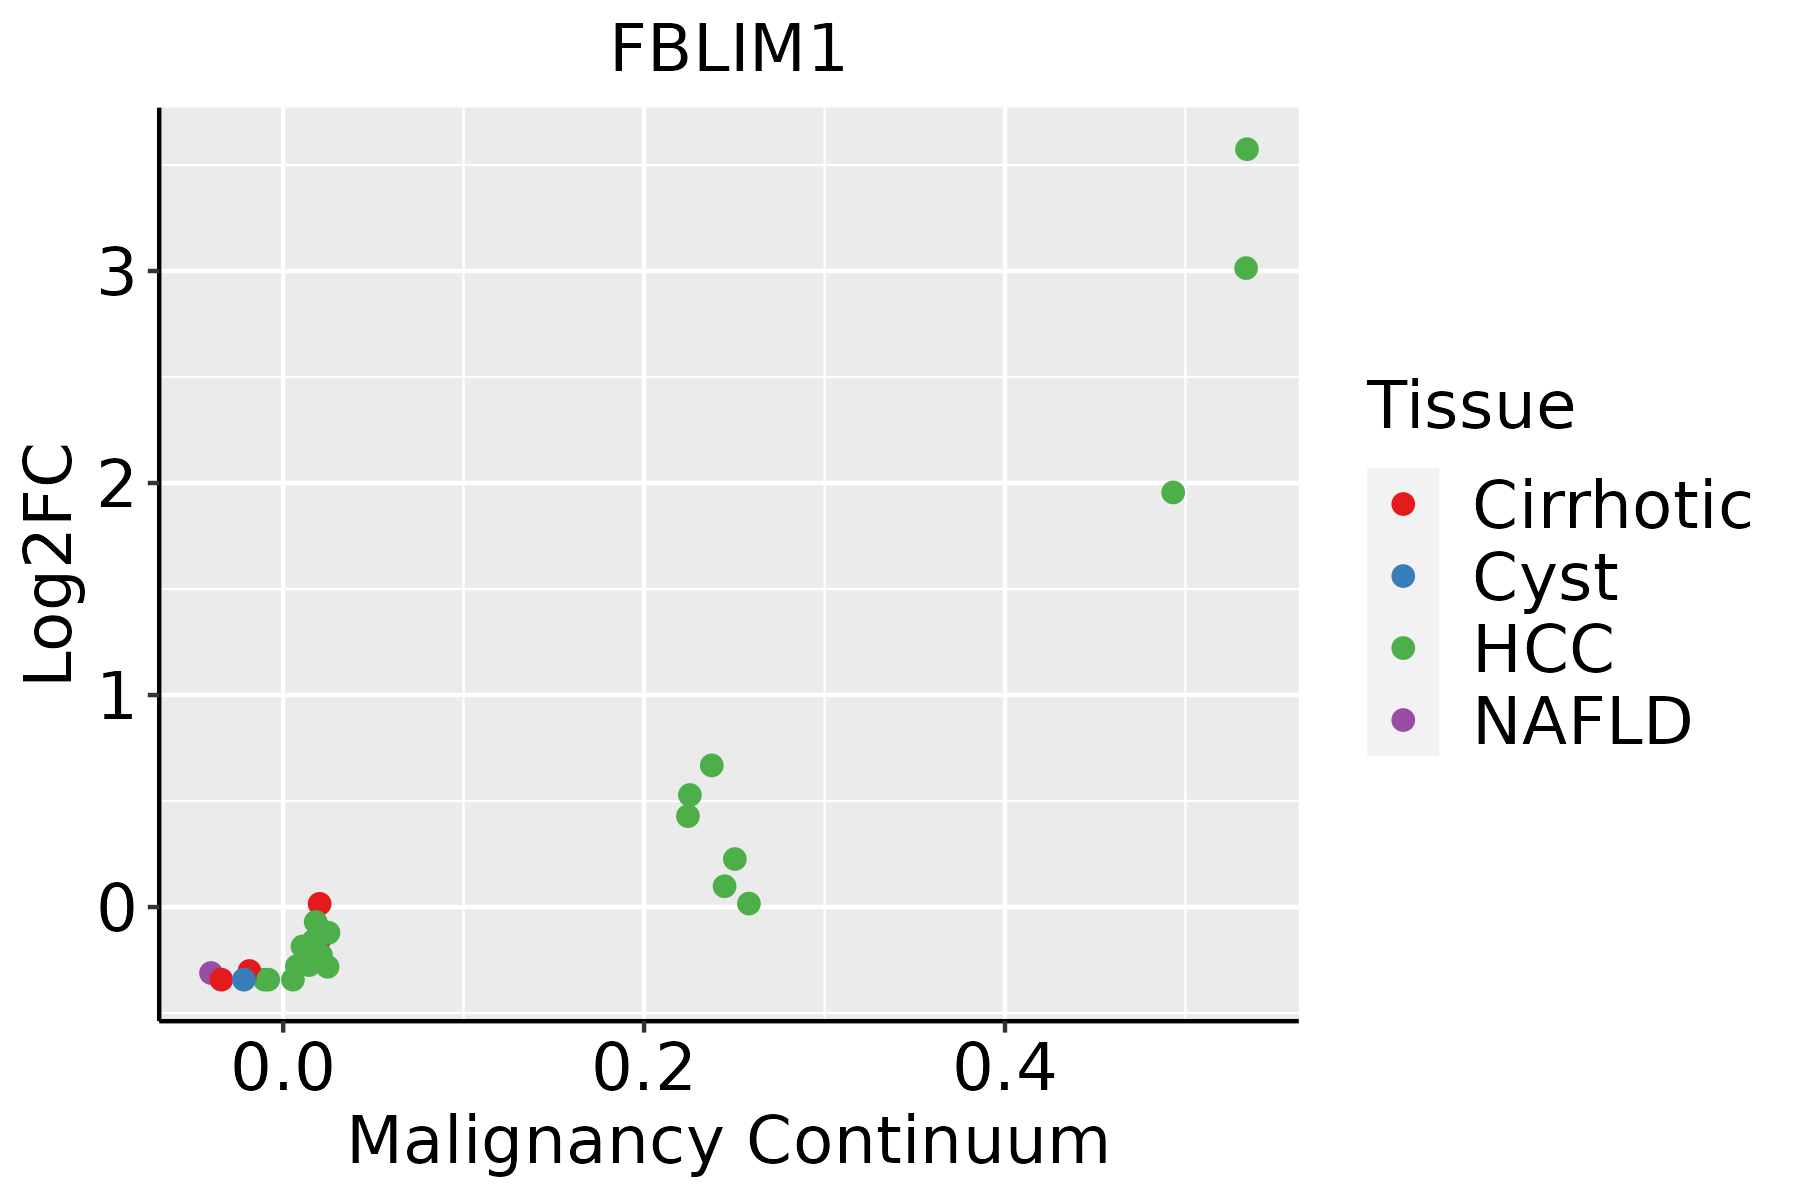 | HCC: Hepatocellular carcinoma |
| NAFLD: Non-alcoholic fatty liver disease | ||
| Oral Cavity | 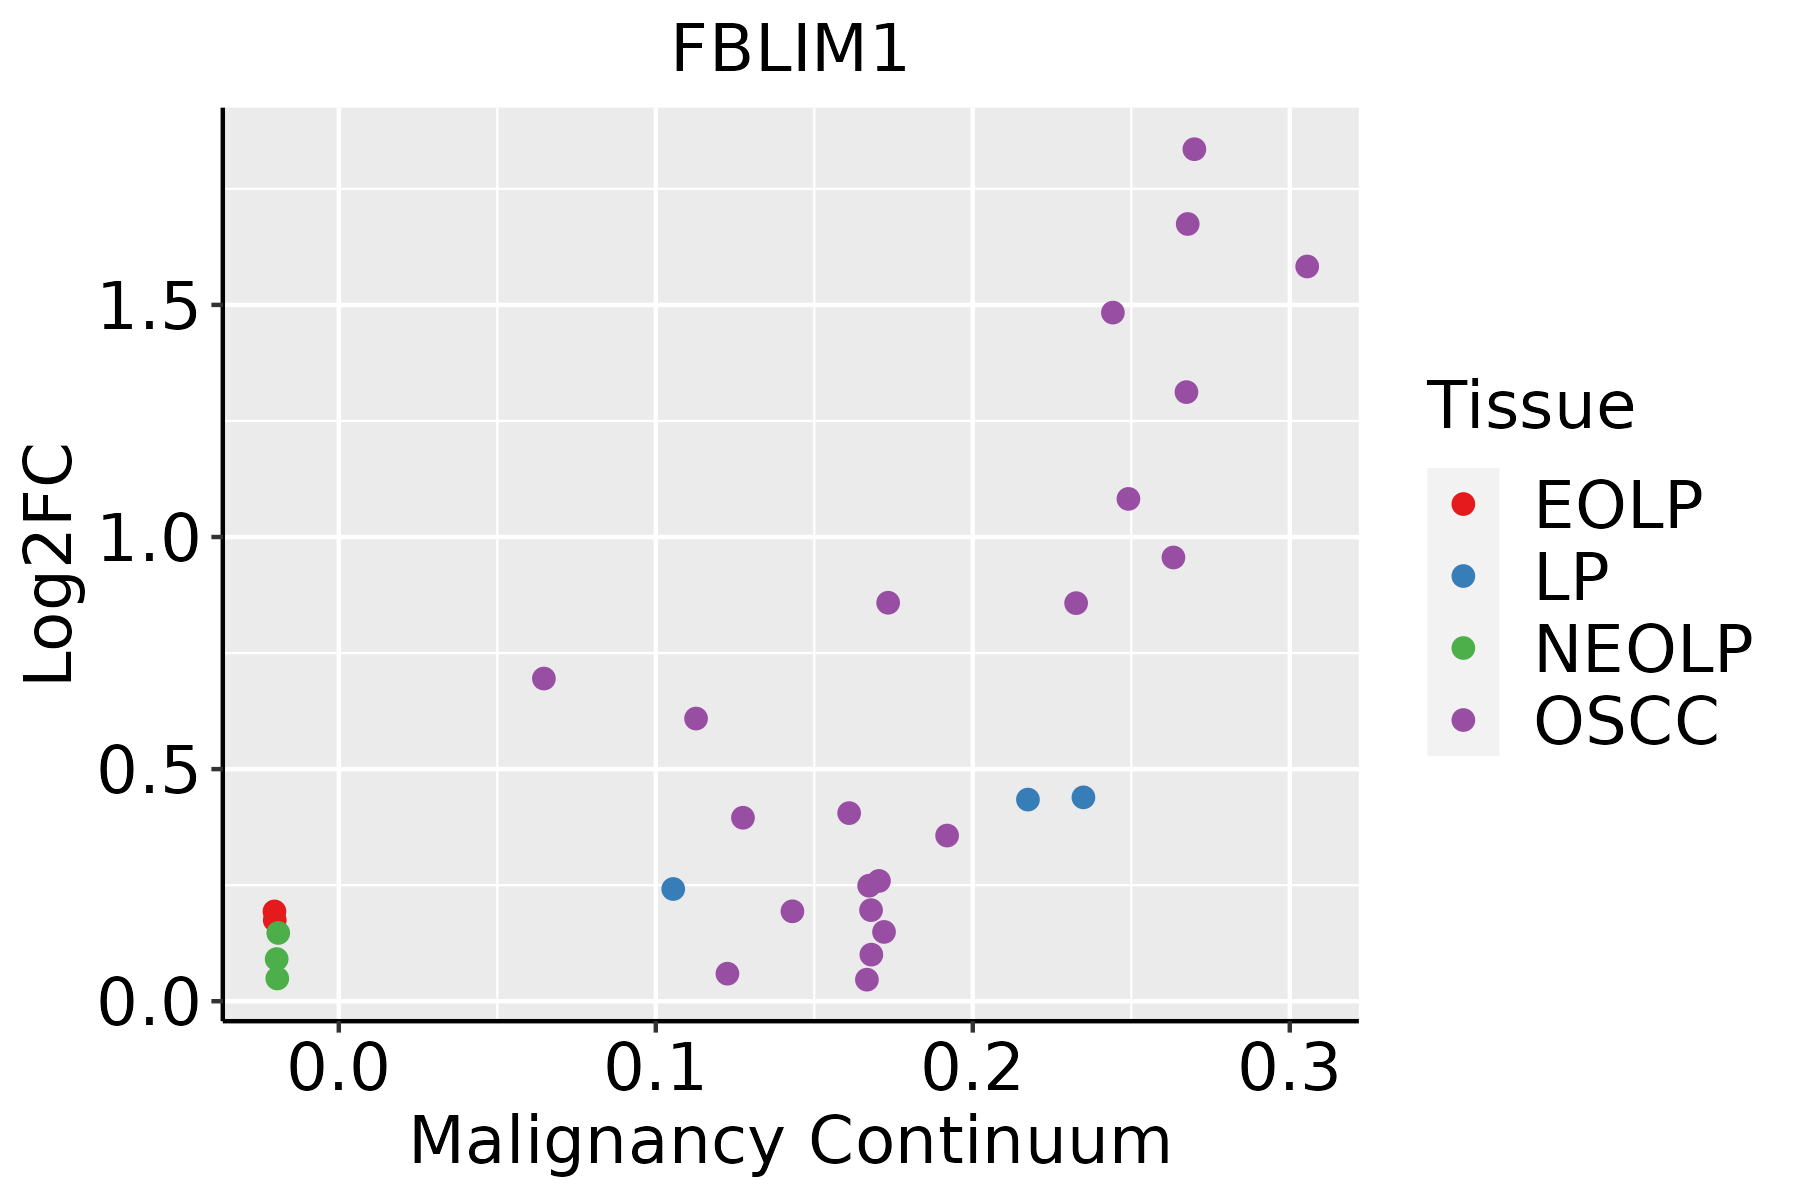 | EOLP: Erosive Oral lichen planus |
| LP: leukoplakia | ||
| NEOLP: Non-erosive oral lichen planus | ||
| OSCC: Oral squamous cell carcinoma | ||
| Skin | 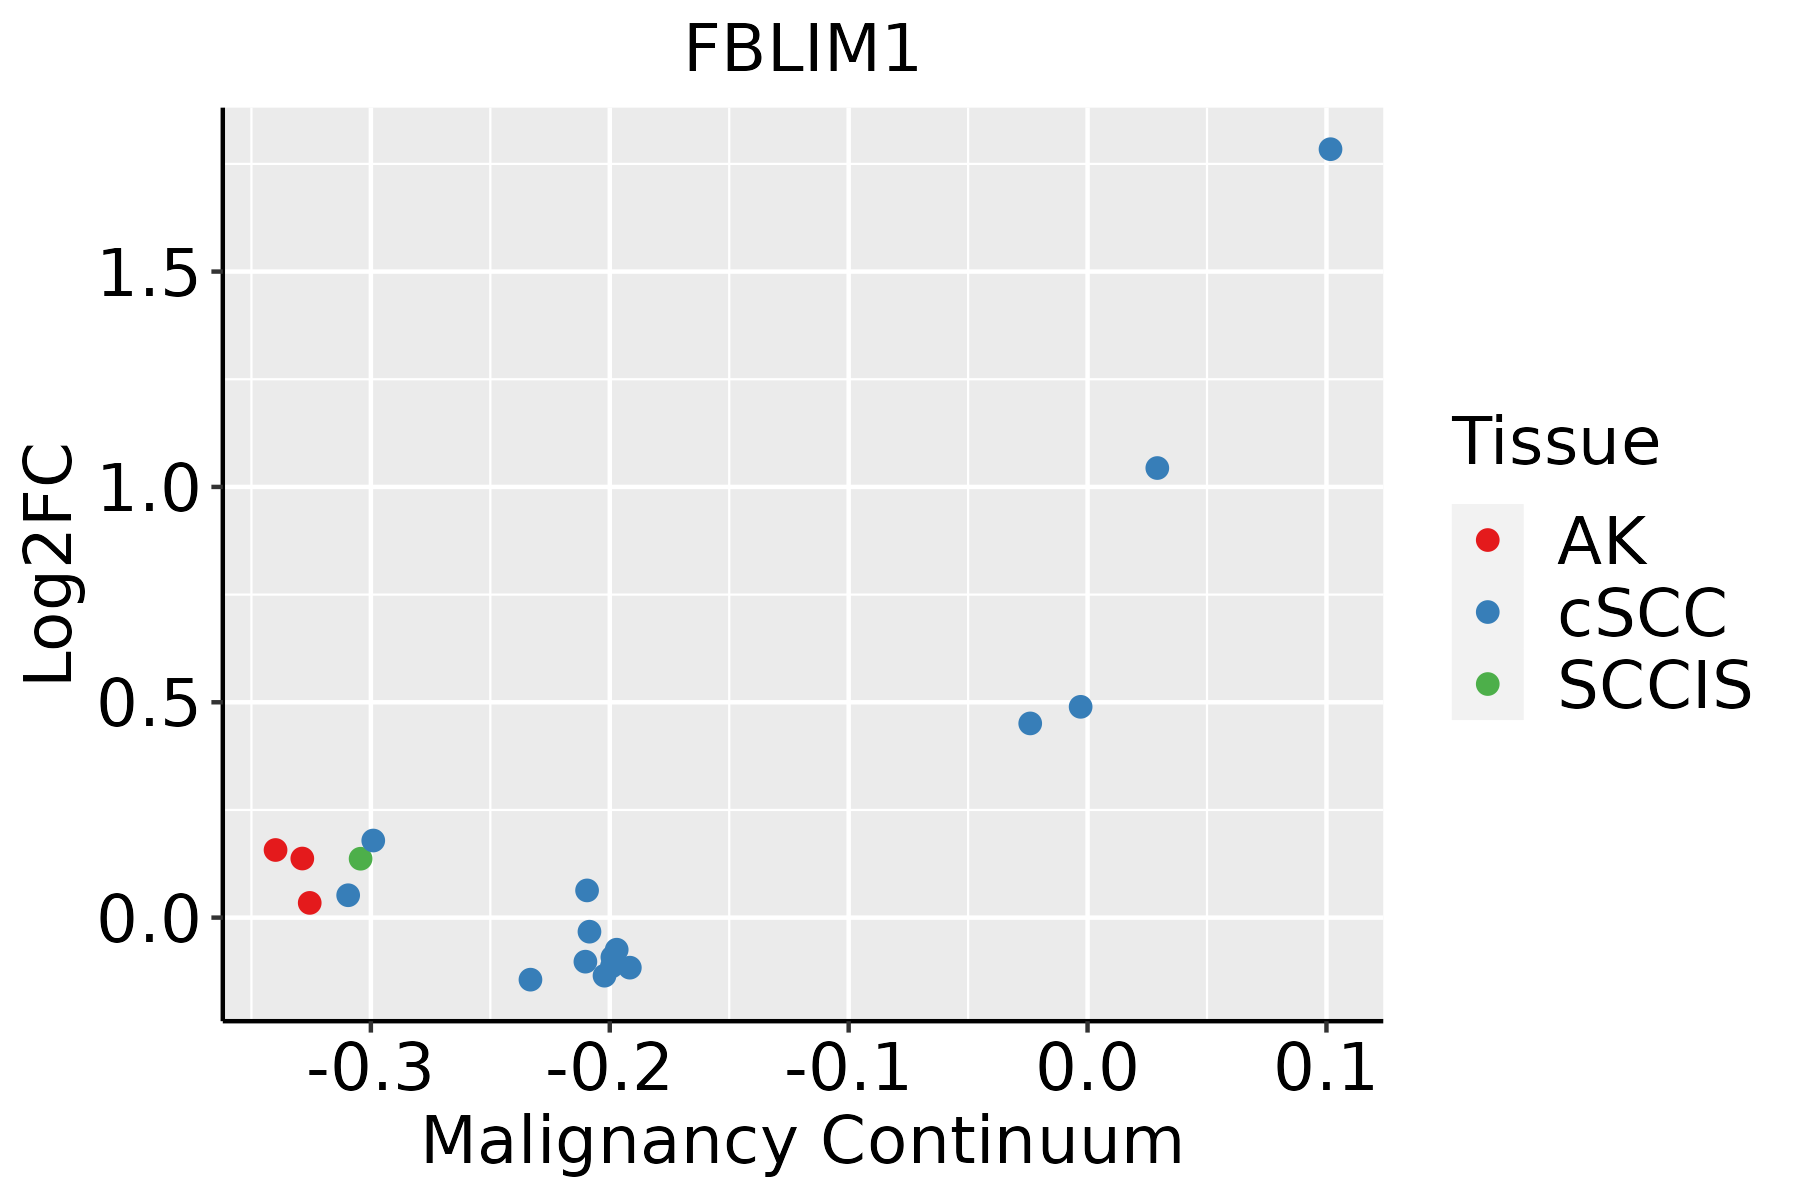 | AK: Actinic keratosis |
| cSCC: Cutaneous squamous cell carcinoma | ||
| SCCIS:squamous cell carcinoma in situ | ||
| Thyroid | 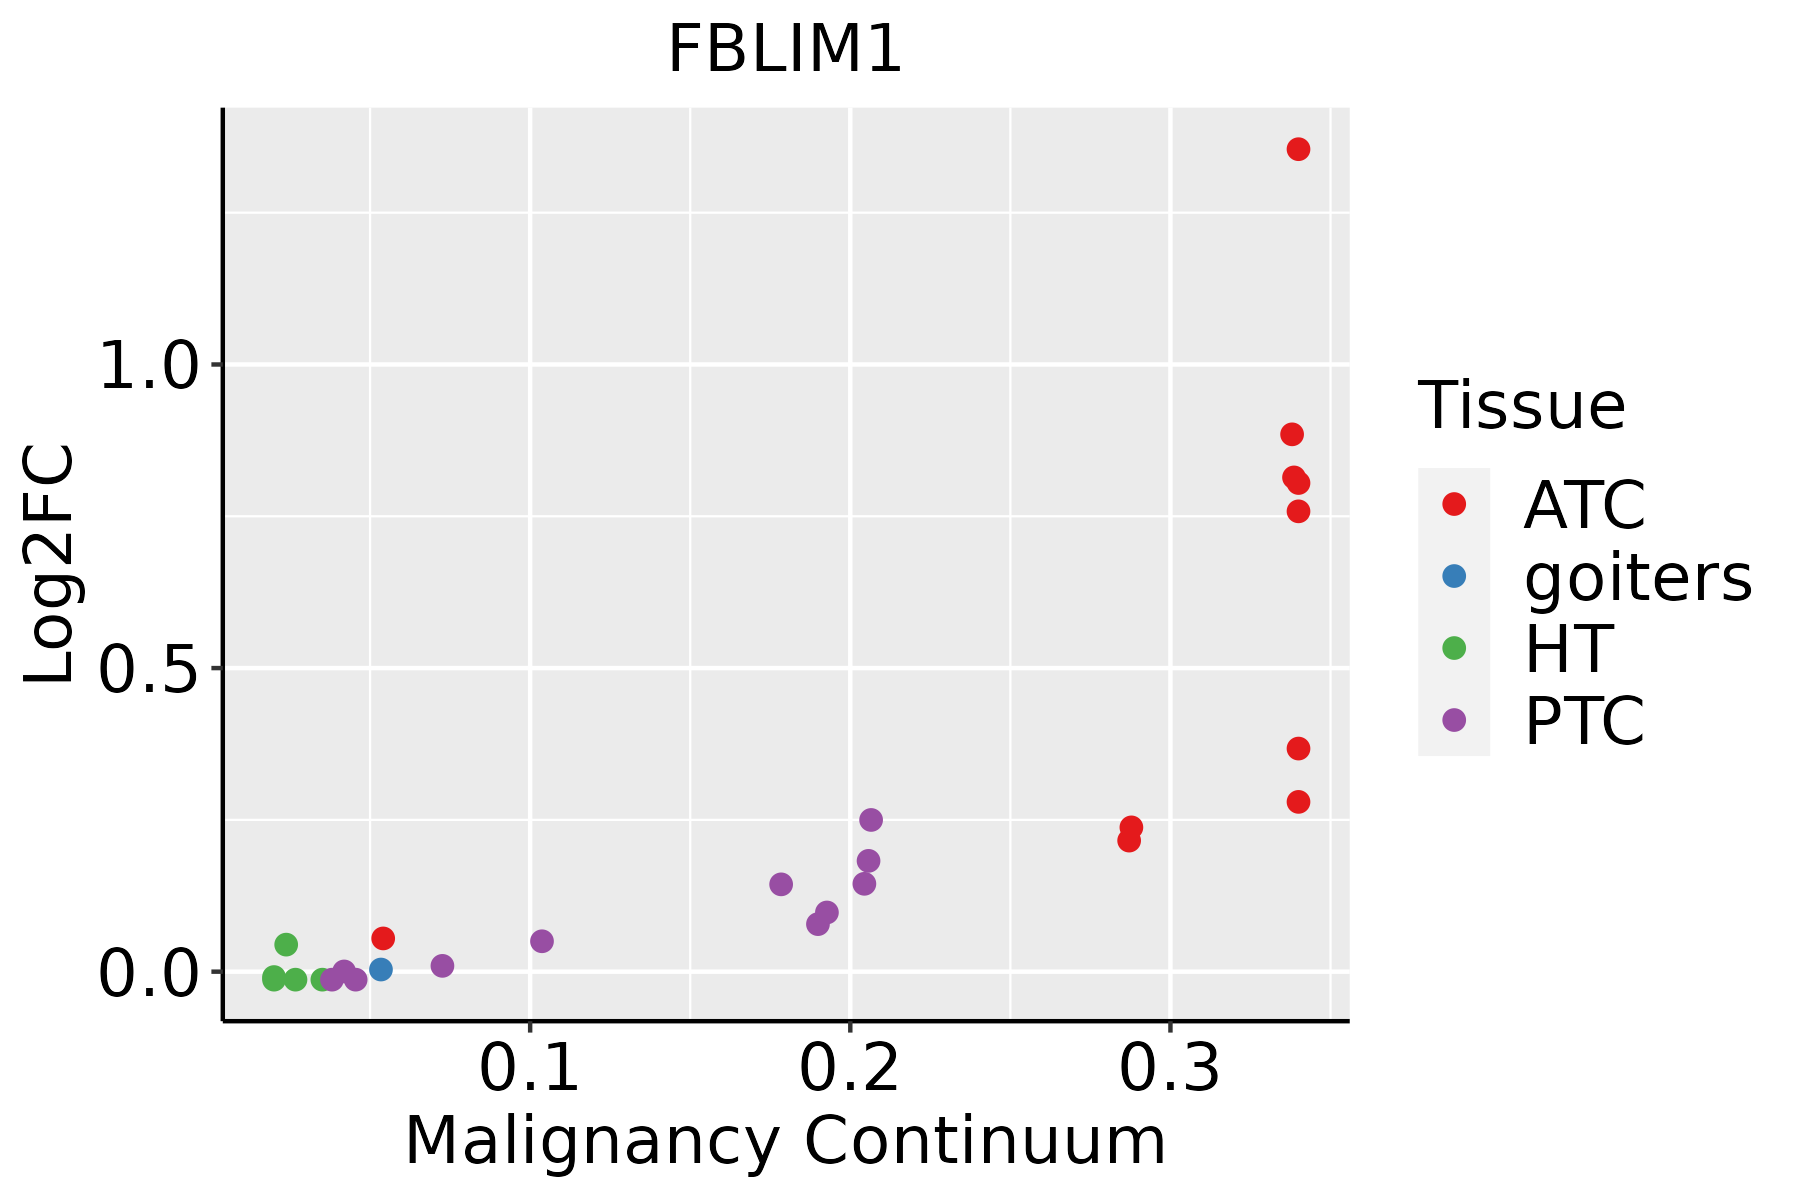 | ATC: Anaplastic thyroid cancer |
| HT: Hashimoto's thyroiditis | ||
| PTC: Papillary thyroid cancer |
| ∗log2FC in expression of this searched gene in stem-like cells from each diseased tissue sample relative to stem-like cells in normal samples in each tissue plotted against the malignancy continuum. Samples are colored based on if they are from different disease stage. |
Top |
Malignant transformation related pathway analysis |
| Find out the enriched GO biological processes and KEGG pathways involved in transition from healthy to precancer to cancer |
| Tissue | Disease Stage | Enriched GO biological Processes |
| Esophagus | ESCC |  |
| Skin | AK |  |
| Skin | SCCIS |  |
| Skin | cSCC |  |
| Thyroid | HT |  |
| ∗Top 15 enriched GO BP terms are showed in the bar plot of each disease state in each tissue. Each row represents a significant GO biological process which is colored according to the -log10(p.adjust). |
| Page: 1 2 3 4 5 6 7 8 9 |
| GO ID | Tissue | Disease Stage | Description | Gene Ratio | Bg Ratio | pvalue | p.adjust | Count |
| GO:0043254 | Colorectum | AD | regulation of protein-containing complex assembly | 148/3918 | 428/18723 | 2.64e-11 | 3.18e-09 | 148 |
| GO:0022604 | Colorectum | AD | regulation of cell morphogenesis | 109/3918 | 309/18723 | 3.08e-09 | 2.07e-07 | 109 |
| GO:0008360 | Colorectum | AD | regulation of cell shape | 56/3918 | 154/18723 | 7.01e-06 | 1.73e-04 | 56 |
| GO:00432541 | Colorectum | SER | regulation of protein-containing complex assembly | 119/2897 | 428/18723 | 3.34e-11 | 5.86e-09 | 119 |
| GO:00226041 | Colorectum | SER | regulation of cell morphogenesis | 89/2897 | 309/18723 | 1.51e-09 | 1.52e-07 | 89 |
| GO:00083601 | Colorectum | SER | regulation of cell shape | 43/2897 | 154/18723 | 5.47e-05 | 1.30e-03 | 43 |
| GO:00226044 | Colorectum | FAP | regulation of cell morphogenesis | 87/2622 | 309/18723 | 4.89e-11 | 1.87e-08 | 87 |
| GO:00432544 | Colorectum | FAP | regulation of protein-containing complex assembly | 101/2622 | 428/18723 | 5.18e-08 | 4.07e-06 | 101 |
| GO:00083603 | Colorectum | FAP | regulation of cell shape | 43/2622 | 154/18723 | 4.55e-06 | 1.52e-04 | 43 |
| GO:00226045 | Colorectum | CRC | regulation of cell morphogenesis | 74/2078 | 309/18723 | 9.25e-11 | 5.04e-08 | 74 |
| GO:00432545 | Colorectum | CRC | regulation of protein-containing complex assembly | 87/2078 | 428/18723 | 1.38e-08 | 2.67e-06 | 87 |
| GO:00083604 | Colorectum | CRC | regulation of cell shape | 38/2078 | 154/18723 | 1.51e-06 | 8.15e-05 | 38 |
| GO:0043254111 | Esophagus | ESCC | regulation of protein-containing complex assembly | 278/8552 | 428/18723 | 3.81e-16 | 2.77e-14 | 278 |
| GO:002260420 | Esophagus | ESCC | regulation of cell morphogenesis | 180/8552 | 309/18723 | 5.19e-06 | 5.45e-05 | 180 |
| GO:000836018 | Esophagus | ESCC | regulation of cell shape | 92/8552 | 154/18723 | 3.00e-04 | 1.81e-03 | 92 |
| GO:004325412 | Liver | Cirrhotic | regulation of protein-containing complex assembly | 169/4634 | 428/18723 | 7.40e-12 | 4.99e-10 | 169 |
| GO:002260412 | Liver | Cirrhotic | regulation of cell morphogenesis | 127/4634 | 309/18723 | 1.45e-10 | 7.44e-09 | 127 |
| GO:000836012 | Liver | Cirrhotic | regulation of cell shape | 69/4634 | 154/18723 | 4.21e-08 | 1.36e-06 | 69 |
| GO:004325422 | Liver | HCC | regulation of protein-containing complex assembly | 264/7958 | 428/18723 | 5.47e-16 | 4.39e-14 | 264 |
| GO:002260422 | Liver | HCC | regulation of cell morphogenesis | 188/7958 | 309/18723 | 4.84e-11 | 1.82e-09 | 188 |
| Page: 1 2 3 |
| Pathway ID | Tissue | Disease Stage | Description | Gene Ratio | Bg Ratio | pvalue | p.adjust | qvalue | Count |
| Page: 1 |
Top |
Cell-cell communication analysis |
| Identification of potential cell-cell interactions between two cell types and their ligand-receptor pairs for different disease states |
| Ligand | Receptor | LRpair | Pathway | Tissue | Disease Stage |
| Page: 1 |
Top |
Single-cell gene regulatory network inference analysis |
| Find out the significant the regulons (TFs) and the target genes of each regulon across cell types for different disease states |
| TF | Cell Type | Tissue | Disease Stage | Target Gene | RSS | Regulon Activity |
| ∗The dot plots of a searched regulon are shown for all cell subpopulations in each disease state of each tissue based on the regulon specific score inferred using pySCENIC and by calculating the average expression. |
| Page: 1 |
Top |
Somatic mutation of malignant transformation related genes |
| Annotation of somatic variants for genes involved in malignant transformation |
| Hugo Symbol | Variant Class | Variant Classification | dbSNP RS | HGVSc | HGVSp | HGVSp Short | SWISSPROT | BIOTYPE | SIFT | PolyPhen | Tumor Sample Barcode | Tissue | Histology | Sex | Age | Stage | Therapy Types | Drugs | Outcome |
| FBLIM1 | SNV | Missense_Mutation | c.145N>G | p.Met49Val | p.M49V | Q8WUP2 | protein_coding | tolerated(0.31) | benign(0) | TCGA-AO-A128-01 | Breast | breast invasive carcinoma | Female | <65 | I/II | Chemotherapy | doxorubicin | SD | |
| FBLIM1 | SNV | Missense_Mutation | c.992C>G | p.Ser331Cys | p.S331C | Q8WUP2 | protein_coding | deleterious_low_confidence(0.01) | probably_damaging(0.924) | TCGA-C8-A12K-01 | Breast | breast invasive carcinoma | Female | >=65 | I/II | Unknown | Unknown | SD | |
| FBLIM1 | SNV | Missense_Mutation | rs145692215 | c.32C>T | p.Ser11Leu | p.S11L | Q8WUP2 | protein_coding | deleterious(0) | probably_damaging(0.99) | TCGA-AA-3864-01 | Colorectum | colon adenocarcinoma | Male | >=65 | I/II | Unknown | Unknown | SD |
| FBLIM1 | SNV | Missense_Mutation | c.962G>T | p.Ser321Ile | p.S321I | Q8WUP2 | protein_coding | deleterious(0.01) | benign(0.003) | TCGA-AD-6964-01 | Colorectum | colon adenocarcinoma | Male | <65 | III/IV | Chemotherapy | folfox | PD | |
| FBLIM1 | SNV | Missense_Mutation | c.722N>A | p.Cys241Tyr | p.C241Y | Q8WUP2 | protein_coding | deleterious(0) | probably_damaging(0.997) | TCGA-D5-6530-01 | Colorectum | colon adenocarcinoma | Male | <65 | I/II | Unknown | Unknown | SD | |
| FBLIM1 | insertion | Frame_Shift_Ins | novel | c.1094_1095insCT | p.Arg366Ter | p.R366* | Q8WUP2 | protein_coding | TCGA-AA-A02Y-01 | Colorectum | colon adenocarcinoma | Male | >=65 | I/II | Unknown | Unknown | SD | ||
| FBLIM1 | SNV | Missense_Mutation | novel | c.817N>A | p.Ala273Thr | p.A273T | Q8WUP2 | protein_coding | deleterious(0.03) | possibly_damaging(0.844) | TCGA-AP-A1DK-01 | Endometrium | uterine corpus endometrioid carcinoma | Female | <65 | I/II | Unknown | Unknown | SD |
| FBLIM1 | SNV | Missense_Mutation | rs750253844 | c.112C>T | p.Arg38Trp | p.R38W | Q8WUP2 | protein_coding | tolerated(0.11) | benign(0.005) | TCGA-AX-A2HD-01 | Endometrium | uterine corpus endometrioid carcinoma | Female | >=65 | III/IV | Unknown | Unknown | SD |
| FBLIM1 | SNV | Missense_Mutation | novel | c.727N>G | p.Ile243Val | p.I243V | Q8WUP2 | protein_coding | tolerated(1) | benign(0.003) | TCGA-B5-A3FA-01 | Endometrium | uterine corpus endometrioid carcinoma | Female | >=65 | I/II | Unknown | Unknown | SD |
| FBLIM1 | SNV | Missense_Mutation | novel | c.158N>G | p.Glu53Gly | p.E53G | Q8WUP2 | protein_coding | tolerated(1) | benign(0) | TCGA-D1-A103-01 | Endometrium | uterine corpus endometrioid carcinoma | Female | >=65 | I/II | Unknown | Unknown | SD |
| Page: 1 2 3 4 |
Top |
Related drugs of malignant transformation related genes |
| Identification of chemicals and drugs interact with genes involved in malignant transfromation |
| (DGIdb 4.0) |
| Entrez ID | Symbol | Category | Interaction Types | Drug Claim Name | Drug Name | PMIDs |
| Page: 1 |

Copyright 2023-Present -The University of Texas Health Science Center at Houston |