
|
|||||
|
 | |
| |
| |
| |
| |
| |
|
Gene: EHD1 |
Gene summary for EHD1 |
| Gene information | Species | Human | Gene symbol | EHD1 | Gene ID | 10938 |
| Gene name | EH domain containing 1 | |
| Gene Alias | H-PAST | |
| Cytomap | 11q13.1 | |
| Gene Type | protein-coding | GO ID | GO:0000768 | UniProtAcc | B2R5U3 |
Top |
Malignant transformation analysis |
| Identification of the aberrant gene expression in precancerous and cancerous lesions by comparing the gene expression of stem-like cells in diseased tissues with normal stem cells |
| Entrez ID | Symbol | Replicates | Species | Organ | Tissue | Adj P-value | Log2FC | Malignancy |
| 10938 | EHD1 | HTA11_2487_2000001011 | Human | Colorectum | SER | 6.55e-09 | 3.51e-01 | -0.1808 |
| 10938 | EHD1 | HTA11_347_2000001011 | Human | Colorectum | AD | 6.17e-04 | 2.29e-01 | -0.1954 |
| 10938 | EHD1 | HTA11_411_2000001011 | Human | Colorectum | SER | 3.17e-02 | 7.50e-01 | -0.2602 |
| 10938 | EHD1 | HTA11_2112_2000001011 | Human | Colorectum | SER | 5.61e-04 | 5.79e-01 | -0.2196 |
| 10938 | EHD1 | HTA11_696_2000001011 | Human | Colorectum | AD | 3.86e-05 | 2.30e-01 | -0.1464 |
| 10938 | EHD1 | HTA11_866_2000001011 | Human | Colorectum | AD | 7.15e-04 | 1.75e-01 | -0.1001 |
| 10938 | EHD1 | HTA11_1391_2000001011 | Human | Colorectum | AD | 7.04e-05 | 3.70e-01 | -0.059 |
| 10938 | EHD1 | HTA11_866_3004761011 | Human | Colorectum | AD | 3.99e-03 | 1.84e-01 | 0.096 |
| 10938 | EHD1 | HTA11_99999971662_82457 | Human | Colorectum | MSS | 1.93e-09 | 3.01e-01 | 0.3859 |
| 10938 | EHD1 | HTA11_99999973899_84307 | Human | Colorectum | MSS | 2.13e-03 | 3.68e-01 | 0.2585 |
| 10938 | EHD1 | LZE4T | Human | Esophagus | ESCC | 6.34e-04 | -1.60e-01 | 0.0811 |
| 10938 | EHD1 | LZE7T | Human | Esophagus | ESCC | 2.68e-05 | 8.21e-02 | 0.0667 |
| 10938 | EHD1 | LZE8T | Human | Esophagus | ESCC | 2.78e-05 | -4.85e-03 | 0.067 |
| 10938 | EHD1 | LZE20T | Human | Esophagus | ESCC | 7.46e-03 | -9.31e-02 | 0.0662 |
| 10938 | EHD1 | LZE24T | Human | Esophagus | ESCC | 1.12e-11 | 5.34e-02 | 0.0596 |
| 10938 | EHD1 | LZE6T | Human | Esophagus | ESCC | 4.67e-02 | -1.79e-01 | 0.0845 |
| 10938 | EHD1 | P1T-E | Human | Esophagus | ESCC | 2.61e-02 | 7.10e-01 | 0.0875 |
| 10938 | EHD1 | P2T-E | Human | Esophagus | ESCC | 5.52e-09 | -6.27e-02 | 0.1177 |
| 10938 | EHD1 | P4T-E | Human | Esophagus | ESCC | 1.67e-08 | 1.02e-01 | 0.1323 |
| 10938 | EHD1 | P5T-E | Human | Esophagus | ESCC | 1.97e-12 | 2.63e-01 | 0.1327 |
| Page: 1 2 3 4 5 6 |
| Tissue | Expression Dynamics | Abbreviation |
| Colorectum (GSE201348) |  | FAP: Familial adenomatous polyposis |
| CRC: Colorectal cancer | ||
| Colorectum (HTA11) |  | AD: Adenomas |
| SER: Sessile serrated lesions | ||
| MSI-H: Microsatellite-high colorectal cancer | ||
| MSS: Microsatellite stable colorectal cancer | ||
| Esophagus | 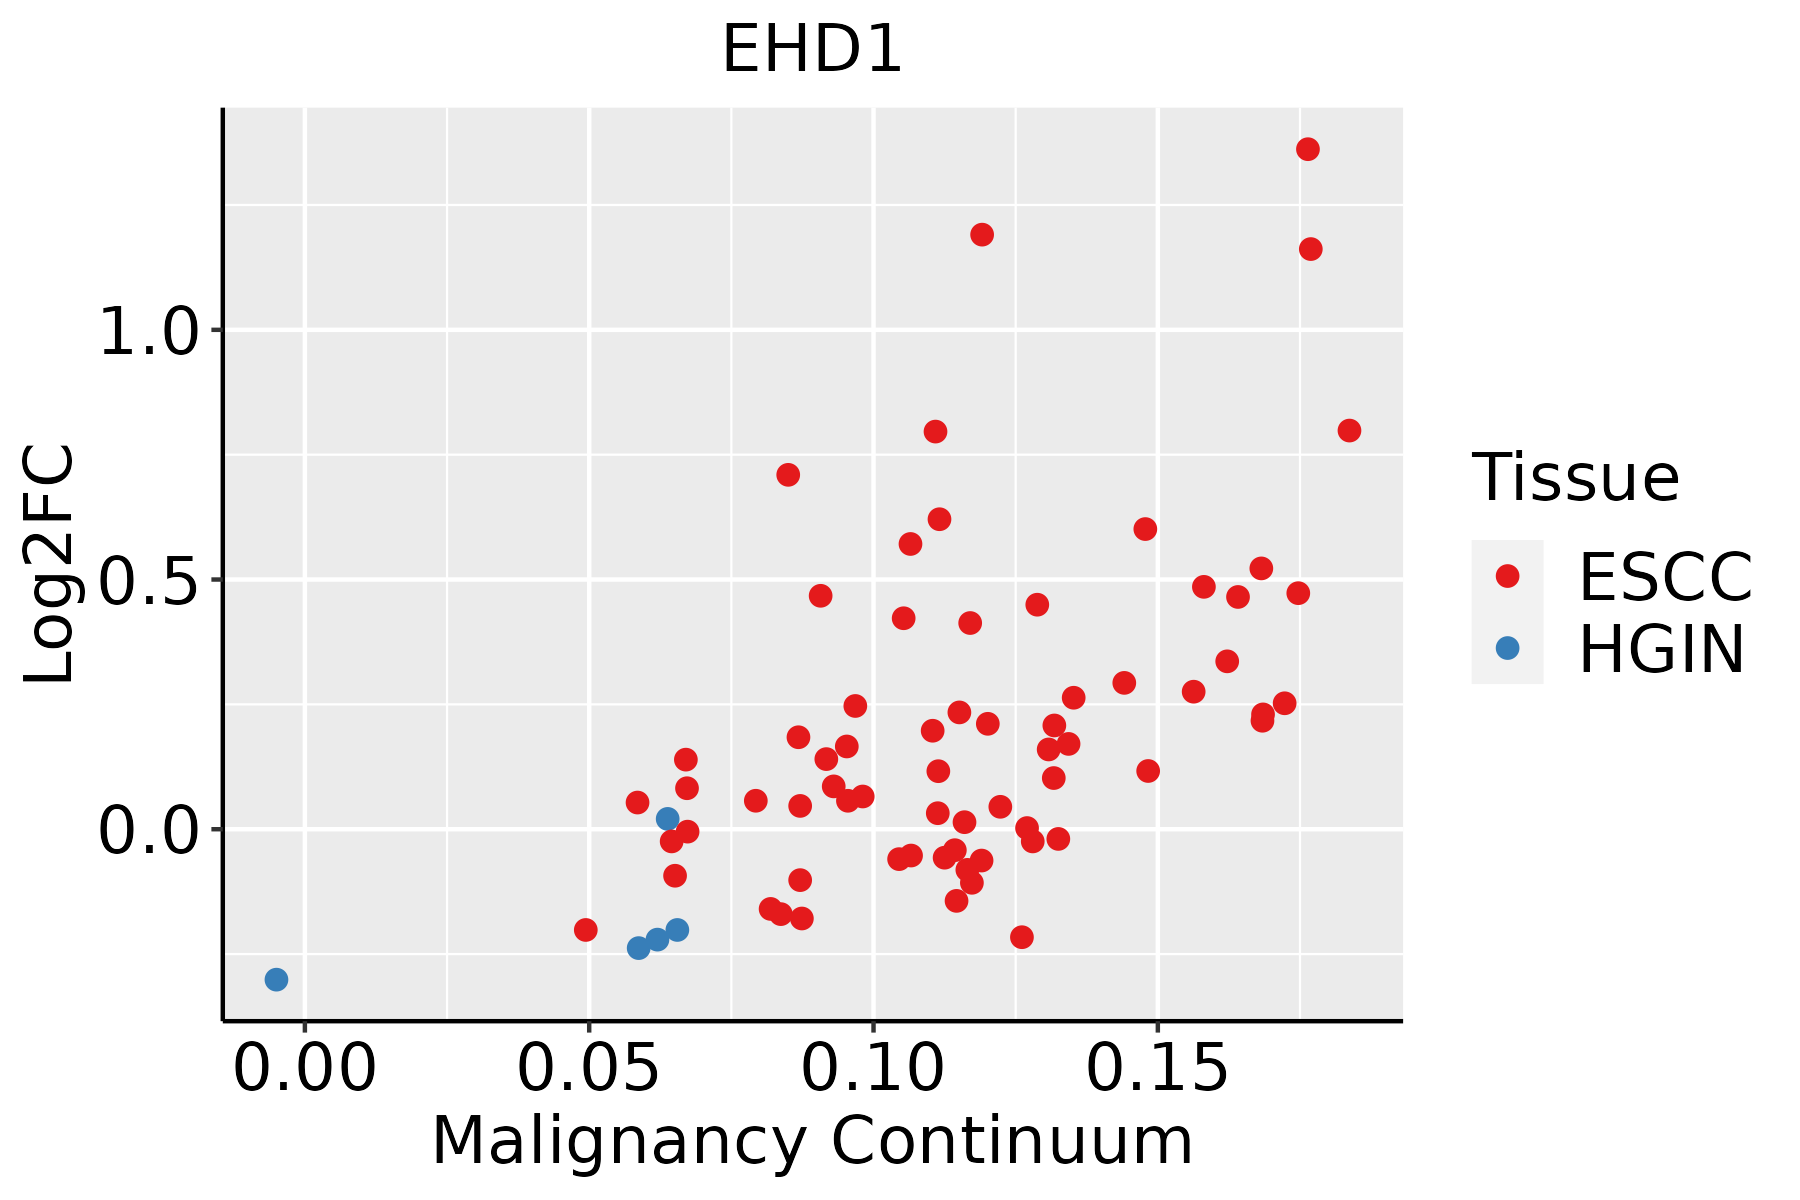 | ESCC: Esophageal squamous cell carcinoma |
| HGIN: High-grade intraepithelial neoplasias | ||
| LGIN: Low-grade intraepithelial neoplasias | ||
| Liver | 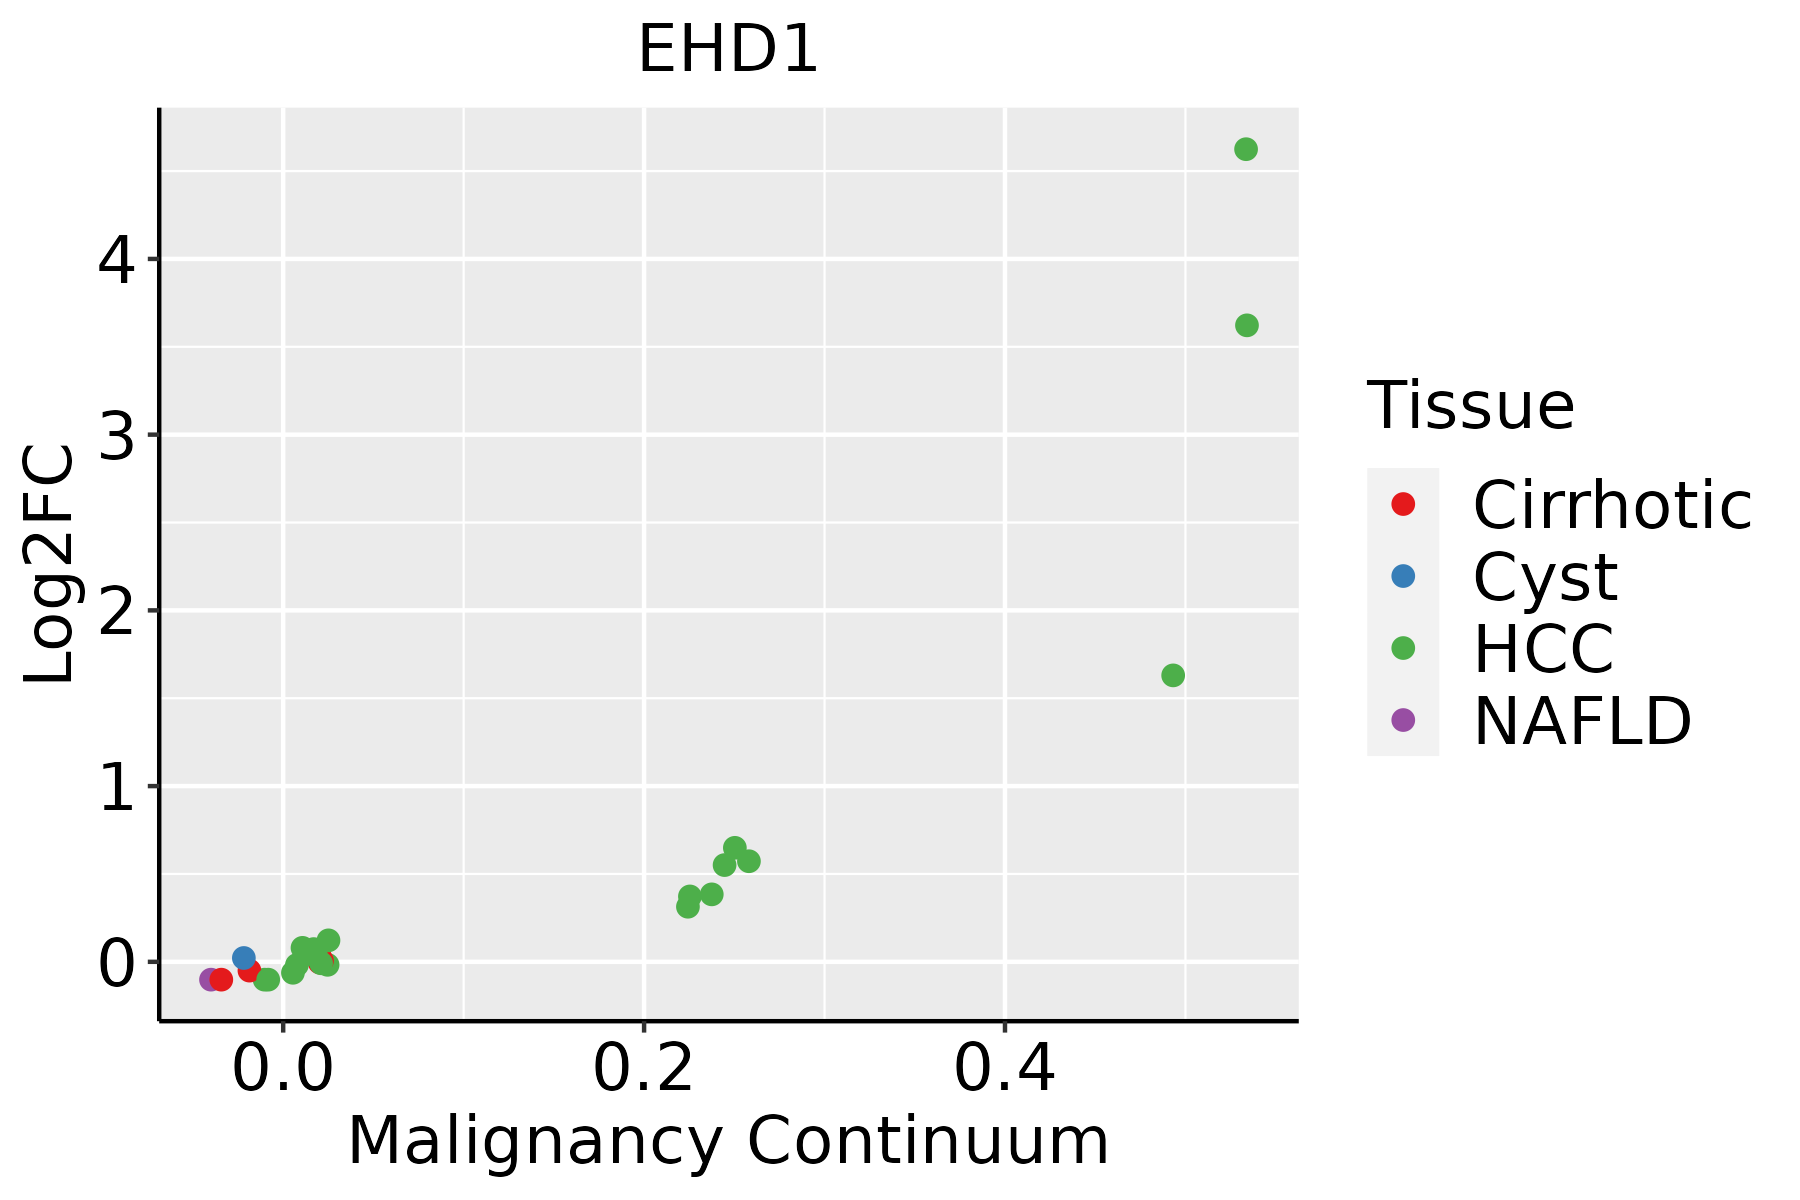 | HCC: Hepatocellular carcinoma |
| NAFLD: Non-alcoholic fatty liver disease | ||
| Oral Cavity |  | EOLP: Erosive Oral lichen planus |
| LP: leukoplakia | ||
| NEOLP: Non-erosive oral lichen planus | ||
| OSCC: Oral squamous cell carcinoma | ||
| Thyroid | 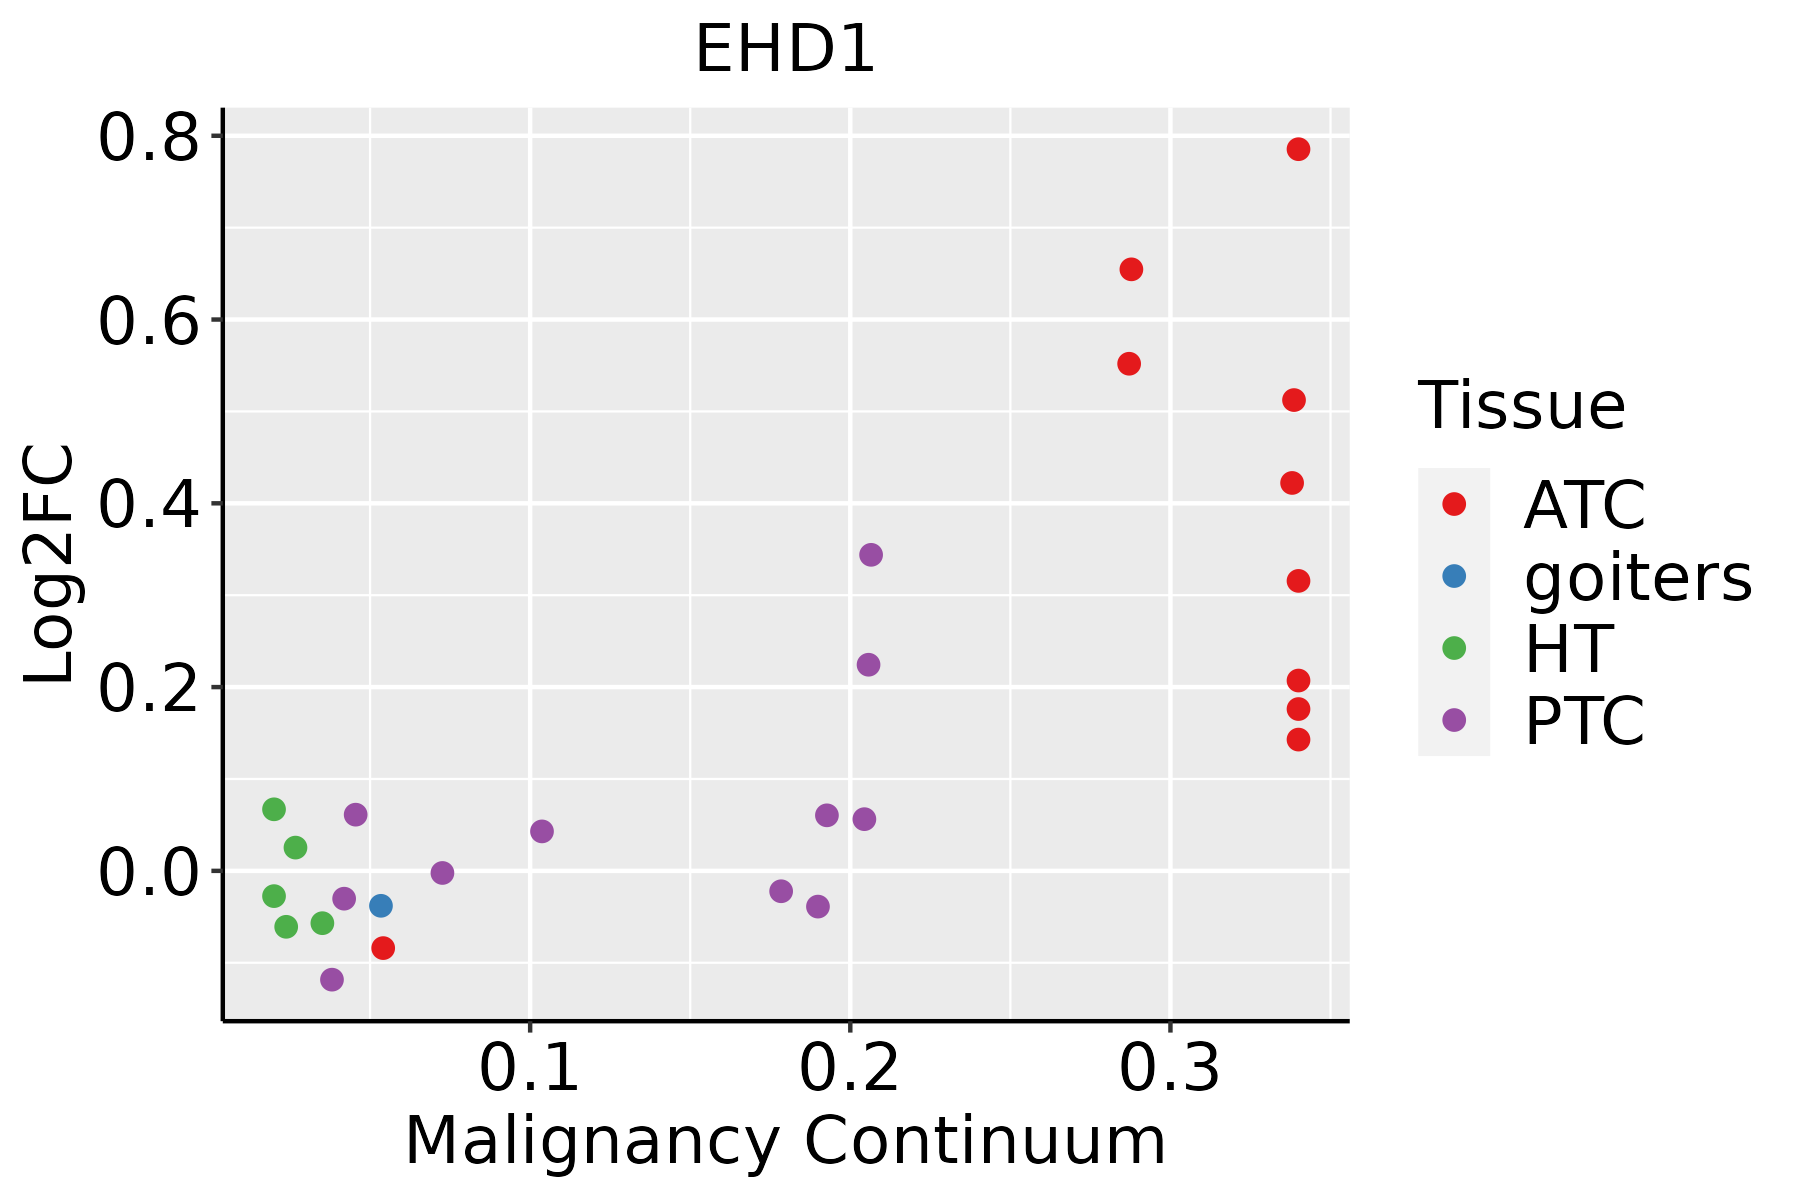 | ATC: Anaplastic thyroid cancer |
| HT: Hashimoto's thyroiditis | ||
| PTC: Papillary thyroid cancer |
| ∗log2FC in expression of this searched gene in stem-like cells from each diseased tissue sample relative to stem-like cells in normal samples in each tissue plotted against the malignancy continuum. Samples are colored based on if they are from different disease stage. |
Top |
Malignant transformation related pathway analysis |
| Find out the enriched GO biological processes and KEGG pathways involved in transition from healthy to precancer to cancer |
| Tissue | Disease Stage | Enriched GO biological Processes |
| Esophagus | ESCC |  |
| Skin | AK |  |
| Skin | SCCIS |  |
| Skin | cSCC |  |
| Thyroid | HT |  |
| ∗Top 15 enriched GO BP terms are showed in the bar plot of each disease state in each tissue. Each row represents a significant GO biological process which is colored according to the -log10(p.adjust). |
| Page: 1 2 3 4 5 6 7 8 9 |
| GO ID | Tissue | Disease Stage | Description | Gene Ratio | Bg Ratio | pvalue | p.adjust | Count |
| GO:0072659 | Colorectum | AD | protein localization to plasma membrane | 122/3918 | 284/18723 | 2.86e-17 | 1.49e-14 | 122 |
| GO:1990778 | Colorectum | AD | protein localization to cell periphery | 129/3918 | 333/18723 | 5.51e-14 | 1.15e-11 | 129 |
| GO:0016197 | Colorectum | AD | endosomal transport | 90/3918 | 230/18723 | 1.88e-10 | 1.73e-08 | 90 |
| GO:0098876 | Colorectum | AD | vesicle-mediated transport to the plasma membrane | 57/3918 | 136/18723 | 2.30e-08 | 1.27e-06 | 57 |
| GO:0032388 | Colorectum | AD | positive regulation of intracellular transport | 74/3918 | 202/18723 | 1.83e-07 | 7.80e-06 | 74 |
| GO:0032386 | Colorectum | AD | regulation of intracellular transport | 109/3918 | 337/18723 | 5.33e-07 | 1.95e-05 | 109 |
| GO:1990090 | Colorectum | AD | cellular response to nerve growth factor stimulus | 26/3918 | 53/18723 | 4.87e-06 | 1.28e-04 | 26 |
| GO:1990089 | Colorectum | AD | response to nerve growth factor | 26/3918 | 56/18723 | 1.71e-05 | 3.59e-04 | 26 |
| GO:0010975 | Colorectum | AD | regulation of neuron projection development | 129/3918 | 445/18723 | 2.88e-05 | 5.37e-04 | 129 |
| GO:0031346 | Colorectum | AD | positive regulation of cell projection organization | 104/3918 | 353/18723 | 8.26e-05 | 1.30e-03 | 104 |
| GO:0032456 | Colorectum | AD | endocytic recycling | 28/3918 | 73/18723 | 4.87e-04 | 5.30e-03 | 28 |
| GO:0010876 | Colorectum | AD | lipid localization | 120/3918 | 448/18723 | 1.59e-03 | 1.33e-02 | 120 |
| GO:00726591 | Colorectum | SER | protein localization to plasma membrane | 92/2897 | 284/18723 | 6.36e-13 | 1.86e-10 | 92 |
| GO:19907781 | Colorectum | SER | protein localization to cell periphery | 98/2897 | 333/18723 | 6.09e-11 | 9.57e-09 | 98 |
| GO:00323861 | Colorectum | SER | regulation of intracellular transport | 89/2897 | 337/18723 | 1.34e-07 | 7.96e-06 | 89 |
| GO:00323881 | Colorectum | SER | positive regulation of intracellular transport | 59/2897 | 202/18723 | 4.98e-07 | 2.48e-05 | 59 |
| GO:00161971 | Colorectum | SER | endosomal transport | 61/2897 | 230/18723 | 1.03e-05 | 3.35e-04 | 61 |
| GO:19900901 | Colorectum | SER | cellular response to nerve growth factor stimulus | 19/2897 | 53/18723 | 2.20e-04 | 3.89e-03 | 19 |
| GO:00988761 | Colorectum | SER | vesicle-mediated transport to the plasma membrane | 37/2897 | 136/18723 | 3.08e-04 | 5.00e-03 | 37 |
| GO:19900891 | Colorectum | SER | response to nerve growth factor | 19/2897 | 56/18723 | 4.92e-04 | 7.02e-03 | 19 |
| Page: 1 2 3 4 5 6 7 |
| Pathway ID | Tissue | Disease Stage | Description | Gene Ratio | Bg Ratio | pvalue | p.adjust | qvalue | Count |
| hsa04144 | Colorectum | AD | Endocytosis | 111/2092 | 251/8465 | 5.95e-12 | 1.42e-10 | 9.08e-11 | 111 |
| hsa041441 | Colorectum | AD | Endocytosis | 111/2092 | 251/8465 | 5.95e-12 | 1.42e-10 | 9.08e-11 | 111 |
| hsa041442 | Colorectum | SER | Endocytosis | 81/1580 | 251/8465 | 1.14e-07 | 2.36e-06 | 1.71e-06 | 81 |
| hsa041443 | Colorectum | SER | Endocytosis | 81/1580 | 251/8465 | 1.14e-07 | 2.36e-06 | 1.71e-06 | 81 |
| hsa041444 | Colorectum | MSS | Endocytosis | 102/1875 | 251/8465 | 1.85e-11 | 4.43e-10 | 2.71e-10 | 102 |
| hsa041445 | Colorectum | MSS | Endocytosis | 102/1875 | 251/8465 | 1.85e-11 | 4.43e-10 | 2.71e-10 | 102 |
| hsa04144210 | Esophagus | ESCC | Endocytosis | 186/4205 | 251/8465 | 9.74e-16 | 4.66e-14 | 2.39e-14 | 186 |
| hsa0414437 | Esophagus | ESCC | Endocytosis | 186/4205 | 251/8465 | 9.74e-16 | 4.66e-14 | 2.39e-14 | 186 |
| hsa0414412 | Liver | Cirrhotic | Endocytosis | 119/2530 | 251/8465 | 2.33e-09 | 4.56e-08 | 2.81e-08 | 119 |
| hsa0414413 | Liver | Cirrhotic | Endocytosis | 119/2530 | 251/8465 | 2.33e-09 | 4.56e-08 | 2.81e-08 | 119 |
| hsa0414422 | Liver | HCC | Endocytosis | 178/4020 | 251/8465 | 2.03e-14 | 5.22e-13 | 2.91e-13 | 178 |
| hsa0414432 | Liver | HCC | Endocytosis | 178/4020 | 251/8465 | 2.03e-14 | 5.22e-13 | 2.91e-13 | 178 |
| hsa0414427 | Oral cavity | OSCC | Endocytosis | 174/3704 | 251/8465 | 9.42e-17 | 4.51e-15 | 2.29e-15 | 174 |
| hsa04144112 | Oral cavity | OSCC | Endocytosis | 174/3704 | 251/8465 | 9.42e-17 | 4.51e-15 | 2.29e-15 | 174 |
| hsa0414428 | Oral cavity | LP | Endocytosis | 121/2418 | 251/8465 | 1.89e-11 | 3.70e-10 | 2.38e-10 | 121 |
| hsa0414436 | Oral cavity | LP | Endocytosis | 121/2418 | 251/8465 | 1.89e-11 | 3.70e-10 | 2.38e-10 | 121 |
| Page: 1 |
Top |
Cell-cell communication analysis |
| Identification of potential cell-cell interactions between two cell types and their ligand-receptor pairs for different disease states |
| Ligand | Receptor | LRpair | Pathway | Tissue | Disease Stage |
| Page: 1 |
Top |
Single-cell gene regulatory network inference analysis |
| Find out the significant the regulons (TFs) and the target genes of each regulon across cell types for different disease states |
| TF | Cell Type | Tissue | Disease Stage | Target Gene | RSS | Regulon Activity |
| ∗The dot plots of a searched regulon are shown for all cell subpopulations in each disease state of each tissue based on the regulon specific score inferred using pySCENIC and by calculating the average expression. |
| Page: 1 |
Top |
Somatic mutation of malignant transformation related genes |
| Annotation of somatic variants for genes involved in malignant transformation |
| Hugo Symbol | Variant Class | Variant Classification | dbSNP RS | HGVSc | HGVSp | HGVSp Short | SWISSPROT | BIOTYPE | SIFT | PolyPhen | Tumor Sample Barcode | Tissue | Histology | Sex | Age | Stage | Therapy Types | Drugs | Outcome |
| EHD1 | SNV | Missense_Mutation | c.961N>T | p.His321Tyr | p.H321Y | protein_coding | deleterious(0) | possibly_damaging(0.519) | TCGA-AR-A0TZ-01 | Breast | breast invasive carcinoma | Female | <65 | III/IV | Unspecific | Doxorubicin | PD | ||
| EHD1 | SNV | Missense_Mutation | rs772683924 | c.719N>T | p.Thr240Met | p.T240M | protein_coding | tolerated(0.18) | probably_damaging(0.999) | TCGA-BH-A18G-01 | Breast | breast invasive carcinoma | Female | >=65 | I/II | Unknown | Unknown | SD | |
| EHD1 | SNV | Missense_Mutation | c.580N>A | p.Glu194Lys | p.E194K | protein_coding | deleterious(0) | probably_damaging(0.997) | TCGA-BH-A1FC-01 | Breast | breast invasive carcinoma | Female | >=65 | I/II | Unknown | Unknown | SD | ||
| EHD1 | SNV | Missense_Mutation | c.865N>A | p.Glu289Lys | p.E289K | protein_coding | tolerated(0.11) | possibly_damaging(0.511) | TCGA-EW-A1IW-01 | Breast | breast invasive carcinoma | Female | >=65 | I/II | Hormone Therapy | aromasin | SD | ||
| EHD1 | SNV | Missense_Mutation | c.166N>G | p.Phe56Val | p.F56V | protein_coding | deleterious(0) | possibly_damaging(0.516) | TCGA-EW-A1J1-01 | Breast | breast invasive carcinoma | Female | <65 | I/II | Chemotherapy | taxotere | SD | ||
| EHD1 | deletion | In_Frame_Del | c.1212_1220delCGCGCGGCT | p.Ile404_Leu407delinsMet | p.I404_L407delinsM | protein_coding | TCGA-BH-A0HY-01 | Breast | breast invasive carcinoma | Female | <65 | I/II | Hormone Therapy | taxotere | CR | ||||
| EHD1 | deletion | Frame_Shift_Del | novel | c.77delA | p.Lys26ArgfsTer67 | p.K26Rfs*67 | protein_coding | TCGA-EW-A2FV-01 | Breast | breast invasive carcinoma | Female | <65 | III/IV | Chemotherapy | docetaxel | SD | |||
| EHD1 | SNV | Missense_Mutation | novel | c.625G>A | p.Asp209Asn | p.D209N | protein_coding | deleterious(0) | probably_damaging(0.998) | TCGA-DS-A1OB-01 | Cervix | cervical & endocervical cancer | Female | <65 | I/II | Chemotherapy | carboplatin | PD | |
| EHD1 | SNV | Missense_Mutation | c.1184C>A | p.Thr395Lys | p.T395K | protein_coding | tolerated(0.68) | benign(0.106) | TCGA-EA-A3HT-01 | Cervix | cervical & endocervical cancer | Female | >=65 | I/II | Unknown | Unknown | SD | ||
| EHD1 | SNV | Missense_Mutation | c.371N>T | p.Pro124Leu | p.P124L | protein_coding | deleterious(0) | probably_damaging(1) | TCGA-JW-A852-01 | Cervix | cervical & endocervical cancer | Female | <65 | I/II | Unknown | Unknown | PD |
| Page: 1 2 3 4 5 6 |
Top |
Related drugs of malignant transformation related genes |
| Identification of chemicals and drugs interact with genes involved in malignant transfromation |
| (DGIdb 4.0) |
| Entrez ID | Symbol | Category | Interaction Types | Drug Claim Name | Drug Name | PMIDs |
| Page: 1 |

Copyright 2023-Present -The University of Texas Health Science Center at Houston |