
|
|||||
|
 | |
| |
| |
| |
| |
| |
|
Gene: DPYS |
Gene summary for DPYS |
| Gene information | Species | Human | Gene symbol | DPYS | Gene ID | 1807 |
| Gene name | dihydropyrimidinase | |
| Gene Alias | DHP | |
| Cytomap | 8q22.3 | |
| Gene Type | protein-coding | GO ID | GO:0006082 | UniProtAcc | Q14117 |
Top |
Malignant transformation analysis |
| Identification of the aberrant gene expression in precancerous and cancerous lesions by comparing the gene expression of stem-like cells in diseased tissues with normal stem cells |
| Entrez ID | Symbol | Replicates | Species | Organ | Tissue | Adj P-value | Log2FC | Malignancy |
| 1807 | DPYS | NAFLD1 | Human | Liver | NAFLD | 2.18e-11 | 1.00e+00 | -0.04 |
| 1807 | DPYS | S43 | Human | Liver | Cirrhotic | 6.09e-08 | -2.63e-01 | -0.0187 |
| 1807 | DPYS | HCC1_Meng | Human | Liver | HCC | 1.31e-65 | -1.38e-01 | 0.0246 |
| 1807 | DPYS | HCC2_Meng | Human | Liver | HCC | 1.60e-14 | -3.95e-01 | 0.0107 |
| 1807 | DPYS | cirrhotic1 | Human | Liver | Cirrhotic | 6.48e-05 | -2.42e-01 | 0.0202 |
| 1807 | DPYS | cirrhotic2 | Human | Liver | Cirrhotic | 6.86e-09 | -2.01e-01 | 0.0201 |
| 1807 | DPYS | cirrhotic3 | Human | Liver | Cirrhotic | 3.48e-02 | -3.02e-01 | 0.0215 |
| 1807 | DPYS | HCC1 | Human | Liver | HCC | 2.39e-11 | 2.18e+00 | 0.5336 |
| 1807 | DPYS | HCC2 | Human | Liver | HCC | 1.03e-20 | 3.19e+00 | 0.5341 |
| 1807 | DPYS | Pt13.a | Human | Liver | HCC | 6.90e-03 | -2.78e-02 | 0.021 |
| 1807 | DPYS | Pt13.b | Human | Liver | HCC | 1.36e-16 | -1.00e-01 | 0.0251 |
| 1807 | DPYS | Pt14.a | Human | Liver | HCC | 4.58e-02 | 9.85e-02 | 0.0169 |
| 1807 | DPYS | Pt14.d | Human | Liver | HCC | 8.19e-03 | -2.08e-01 | 0.0143 |
| 1807 | DPYS | S016 | Human | Liver | HCC | 3.59e-03 | -3.63e-01 | 0.2243 |
| Page: 1 |
| Tissue | Expression Dynamics | Abbreviation |
| Liver | 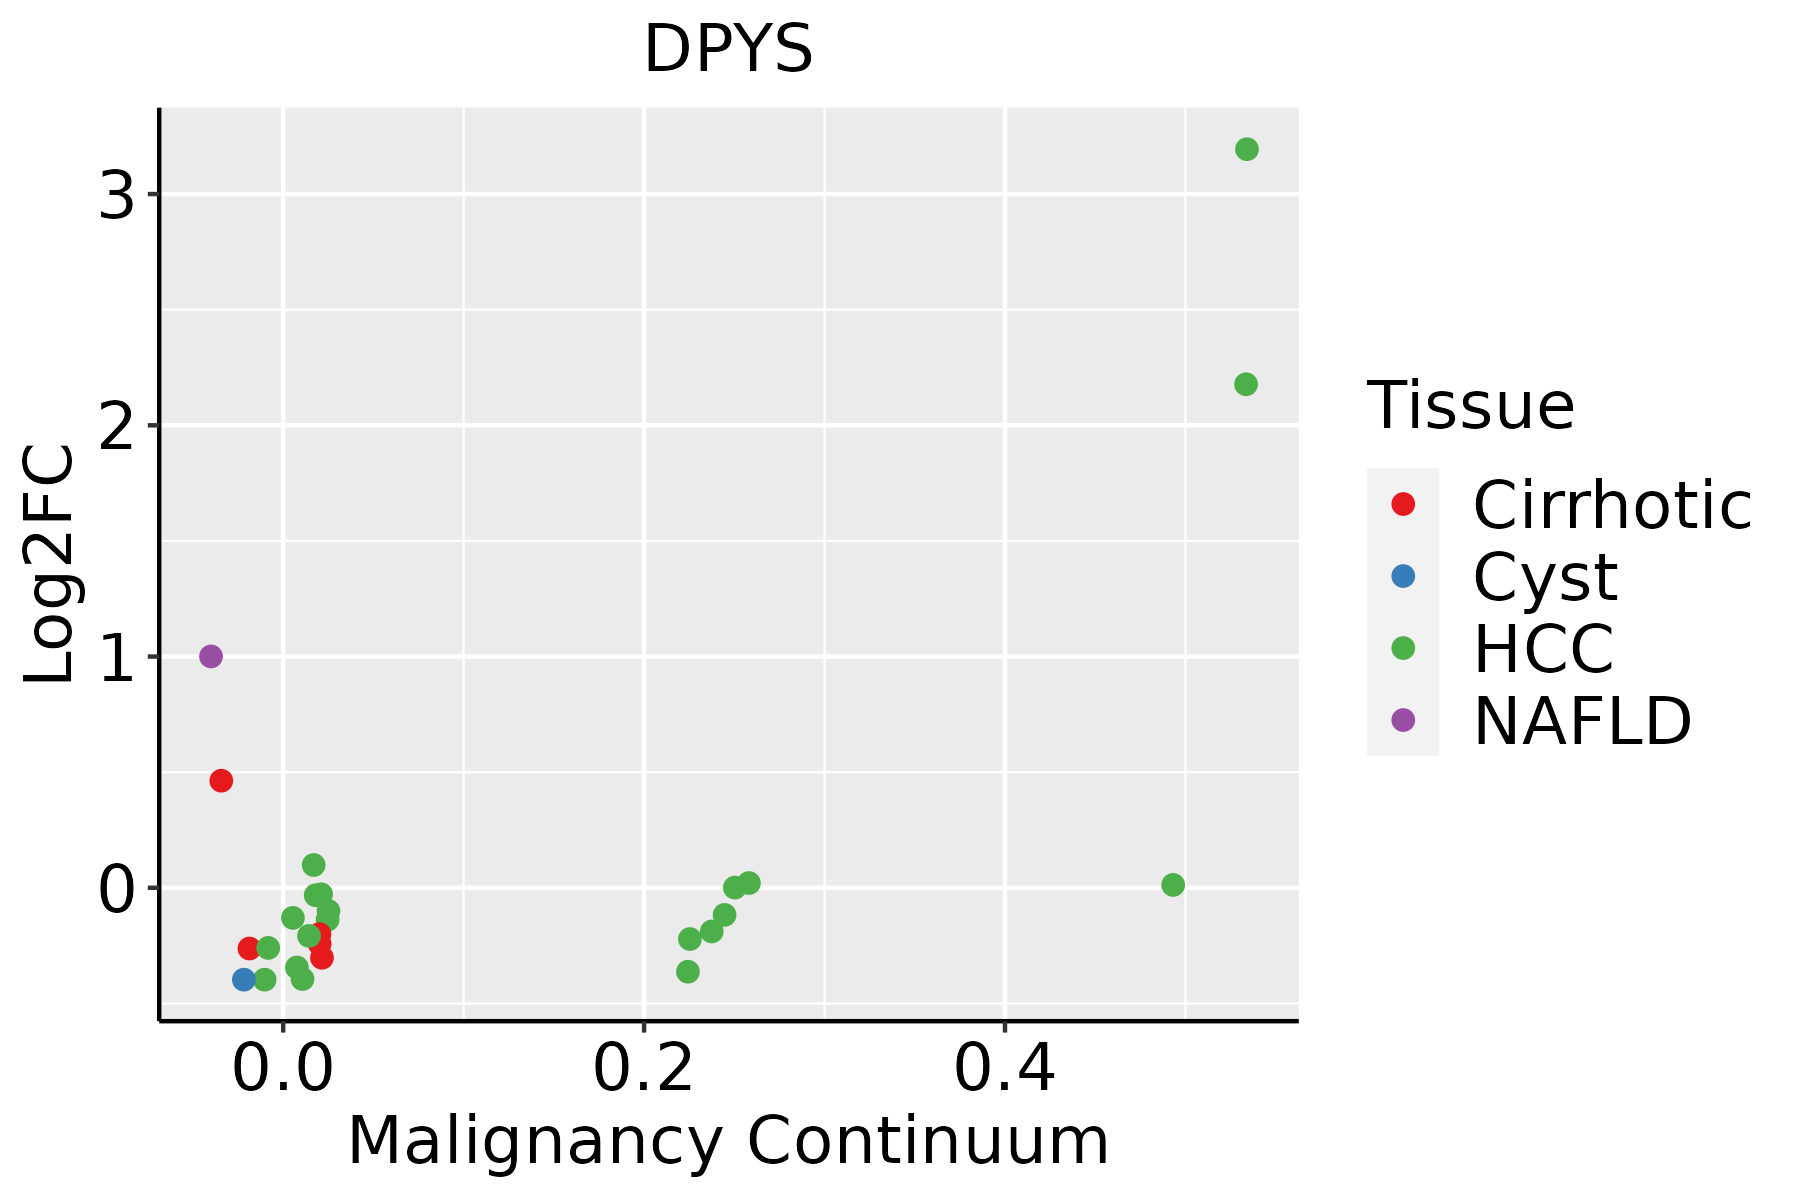 | HCC: Hepatocellular carcinoma |
| NAFLD: Non-alcoholic fatty liver disease |
| ∗log2FC in expression of this searched gene in stem-like cells from each diseased tissue sample relative to stem-like cells in normal samples in each tissue plotted against the malignancy continuum. Samples are colored based on if they are from different disease stage. |
Top |
Malignant transformation related pathway analysis |
| Find out the enriched GO biological processes and KEGG pathways involved in transition from healthy to precancer to cancer |
| Tissue | Disease Stage | Enriched GO biological Processes |
| Esophagus | ESCC |  |
| Skin | AK |  |
| Skin | SCCIS |  |
| Skin | cSCC |  |
| Thyroid | HT |  |
| ∗Top 15 enriched GO BP terms are showed in the bar plot of each disease state in each tissue. Each row represents a significant GO biological process which is colored according to the -log10(p.adjust). |
| Page: 1 2 3 4 5 6 7 8 9 |
| GO ID | Tissue | Disease Stage | Description | Gene Ratio | Bg Ratio | pvalue | p.adjust | Count |
| GO:0016049110 | Esophagus | ESCC | cell growth | 289/8552 | 482/18723 | 1.29e-10 | 3.77e-09 | 289 |
| GO:000155819 | Esophagus | ESCC | regulation of cell growth | 248/8552 | 414/18723 | 2.97e-09 | 6.45e-08 | 248 |
| GO:000701527 | Esophagus | ESCC | actin filament organization | 259/8552 | 442/18723 | 2.37e-08 | 4.50e-07 | 259 |
| GO:003253520 | Esophagus | ESCC | regulation of cellular component size | 227/8552 | 383/18723 | 4.77e-08 | 8.60e-07 | 227 |
| GO:005101727 | Esophagus | ESCC | actin filament bundle assembly | 100/8552 | 157/18723 | 3.87e-06 | 4.17e-05 | 100 |
| GO:006157227 | Esophagus | ESCC | actin filament bundle organization | 101/8552 | 161/18723 | 9.22e-06 | 8.82e-05 | 101 |
| GO:003134616 | Esophagus | ESCC | positive regulation of cell projection organization | 201/8552 | 353/18723 | 1.19e-05 | 1.11e-04 | 201 |
| GO:00083619 | Esophagus | ESCC | regulation of cell size | 107/8552 | 181/18723 | 1.81e-04 | 1.16e-03 | 107 |
| GO:006156415 | Esophagus | ESCC | axon development | 251/8552 | 467/18723 | 2.41e-04 | 1.49e-03 | 251 |
| GO:001097516 | Esophagus | ESCC | regulation of neuron projection development | 240/8552 | 445/18723 | 2.48e-04 | 1.53e-03 | 240 |
| GO:006049118 | Esophagus | ESCC | regulation of cell projection assembly | 110/8552 | 188/18723 | 2.60e-04 | 1.58e-03 | 110 |
| GO:012003218 | Esophagus | ESCC | regulation of plasma membrane bounded cell projection assembly | 108/8552 | 186/18723 | 4.37e-04 | 2.46e-03 | 108 |
| GO:006056010 | Esophagus | ESCC | developmental growth involved in morphogenesis | 131/8552 | 234/18723 | 9.28e-04 | 4.73e-03 | 131 |
| GO:01200347 | Esophagus | ESCC | positive regulation of plasma membrane bounded cell projection assembly | 64/8552 | 105/18723 | 1.15e-03 | 5.70e-03 | 64 |
| GO:00486785 | Esophagus | ESCC | response to axon injury | 51/8552 | 83/18723 | 2.74e-03 | 1.16e-02 | 51 |
| GO:000740915 | Esophagus | ESCC | axonogenesis | 219/8552 | 418/18723 | 3.14e-03 | 1.31e-02 | 219 |
| GO:00109764 | Esophagus | ESCC | positive regulation of neuron projection development | 91/8552 | 163/18723 | 5.72e-03 | 2.13e-02 | 91 |
| GO:004858810 | Esophagus | ESCC | developmental cell growth | 125/8552 | 234/18723 | 1.01e-02 | 3.46e-02 | 125 |
| GO:00194396 | Liver | NAFLD | aromatic compound catabolic process | 102/1882 | 467/18723 | 2.29e-14 | 1.91e-11 | 102 |
| GO:19013616 | Liver | NAFLD | organic cyclic compound catabolic process | 105/1882 | 495/18723 | 7.04e-14 | 5.15e-11 | 105 |
| Page: 1 2 3 4 5 6 7 8 9 10 11 12 |
| Pathway ID | Tissue | Disease Stage | Description | Gene Ratio | Bg Ratio | pvalue | p.adjust | qvalue | Count |
| hsa00410 | Liver | Cirrhotic | beta-Alanine metabolism | 18/2530 | 31/8465 | 1.00e-03 | 5.57e-03 | 3.43e-03 | 18 |
| hsa00770 | Liver | Cirrhotic | Pantothenate and CoA biosynthesis | 13/2530 | 21/8465 | 2.32e-03 | 9.90e-03 | 6.10e-03 | 13 |
| hsa00240 | Liver | Cirrhotic | Pyrimidine metabolism | 27/2530 | 58/8465 | 5.31e-03 | 1.88e-02 | 1.16e-02 | 27 |
| hsa00983 | Liver | Cirrhotic | Drug metabolism - other enzymes | 34/2530 | 80/8465 | 1.08e-02 | 3.57e-02 | 2.20e-02 | 34 |
| hsa004101 | Liver | Cirrhotic | beta-Alanine metabolism | 18/2530 | 31/8465 | 1.00e-03 | 5.57e-03 | 3.43e-03 | 18 |
| hsa007701 | Liver | Cirrhotic | Pantothenate and CoA biosynthesis | 13/2530 | 21/8465 | 2.32e-03 | 9.90e-03 | 6.10e-03 | 13 |
| hsa002401 | Liver | Cirrhotic | Pyrimidine metabolism | 27/2530 | 58/8465 | 5.31e-03 | 1.88e-02 | 1.16e-02 | 27 |
| hsa009831 | Liver | Cirrhotic | Drug metabolism - other enzymes | 34/2530 | 80/8465 | 1.08e-02 | 3.57e-02 | 2.20e-02 | 34 |
| hsa002402 | Liver | HCC | Pyrimidine metabolism | 44/4020 | 58/8465 | 9.34e-06 | 7.11e-05 | 3.95e-05 | 44 |
| hsa009832 | Liver | HCC | Drug metabolism - other enzymes | 54/4020 | 80/8465 | 2.25e-04 | 1.09e-03 | 6.08e-04 | 54 |
| hsa004102 | Liver | HCC | beta-Alanine metabolism | 22/4020 | 31/8465 | 6.93e-03 | 1.92e-02 | 1.07e-02 | 22 |
| hsa007702 | Liver | HCC | Pantothenate and CoA biosynthesis | 16/4020 | 21/8465 | 7.16e-03 | 1.97e-02 | 1.09e-02 | 16 |
| hsa002403 | Liver | HCC | Pyrimidine metabolism | 44/4020 | 58/8465 | 9.34e-06 | 7.11e-05 | 3.95e-05 | 44 |
| hsa009833 | Liver | HCC | Drug metabolism - other enzymes | 54/4020 | 80/8465 | 2.25e-04 | 1.09e-03 | 6.08e-04 | 54 |
| hsa004103 | Liver | HCC | beta-Alanine metabolism | 22/4020 | 31/8465 | 6.93e-03 | 1.92e-02 | 1.07e-02 | 22 |
| hsa007703 | Liver | HCC | Pantothenate and CoA biosynthesis | 16/4020 | 21/8465 | 7.16e-03 | 1.97e-02 | 1.09e-02 | 16 |
| Page: 1 |
Top |
Cell-cell communication analysis |
| Identification of potential cell-cell interactions between two cell types and their ligand-receptor pairs for different disease states |
| Ligand | Receptor | LRpair | Pathway | Tissue | Disease Stage |
| Page: 1 |
Top |
Single-cell gene regulatory network inference analysis |
| Find out the significant the regulons (TFs) and the target genes of each regulon across cell types for different disease states |
| TF | Cell Type | Tissue | Disease Stage | Target Gene | RSS | Regulon Activity |
| ∗The dot plots of a searched regulon are shown for all cell subpopulations in each disease state of each tissue based on the regulon specific score inferred using pySCENIC and by calculating the average expression. |
| Page: 1 |
Top |
Somatic mutation of malignant transformation related genes |
| Annotation of somatic variants for genes involved in malignant transformation |
| Hugo Symbol | Variant Class | Variant Classification | dbSNP RS | HGVSc | HGVSp | HGVSp Short | SWISSPROT | BIOTYPE | SIFT | PolyPhen | Tumor Sample Barcode | Tissue | Histology | Sex | Age | Stage | Therapy Types | Drugs | Outcome |
| DPYS | SNV | Missense_Mutation | c.298G>C | p.Asp100His | p.D100H | Q14117 | protein_coding | deleterious(0) | probably_damaging(1) | TCGA-A2-A0ET-01 | Breast | breast invasive carcinoma | Female | <65 | III/IV | Chemotherapy | cytoxan | SD | |
| DPYS | SNV | Missense_Mutation | c.1219N>T | p.Asp407Tyr | p.D407Y | Q14117 | protein_coding | deleterious(0) | probably_damaging(0.998) | TCGA-AR-A24Q-01 | Breast | breast invasive carcinoma | Female | <65 | I/II | Chemotherapy | doxorubicin | SD | |
| DPYS | SNV | Missense_Mutation | novel | c.764C>A | p.Ala255Asp | p.A255D | Q14117 | protein_coding | deleterious(0) | probably_damaging(0.98) | TCGA-HN-A2NL-01 | Breast | breast invasive carcinoma | Female | <65 | I/II | Chemotherapy | cyclophosphamide | SD |
| DPYS | insertion | Frame_Shift_Ins | novel | c.1005dupA | p.Ala336SerfsTer6 | p.A336Sfs*6 | Q14117 | protein_coding | TCGA-AN-A0AK-01 | Breast | breast invasive carcinoma | Female | >=65 | I/II | Unknown | Unknown | SD | ||
| DPYS | SNV | Missense_Mutation | c.634N>G | p.Thr212Ala | p.T212A | Q14117 | protein_coding | deleterious(0.01) | possibly_damaging(0.511) | TCGA-FU-A3HZ-01 | Cervix | cervical & endocervical cancer | Female | <65 | I/II | Chemotherapy | cisplatin | CR | |
| DPYS | SNV | Missense_Mutation | c.1359C>A | p.Phe453Leu | p.F453L | Q14117 | protein_coding | tolerated(1) | benign(0) | TCGA-A6-4107-01 | Colorectum | colon adenocarcinoma | Female | <65 | III/IV | Chemotherapy | 5 | SD | |
| DPYS | SNV | Missense_Mutation | c.452A>G | p.Gln151Arg | p.Q151R | Q14117 | protein_coding | tolerated(0.35) | benign(0) | TCGA-A6-6653-01 | Colorectum | colon adenocarcinoma | Male | >=65 | I/II | Unknown | Unknown | SD | |
| DPYS | SNV | Missense_Mutation | c.442N>T | p.Ile148Phe | p.I148F | Q14117 | protein_coding | deleterious(0.04) | benign(0.206) | TCGA-AA-3710-01 | Colorectum | colon adenocarcinoma | Female | >=65 | I/II | Unknown | Unknown | SD | |
| DPYS | SNV | Missense_Mutation | c.1158N>A | p.Phe386Leu | p.F386L | Q14117 | protein_coding | deleterious(0.05) | probably_damaging(1) | TCGA-AA-3715-01 | Colorectum | colon adenocarcinoma | Male | >=65 | I/II | Unknown | Unknown | PD | |
| DPYS | SNV | Missense_Mutation | c.875N>T | p.Ala292Val | p.A292V | Q14117 | protein_coding | deleterious(0) | possibly_damaging(0.742) | TCGA-AA-3821-01 | Colorectum | colon adenocarcinoma | Female | >=65 | I/II | Unknown | Unknown | SD |
| Page: 1 2 3 4 5 6 7 8 9 |
Top |
Related drugs of malignant transformation related genes |
| Identification of chemicals and drugs interact with genes involved in malignant transfromation |
| (DGIdb 4.0) |
| Entrez ID | Symbol | Category | Interaction Types | Drug Claim Name | Drug Name | PMIDs |
| 1807 | DPYS | ENZYME | fluorouracil | FLUOROURACIL | 26244261 | |
| 1807 | DPYS | ENZYME | atenolol | ATENOLOL | ||
| 1807 | DPYS | ENZYME | DEXRAZOXANE | DEXRAZOXANE | 7902252 |
| Page: 1 |

Copyright 2023-Present -The University of Texas Health Science Center at Houston |