
|
|||||
|
 | |
| |
| |
| |
| |
| |
|
Gene: BTBD2 |
Gene summary for BTBD2 |
| Gene information | Species | Human | Gene symbol | BTBD2 | Gene ID | 55643 |
| Gene name | BTB domain containing 2 | |
| Gene Alias | BTBD2 | |
| Cytomap | 19p13.3 | |
| Gene Type | protein-coding | GO ID | GO:0007275 | UniProtAcc | Q9BX70 |
Top |
Malignant transformation analysis |
| Identification of the aberrant gene expression in precancerous and cancerous lesions by comparing the gene expression of stem-like cells in diseased tissues with normal stem cells |
| Entrez ID | Symbol | Replicates | Species | Organ | Tissue | Adj P-value | Log2FC | Malignancy |
| 55643 | BTBD2 | HTA11_3410_2000001011 | Human | Colorectum | AD | 4.89e-02 | 2.38e-01 | 0.0155 |
| 55643 | BTBD2 | HTA11_347_2000001011 | Human | Colorectum | AD | 5.37e-06 | 3.87e-01 | -0.1954 |
| 55643 | BTBD2 | HTA11_696_2000001011 | Human | Colorectum | AD | 7.05e-06 | 3.56e-01 | -0.1464 |
| 55643 | BTBD2 | HTA11_866_2000001011 | Human | Colorectum | AD | 4.40e-02 | 2.73e-01 | -0.1001 |
| 55643 | BTBD2 | HTA11_1391_2000001011 | Human | Colorectum | AD | 8.61e-10 | 6.89e-01 | -0.059 |
| 55643 | BTBD2 | HTA11_546_2000001011 | Human | Colorectum | AD | 2.34e-06 | 6.08e-01 | -0.0842 |
| 55643 | BTBD2 | HTA11_10711_2000001011 | Human | Colorectum | AD | 1.01e-03 | 4.75e-01 | 0.0338 |
| 55643 | BTBD2 | HTA11_7696_3000711011 | Human | Colorectum | AD | 6.38e-27 | 8.65e-01 | 0.0674 |
| 55643 | BTBD2 | HTA11_6818_2000001011 | Human | Colorectum | AD | 2.24e-03 | 6.75e-01 | 0.0112 |
| 55643 | BTBD2 | HTA11_6818_2000001021 | Human | Colorectum | AD | 2.62e-04 | 5.23e-01 | 0.0588 |
| 55643 | BTBD2 | HTA11_99999971662_82457 | Human | Colorectum | MSS | 1.51e-02 | 3.35e-01 | 0.3859 |
| 55643 | BTBD2 | HTA11_99999974143_84620 | Human | Colorectum | MSS | 4.70e-03 | 2.86e-01 | 0.3005 |
| 55643 | BTBD2 | A015-C-203 | Human | Colorectum | FAP | 1.11e-05 | -6.49e-02 | -0.1294 |
| 55643 | BTBD2 | A002-C-201 | Human | Colorectum | FAP | 4.35e-02 | -6.44e-02 | 0.0324 |
| 55643 | BTBD2 | A002-C-205 | Human | Colorectum | FAP | 3.27e-06 | -1.77e-01 | -0.1236 |
| 55643 | BTBD2 | A015-C-006 | Human | Colorectum | FAP | 3.25e-03 | 3.03e-02 | -0.0994 |
| 55643 | BTBD2 | A002-C-114 | Human | Colorectum | FAP | 2.96e-03 | -3.25e-02 | -0.1561 |
| 55643 | BTBD2 | A015-C-104 | Human | Colorectum | FAP | 2.17e-07 | 1.56e-02 | -0.1899 |
| 55643 | BTBD2 | A002-C-016 | Human | Colorectum | FAP | 2.01e-02 | -6.99e-02 | 0.0521 |
| 55643 | BTBD2 | A002-C-116 | Human | Colorectum | FAP | 1.75e-08 | -1.24e-01 | -0.0452 |
| Page: 1 2 3 4 5 6 |
| Tissue | Expression Dynamics | Abbreviation |
| Colorectum (GSE201348) |  | FAP: Familial adenomatous polyposis |
| CRC: Colorectal cancer | ||
| Colorectum (HTA11) |  | AD: Adenomas |
| SER: Sessile serrated lesions | ||
| MSI-H: Microsatellite-high colorectal cancer | ||
| MSS: Microsatellite stable colorectal cancer | ||
| Esophagus | 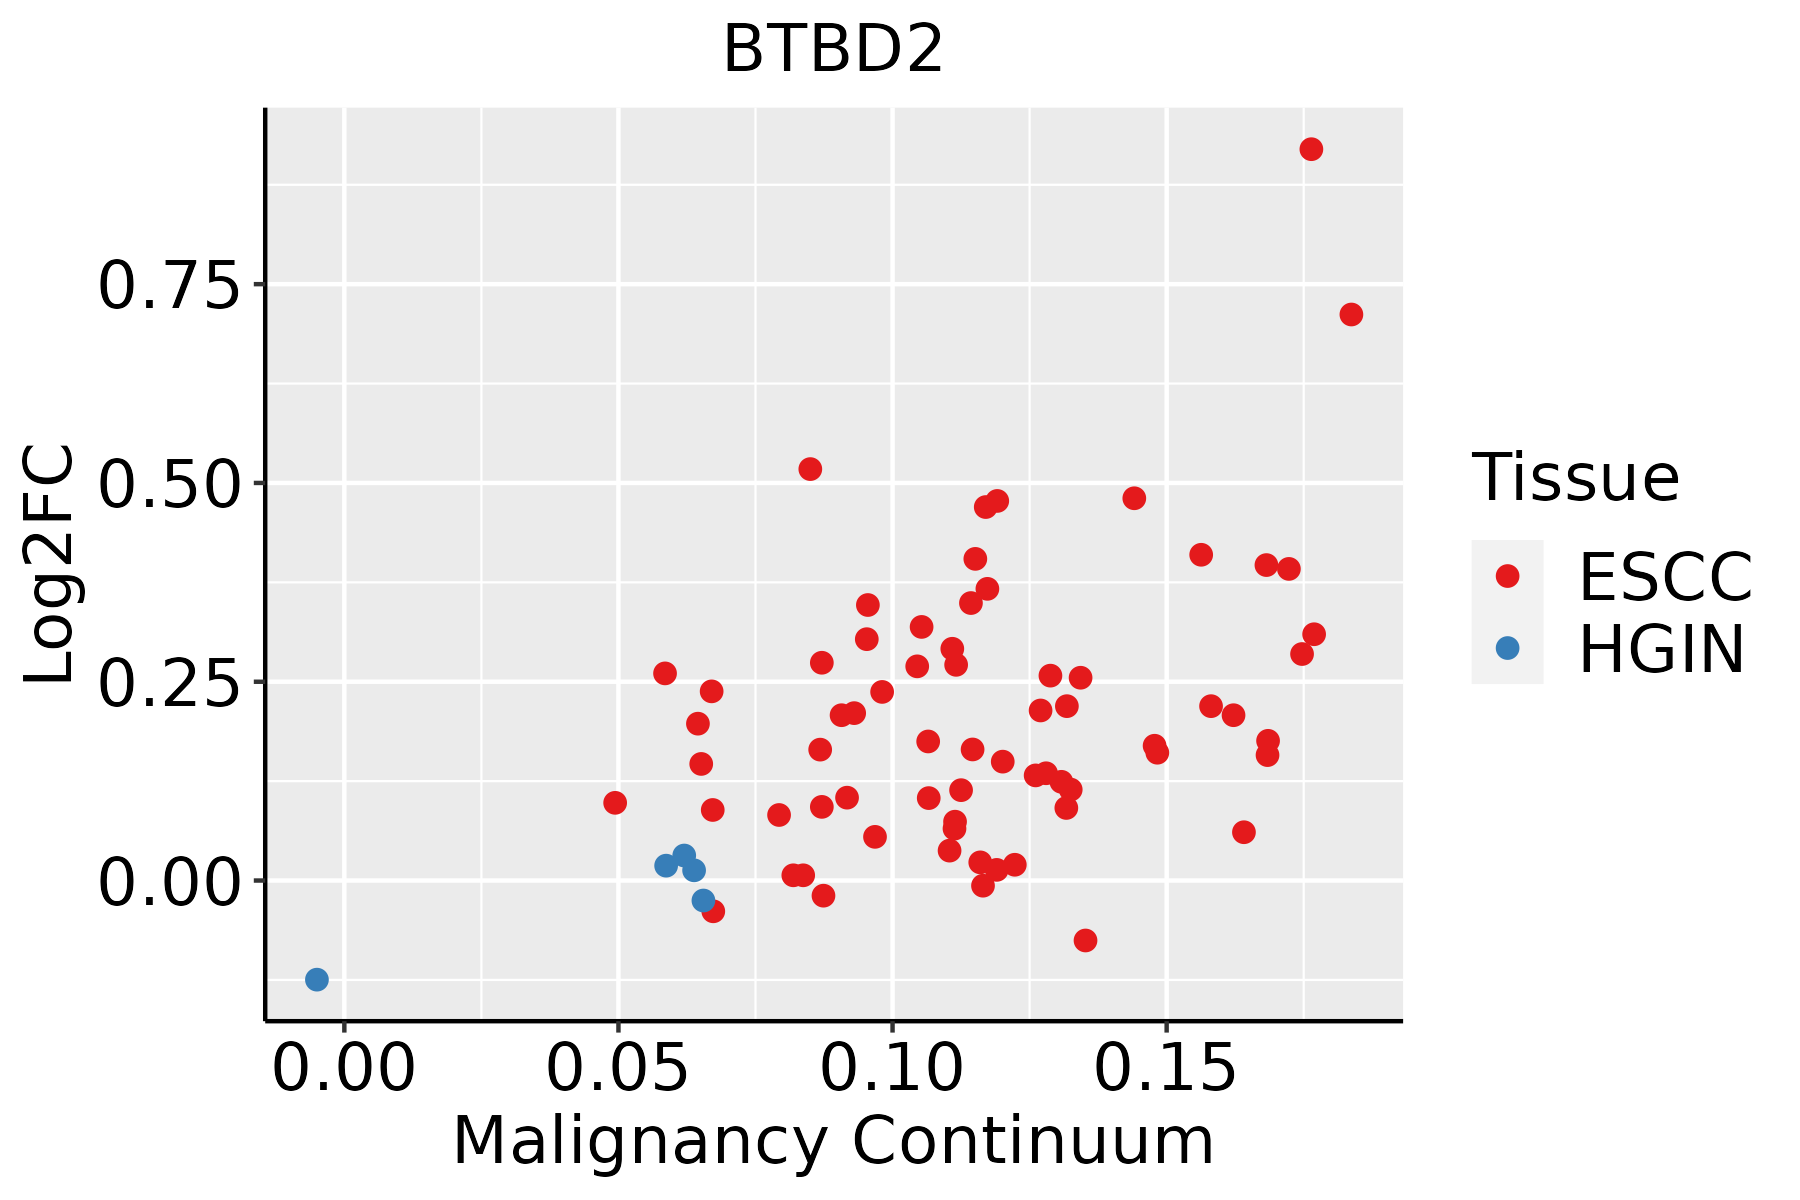 | ESCC: Esophageal squamous cell carcinoma |
| HGIN: High-grade intraepithelial neoplasias | ||
| LGIN: Low-grade intraepithelial neoplasias | ||
| Liver | 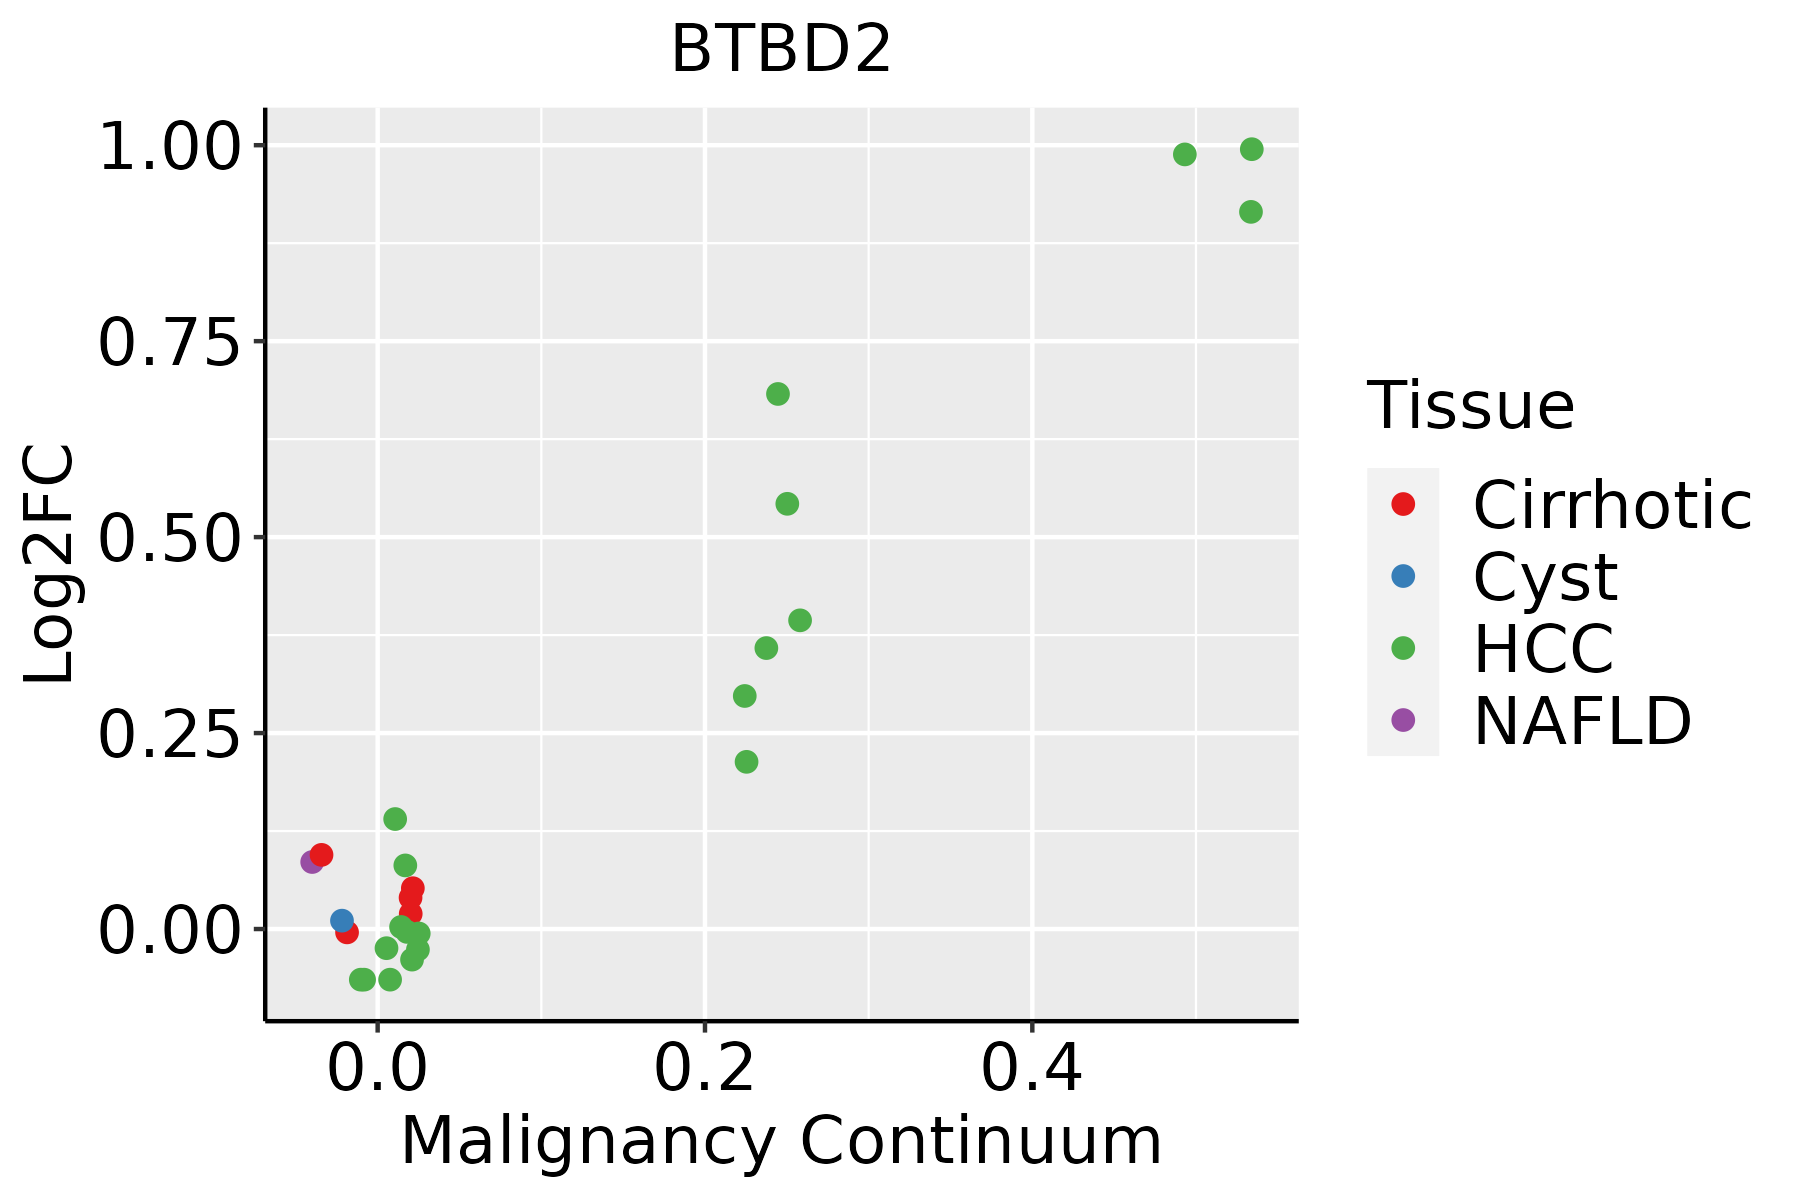 | HCC: Hepatocellular carcinoma |
| NAFLD: Non-alcoholic fatty liver disease | ||
| Oral Cavity |  | EOLP: Erosive Oral lichen planus |
| LP: leukoplakia | ||
| NEOLP: Non-erosive oral lichen planus | ||
| OSCC: Oral squamous cell carcinoma | ||
| Thyroid | 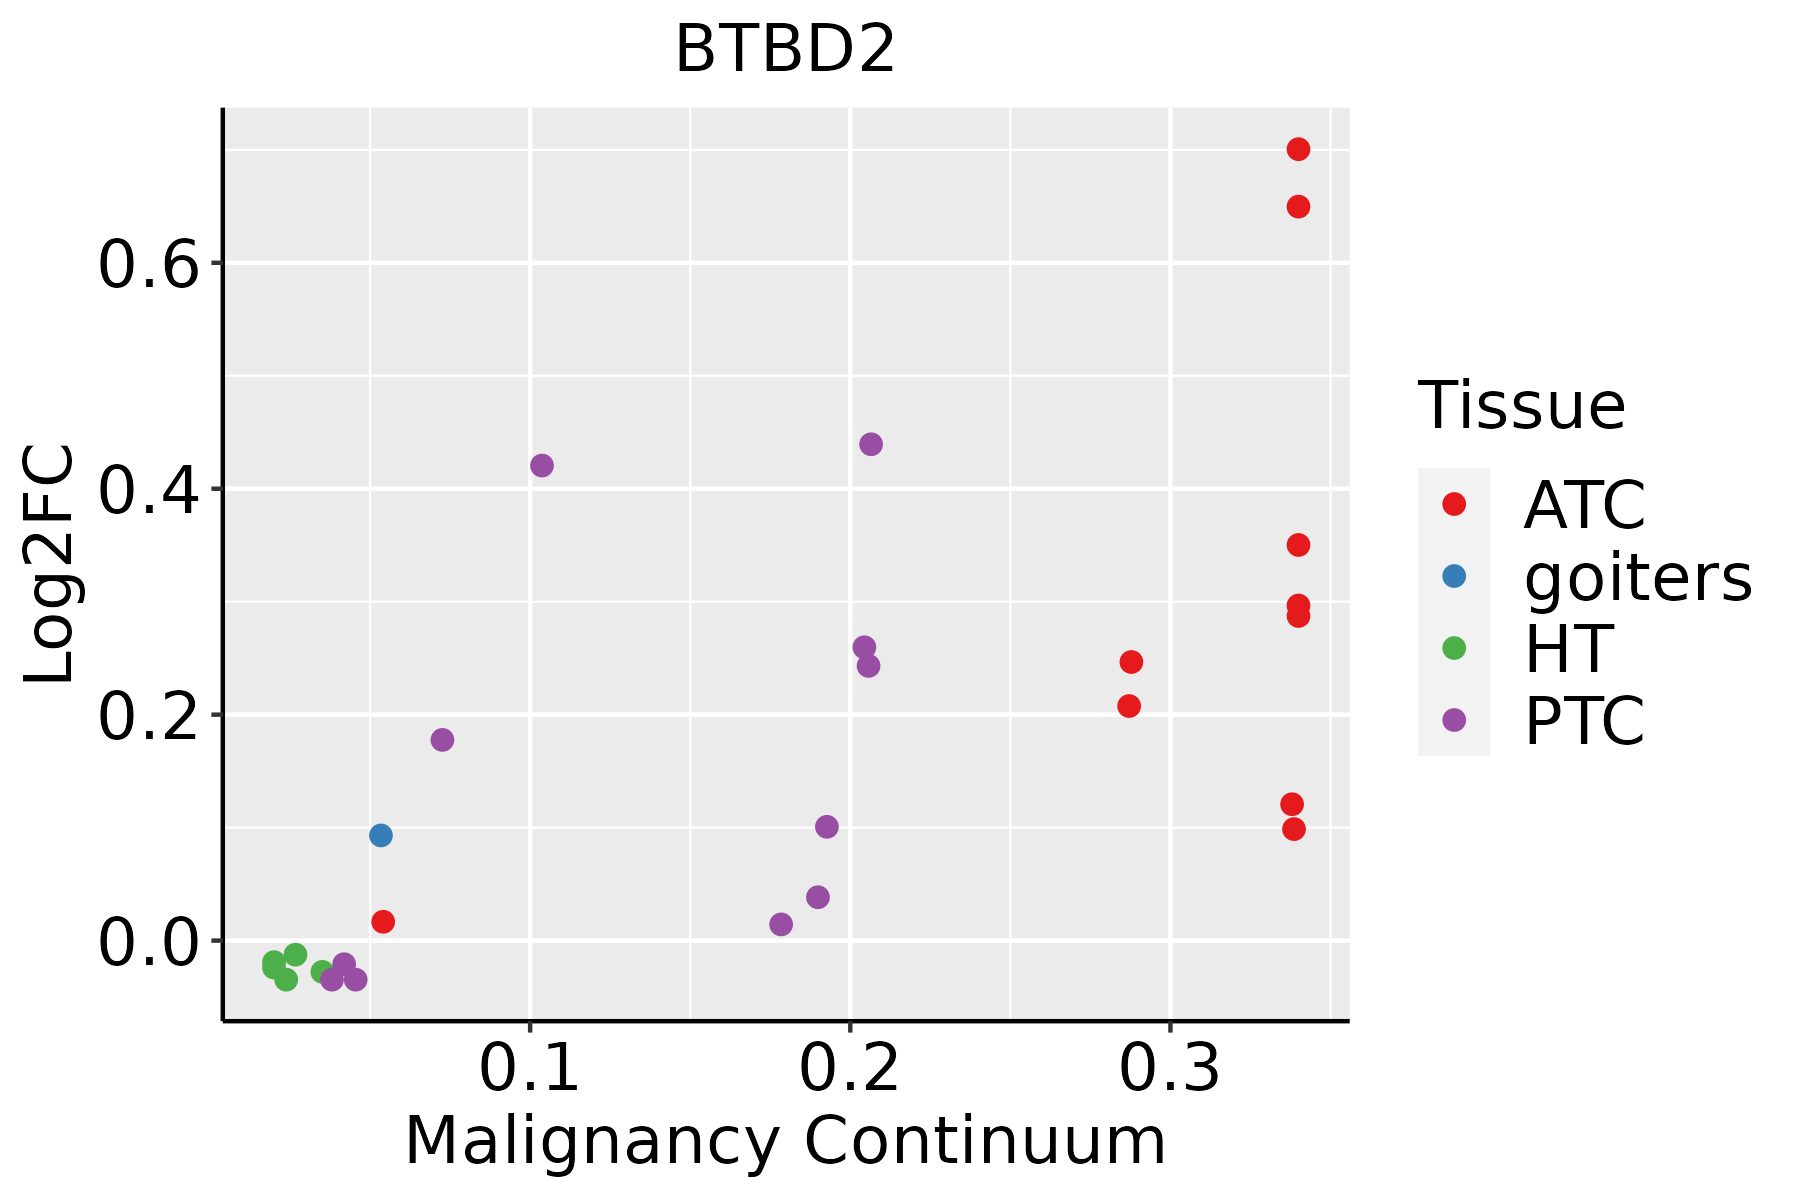 | ATC: Anaplastic thyroid cancer |
| HT: Hashimoto's thyroiditis | ||
| PTC: Papillary thyroid cancer |
| ∗log2FC in expression of this searched gene in stem-like cells from each diseased tissue sample relative to stem-like cells in normal samples in each tissue plotted against the malignancy continuum. Samples are colored based on if they are from different disease stage. |
Top |
Malignant transformation related pathway analysis |
| Find out the enriched GO biological processes and KEGG pathways involved in transition from healthy to precancer to cancer |
| Tissue | Disease Stage | Enriched GO biological Processes |
| Esophagus | ESCC |  |
| Skin | AK |  |
| Skin | SCCIS |  |
| Skin | cSCC |  |
| Thyroid | HT |  |
| ∗Top 15 enriched GO BP terms are showed in the bar plot of each disease state in each tissue. Each row represents a significant GO biological process which is colored according to the -log10(p.adjust). |
| Page: 1 2 3 4 5 6 7 8 9 |
| GO ID | Tissue | Disease Stage | Description | Gene Ratio | Bg Ratio | pvalue | p.adjust | Count |
| GO:004343420 | Esophagus | HGIN | response to peptide hormone | 79/2587 | 414/18723 | 1.60e-03 | 1.79e-02 | 79 |
| GO:00059969 | Esophagus | ESCC | monosaccharide metabolic process | 159/8552 | 257/18723 | 1.11e-07 | 1.81e-06 | 159 |
| GO:00193189 | Esophagus | ESCC | hexose metabolic process | 147/8552 | 237/18723 | 2.63e-07 | 3.94e-06 | 147 |
| GO:0043434111 | Esophagus | ESCC | response to peptide hormone | 234/8552 | 414/18723 | 4.93e-06 | 5.21e-05 | 234 |
| GO:003286818 | Esophagus | ESCC | response to insulin | 156/8552 | 264/18723 | 7.21e-06 | 7.20e-05 | 156 |
| GO:00060069 | Esophagus | ESCC | glucose metabolic process | 119/8552 | 196/18723 | 1.51e-05 | 1.36e-04 | 119 |
| GO:003286821 | Liver | HCC | response to insulin | 172/7958 | 264/18723 | 7.14e-14 | 4.23e-12 | 172 |
| GO:000599621 | Liver | HCC | monosaccharide metabolic process | 167/7958 | 257/18723 | 2.31e-13 | 1.25e-11 | 167 |
| GO:001931821 | Liver | HCC | hexose metabolic process | 155/7958 | 237/18723 | 7.63e-13 | 3.90e-11 | 155 |
| GO:004343422 | Liver | HCC | response to peptide hormone | 247/7958 | 414/18723 | 9.55e-13 | 4.77e-11 | 247 |
| GO:000600621 | Liver | HCC | glucose metabolic process | 128/7958 | 196/18723 | 8.60e-11 | 3.06e-09 | 128 |
| GO:004343419 | Oral cavity | OSCC | response to peptide hormone | 208/7305 | 414/18723 | 1.83e-06 | 2.35e-05 | 208 |
| GO:003286816 | Oral cavity | OSCC | response to insulin | 138/7305 | 264/18723 | 7.54e-06 | 8.15e-05 | 138 |
| GO:00059968 | Oral cavity | OSCC | monosaccharide metabolic process | 129/7305 | 257/18723 | 1.63e-04 | 1.13e-03 | 129 |
| GO:00193188 | Oral cavity | OSCC | hexose metabolic process | 118/7305 | 237/18723 | 4.53e-04 | 2.73e-03 | 118 |
| GO:00060068 | Oral cavity | OSCC | glucose metabolic process | 98/7305 | 196/18723 | 1.10e-03 | 5.63e-03 | 98 |
| GO:0043434110 | Oral cavity | LP | response to peptide hormone | 138/4623 | 414/18723 | 4.00e-05 | 5.87e-04 | 138 |
| GO:000599613 | Oral cavity | LP | monosaccharide metabolic process | 86/4623 | 257/18723 | 9.13e-04 | 7.79e-03 | 86 |
| GO:003286817 | Oral cavity | LP | response to insulin | 88/4623 | 264/18723 | 9.19e-04 | 7.82e-03 | 88 |
| GO:001931813 | Oral cavity | LP | hexose metabolic process | 78/4623 | 237/18723 | 2.55e-03 | 1.80e-02 | 78 |
| Page: 1 2 |
| Pathway ID | Tissue | Disease Stage | Description | Gene Ratio | Bg Ratio | pvalue | p.adjust | qvalue | Count |
| Page: 1 |
Top |
Cell-cell communication analysis |
| Identification of potential cell-cell interactions between two cell types and their ligand-receptor pairs for different disease states |
| Ligand | Receptor | LRpair | Pathway | Tissue | Disease Stage |
| Page: 1 |
Top |
Single-cell gene regulatory network inference analysis |
| Find out the significant the regulons (TFs) and the target genes of each regulon across cell types for different disease states |
| TF | Cell Type | Tissue | Disease Stage | Target Gene | RSS | Regulon Activity |
| ∗The dot plots of a searched regulon are shown for all cell subpopulations in each disease state of each tissue based on the regulon specific score inferred using pySCENIC and by calculating the average expression. |
| Page: 1 |
Top |
Somatic mutation of malignant transformation related genes |
| Annotation of somatic variants for genes involved in malignant transformation |
| Hugo Symbol | Variant Class | Variant Classification | dbSNP RS | HGVSc | HGVSp | HGVSp Short | SWISSPROT | BIOTYPE | SIFT | PolyPhen | Tumor Sample Barcode | Tissue | Histology | Sex | Age | Stage | Therapy Types | Drugs | Outcome |
| BTBD2 | SNV | Missense_Mutation | novel | c.833N>A | p.Arg278His | p.R278H | Q9BX70 | protein_coding | deleterious(0) | probably_damaging(0.993) | TCGA-AC-A4ZE-01 | Breast | breast invasive carcinoma | Female | <65 | I/II | Unknown | Unknown | SD |
| BTBD2 | SNV | Missense_Mutation | c.689N>A | p.Arg230Gln | p.R230Q | Q9BX70 | protein_coding | deleterious(0.05) | probably_damaging(0.994) | TCGA-D8-A1XK-01 | Breast | breast invasive carcinoma | Female | <65 | I/II | Chemotherapy | doxorubicine+cyclophosphamide | SD | |
| BTBD2 | SNV | Missense_Mutation | rs746291159 | c.1183T>G | p.Phe395Val | p.F395V | Q9BX70 | protein_coding | deleterious(0.01) | possibly_damaging(0.855) | TCGA-EW-A1J2-01 | Breast | breast invasive carcinoma | Female | <65 | I/II | Chemotherapy | taxotere | SD |
| BTBD2 | insertion | Nonsense_Mutation | novel | c.488_489insTTCACTGTGTTAGTCAGGATG | p.Leu163_Pro164insSerLeuCysTerSerGlyTrp | p.L163_P164insSLC*SGW | Q9BX70 | protein_coding | TCGA-A8-A092-01 | Breast | breast invasive carcinoma | Female | <65 | III/IV | Chemotherapy | paclitaxel | CR | ||
| BTBD2 | deletion | Frame_Shift_Del | novel | c.1552delN | p.Ile518SerfsTer22 | p.I518Sfs*22 | Q9BX70 | protein_coding | TCGA-EW-A2FV-01 | Breast | breast invasive carcinoma | Female | <65 | III/IV | Chemotherapy | docetaxel | SD | ||
| BTBD2 | SNV | Missense_Mutation | novel | c.824N>C | p.Leu275Pro | p.L275P | Q9BX70 | protein_coding | deleterious(0) | probably_damaging(1) | TCGA-A6-6780-01 | Colorectum | colon adenocarcinoma | Male | >=65 | I/II | Unknown | Unknown | SD |
| BTBD2 | SNV | Missense_Mutation | c.686N>T | p.Ala229Val | p.A229V | Q9BX70 | protein_coding | deleterious(0) | probably_damaging(0.998) | TCGA-CK-4951-01 | Colorectum | colon adenocarcinoma | Female | >=65 | I/II | Unknown | Unknown | PD | |
| BTBD2 | SNV | Missense_Mutation | rs141098024 | c.412N>A | p.Val138Met | p.V138M | Q9BX70 | protein_coding | deleterious(0) | probably_damaging(0.972) | TCGA-DM-A1HB-01 | Colorectum | colon adenocarcinoma | Male | >=65 | III/IV | Unknown | Unknown | SD |
| BTBD2 | SNV | Missense_Mutation | c.1127N>A | p.Arg376His | p.R376H | Q9BX70 | protein_coding | deleterious(0) | probably_damaging(1) | TCGA-G4-6317-01 | Colorectum | colon adenocarcinoma | Female | <65 | III/IV | Chemotherapy | fluorouracil | PD | |
| BTBD2 | SNV | Missense_Mutation | c.1044N>A | p.His348Gln | p.H348Q | Q9BX70 | protein_coding | deleterious(0.01) | possibly_damaging(0.899) | TCGA-G4-6628-01 | Colorectum | colon adenocarcinoma | Male | >=65 | I/II | Unknown | Unknown | SD |
| Page: 1 2 3 4 5 6 |
Top |
Related drugs of malignant transformation related genes |
| Identification of chemicals and drugs interact with genes involved in malignant transfromation |
| (DGIdb 4.0) |
| Entrez ID | Symbol | Category | Interaction Types | Drug Claim Name | Drug Name | PMIDs |
| Page: 1 |

Copyright 2023-Present -The University of Texas Health Science Center at Houston |