
|
|||||
|
 | |
| |
| |
| |
| |
| |
|
Gene: BABAM2 |
Gene summary for BABAM2 |
| Gene information | Species | Human | Gene symbol | BABAM2 | Gene ID | 9577 |
| Gene name | BRISC and BRCA1 A complex member 2 | |
| Gene Alias | BRCC4 | |
| Cytomap | 2p23.2 | |
| Gene Type | protein-coding | GO ID | GO:0000075 | UniProtAcc | Q9NXR7 |
Top |
Malignant transformation analysis |
| Identification of the aberrant gene expression in precancerous and cancerous lesions by comparing the gene expression of stem-like cells in diseased tissues with normal stem cells |
| Entrez ID | Symbol | Replicates | Species | Organ | Tissue | Adj P-value | Log2FC | Malignancy |
| 9577 | BABAM2 | HTA11_3410_2000001011 | Human | Colorectum | AD | 1.16e-06 | -4.00e-01 | 0.0155 |
| 9577 | BABAM2 | HTA11_8622_2000001021 | Human | Colorectum | SER | 1.36e-04 | -6.20e-01 | 0.0528 |
| 9577 | BABAM2 | HTA11_99999970781_79442 | Human | Colorectum | MSS | 4.47e-59 | -9.66e-01 | 0.294 |
| 9577 | BABAM2 | HTA11_99999965104_69814 | Human | Colorectum | MSS | 3.59e-22 | -9.66e-01 | 0.281 |
| 9577 | BABAM2 | HTA11_99999971662_82457 | Human | Colorectum | MSS | 1.36e-60 | -9.66e-01 | 0.3859 |
| 9577 | BABAM2 | HTA11_99999973899_84307 | Human | Colorectum | MSS | 2.20e-17 | -9.66e-01 | 0.2585 |
| 9577 | BABAM2 | HTA11_99999974143_84620 | Human | Colorectum | MSS | 1.40e-59 | -9.66e-01 | 0.3005 |
| 9577 | BABAM2 | A001-C-207 | Human | Colorectum | FAP | 9.15e-04 | -2.84e-01 | 0.1278 |
| 9577 | BABAM2 | A015-C-203 | Human | Colorectum | FAP | 2.01e-34 | -5.28e-01 | -0.1294 |
| 9577 | BABAM2 | A015-C-204 | Human | Colorectum | FAP | 5.35e-06 | -3.78e-01 | -0.0228 |
| 9577 | BABAM2 | A014-C-040 | Human | Colorectum | FAP | 3.45e-04 | -3.83e-01 | -0.1184 |
| 9577 | BABAM2 | A002-C-201 | Human | Colorectum | FAP | 1.83e-14 | -4.00e-01 | 0.0324 |
| 9577 | BABAM2 | A002-C-203 | Human | Colorectum | FAP | 6.51e-03 | -9.00e-02 | 0.2786 |
| 9577 | BABAM2 | A001-C-119 | Human | Colorectum | FAP | 1.32e-09 | -5.75e-01 | -0.1557 |
| 9577 | BABAM2 | A001-C-108 | Human | Colorectum | FAP | 1.92e-16 | -3.78e-01 | -0.0272 |
| 9577 | BABAM2 | A002-C-205 | Human | Colorectum | FAP | 2.49e-26 | -5.54e-01 | -0.1236 |
| 9577 | BABAM2 | A001-C-104 | Human | Colorectum | FAP | 1.89e-05 | -2.87e-01 | 0.0184 |
| 9577 | BABAM2 | A015-C-005 | Human | Colorectum | FAP | 7.23e-03 | -2.46e-01 | -0.0336 |
| 9577 | BABAM2 | A015-C-006 | Human | Colorectum | FAP | 3.60e-19 | -5.62e-01 | -0.0994 |
| 9577 | BABAM2 | A015-C-106 | Human | Colorectum | FAP | 4.69e-12 | -2.41e-01 | -0.0511 |
| Page: 1 2 3 4 5 6 |
| Tissue | Expression Dynamics | Abbreviation |
| Colorectum (GSE201348) |  | FAP: Familial adenomatous polyposis |
| CRC: Colorectal cancer | ||
| Colorectum (HTA11) |  | AD: Adenomas |
| SER: Sessile serrated lesions | ||
| MSI-H: Microsatellite-high colorectal cancer | ||
| MSS: Microsatellite stable colorectal cancer | ||
| Endometrium |  | AEH: Atypical endometrial hyperplasia |
| EEC: Endometrioid Cancer | ||
| Liver | 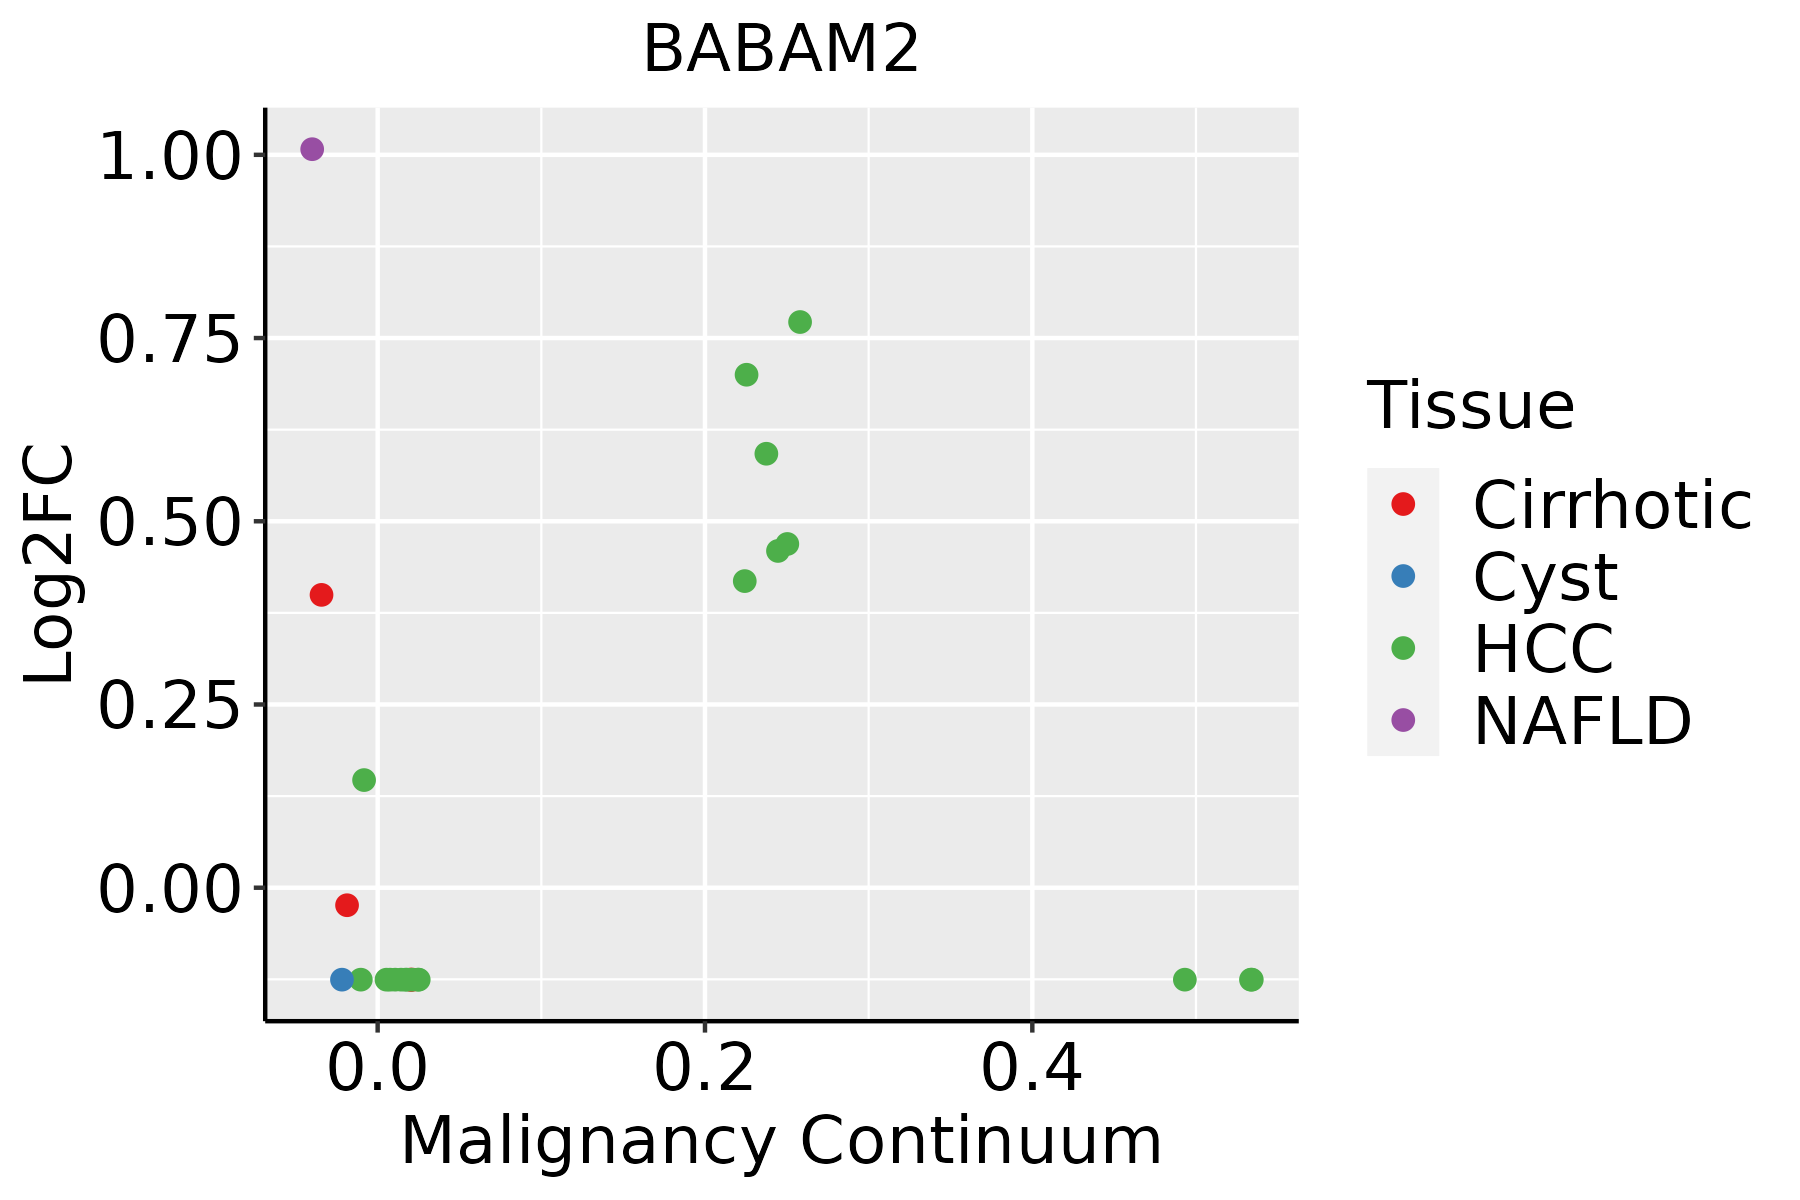 | HCC: Hepatocellular carcinoma |
| NAFLD: Non-alcoholic fatty liver disease | ||
| Lung | 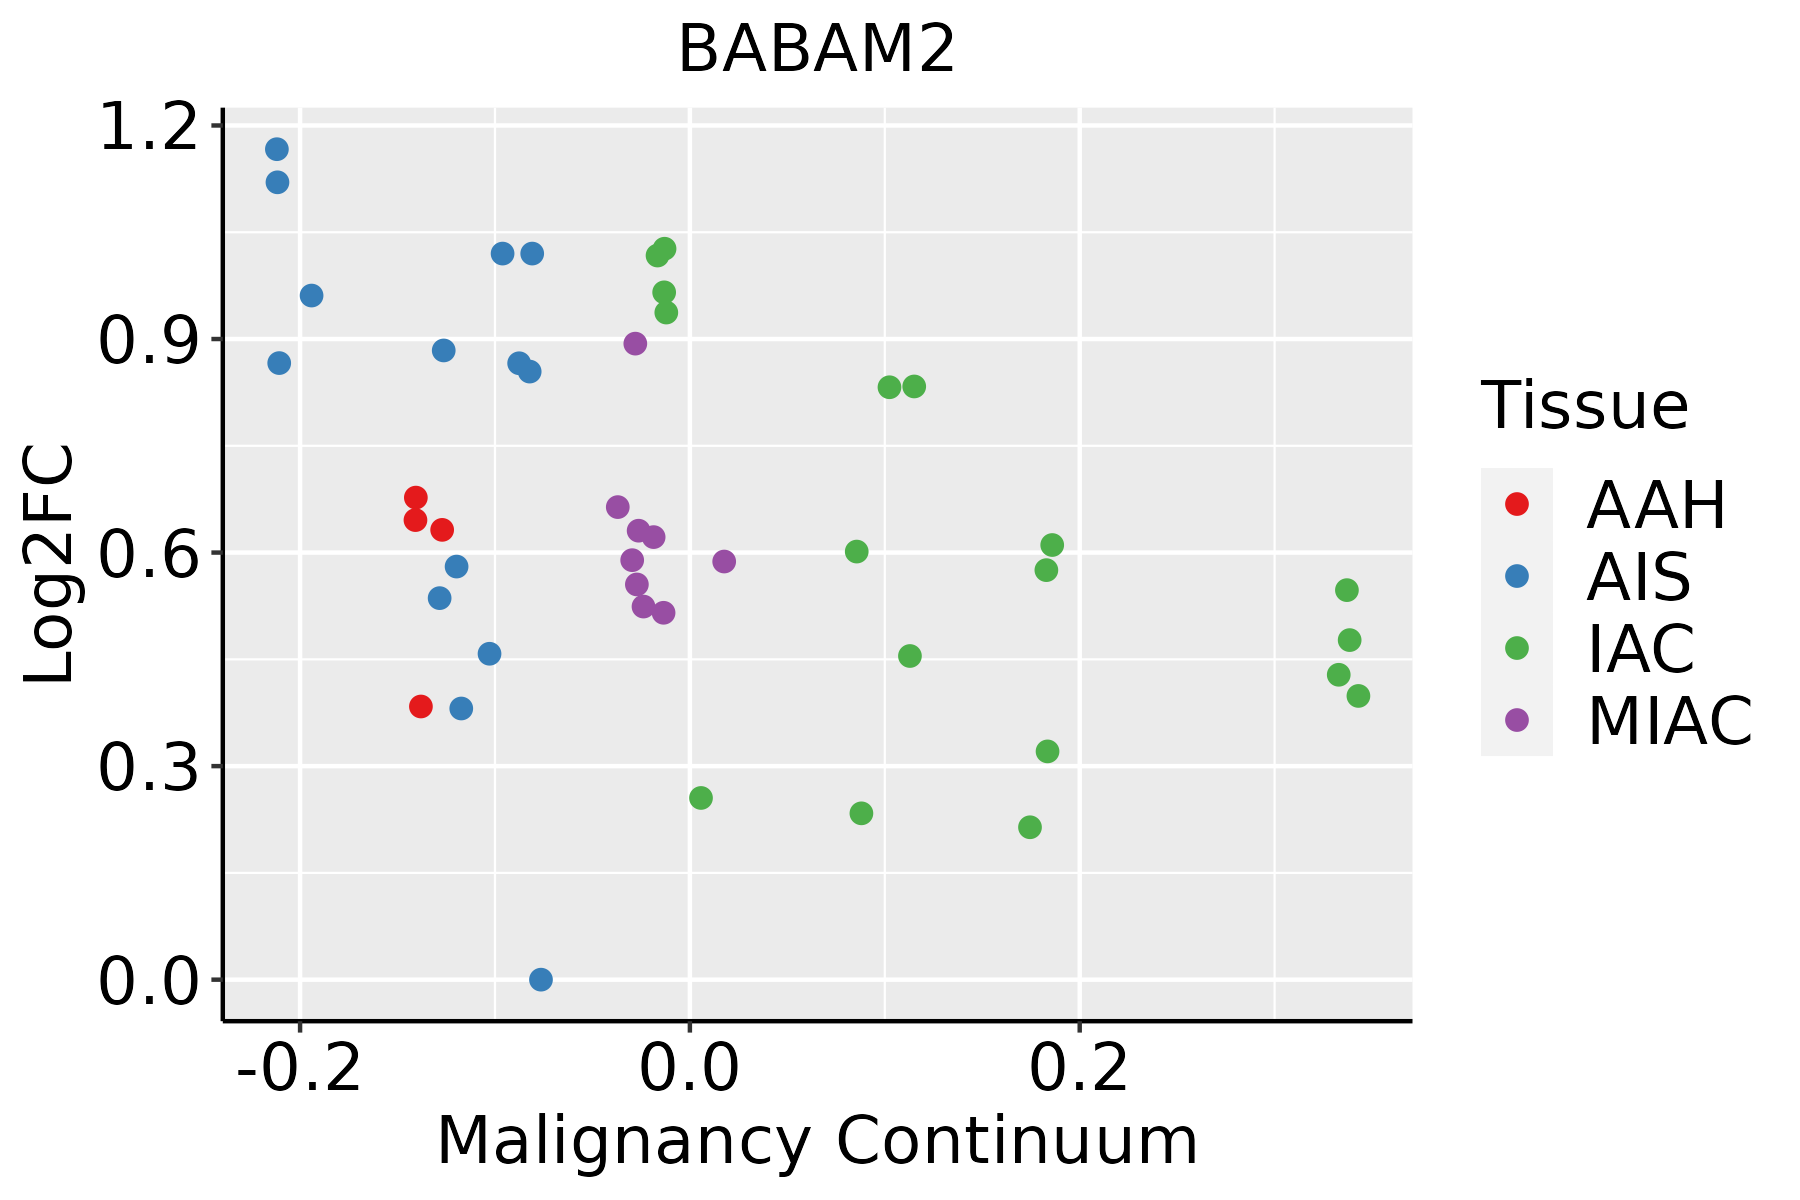 | AAH: Atypical adenomatous hyperplasia |
| AIS: Adenocarcinoma in situ | ||
| IAC: Invasive lung adenocarcinoma | ||
| MIA: Minimally invasive adenocarcinoma | ||
| Thyroid | 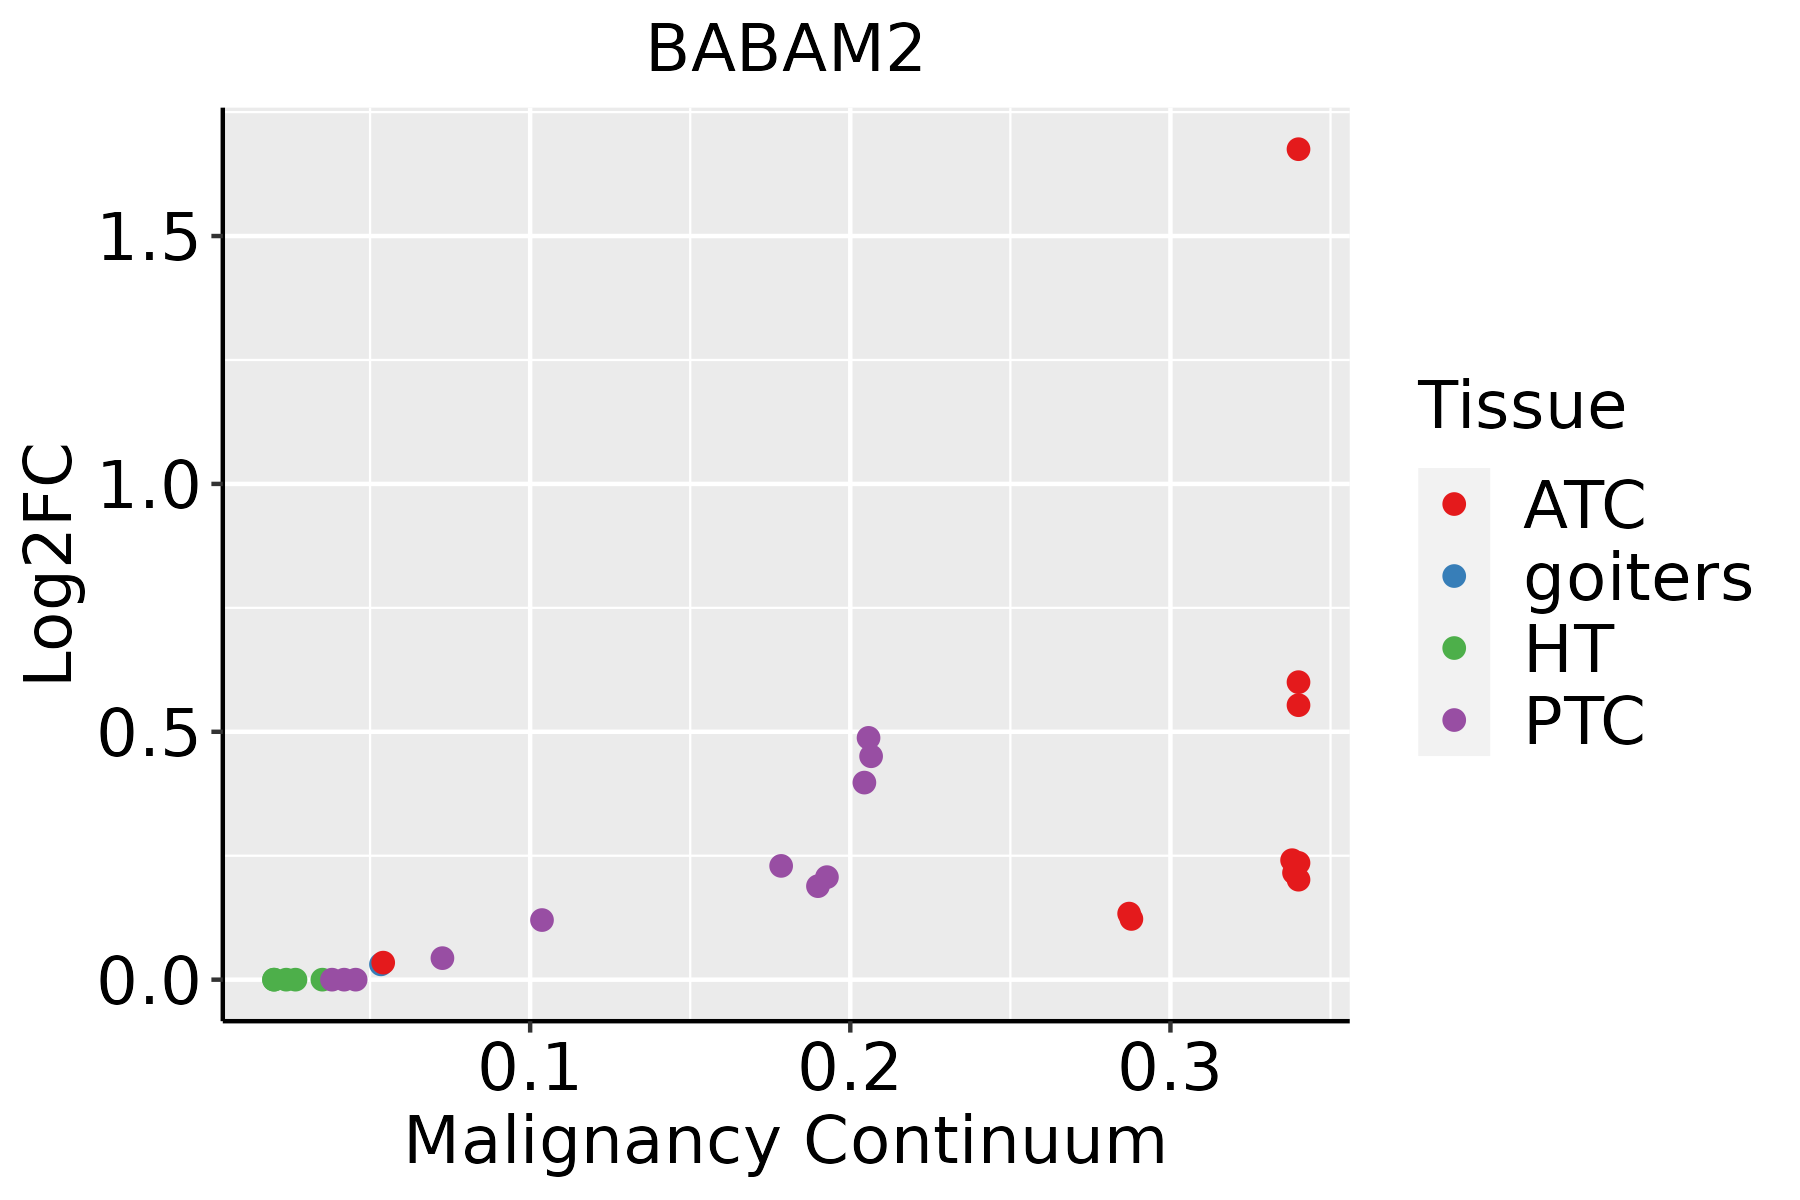 | ATC: Anaplastic thyroid cancer |
| HT: Hashimoto's thyroiditis | ||
| PTC: Papillary thyroid cancer |
| ∗log2FC in expression of this searched gene in stem-like cells from each diseased tissue sample relative to stem-like cells in normal samples in each tissue plotted against the malignancy continuum. Samples are colored based on if they are from different disease stage. |
Top |
Malignant transformation related pathway analysis |
| Find out the enriched GO biological processes and KEGG pathways involved in transition from healthy to precancer to cancer |
| Tissue | Disease Stage | Enriched GO biological Processes |
| Esophagus | ESCC |  |
| Skin | AK |  |
| Skin | SCCIS |  |
| Skin | cSCC |  |
| Thyroid | HT |  |
| ∗Top 15 enriched GO BP terms are showed in the bar plot of each disease state in each tissue. Each row represents a significant GO biological process which is colored according to the -log10(p.adjust). |
| Page: 1 2 3 4 5 6 7 8 9 |
| GO ID | Tissue | Disease Stage | Description | Gene Ratio | Bg Ratio | pvalue | p.adjust | Count |
| GO:0051052 | Colorectum | AD | regulation of DNA metabolic process | 116/3918 | 359/18723 | 2.47e-07 | 1.00e-05 | 116 |
| GO:0051054 | Colorectum | AD | positive regulation of DNA metabolic process | 73/3918 | 201/18723 | 3.27e-07 | 1.29e-05 | 73 |
| GO:2001020 | Colorectum | AD | regulation of response to DNA damage stimulus | 71/3918 | 219/18723 | 4.38e-05 | 7.65e-04 | 71 |
| GO:0006325 | Colorectum | AD | chromatin organization | 119/3918 | 409/18723 | 4.85e-05 | 8.33e-04 | 119 |
| GO:2001022 | Colorectum | AD | positive regulation of response to DNA damage stimulus | 36/3918 | 105/18723 | 1.02e-03 | 9.47e-03 | 36 |
| GO:0006282 | Colorectum | AD | regulation of DNA repair | 42/3918 | 130/18723 | 1.57e-03 | 1.32e-02 | 42 |
| GO:0007346 | Colorectum | AD | regulation of mitotic cell cycle | 119/3918 | 457/18723 | 4.60e-03 | 3.14e-02 | 119 |
| GO:00510541 | Colorectum | SER | positive regulation of DNA metabolic process | 53/2897 | 201/18723 | 4.51e-05 | 1.13e-03 | 53 |
| GO:00510521 | Colorectum | SER | regulation of DNA metabolic process | 83/2897 | 359/18723 | 8.03e-05 | 1.77e-03 | 83 |
| GO:00063251 | Colorectum | SER | chromatin organization | 89/2897 | 409/18723 | 4.15e-04 | 6.17e-03 | 89 |
| GO:20010201 | Colorectum | SER | regulation of response to DNA damage stimulus | 49/2897 | 219/18723 | 4.24e-03 | 3.45e-02 | 49 |
| GO:00510522 | Colorectum | MSS | regulation of DNA metabolic process | 108/3467 | 359/18723 | 5.86e-08 | 3.10e-06 | 108 |
| GO:00510542 | Colorectum | MSS | positive regulation of DNA metabolic process | 69/3467 | 201/18723 | 6.33e-08 | 3.26e-06 | 69 |
| GO:20010202 | Colorectum | MSS | regulation of response to DNA damage stimulus | 64/3467 | 219/18723 | 7.20e-05 | 1.21e-03 | 64 |
| GO:00063252 | Colorectum | MSS | chromatin organization | 107/3467 | 409/18723 | 7.22e-05 | 1.21e-03 | 107 |
| GO:20010221 | Colorectum | MSS | positive regulation of response to DNA damage stimulus | 33/3467 | 105/18723 | 9.83e-04 | 9.86e-03 | 33 |
| GO:00062821 | Colorectum | MSS | regulation of DNA repair | 38/3467 | 130/18723 | 1.93e-03 | 1.67e-02 | 38 |
| GO:00073461 | Colorectum | MSS | regulation of mitotic cell cycle | 108/3467 | 457/18723 | 3.30e-03 | 2.50e-02 | 108 |
| GO:0006302 | Colorectum | MSS | double-strand break repair | 64/3467 | 251/18723 | 3.58e-03 | 2.65e-02 | 64 |
| GO:0045739 | Colorectum | MSS | positive regulation of DNA repair | 23/3467 | 73/18723 | 5.22e-03 | 3.57e-02 | 23 |
| Page: 1 2 3 4 5 6 7 8 9 10 11 |
| Pathway ID | Tissue | Disease Stage | Description | Gene Ratio | Bg Ratio | pvalue | p.adjust | qvalue | Count |
| Page: 1 |
Top |
Cell-cell communication analysis |
| Identification of potential cell-cell interactions between two cell types and their ligand-receptor pairs for different disease states |
| Ligand | Receptor | LRpair | Pathway | Tissue | Disease Stage |
| Page: 1 |
Top |
Single-cell gene regulatory network inference analysis |
| Find out the significant the regulons (TFs) and the target genes of each regulon across cell types for different disease states |
| TF | Cell Type | Tissue | Disease Stage | Target Gene | RSS | Regulon Activity |
| ∗The dot plots of a searched regulon are shown for all cell subpopulations in each disease state of each tissue based on the regulon specific score inferred using pySCENIC and by calculating the average expression. |
| Page: 1 |
Top |
Somatic mutation of malignant transformation related genes |
| Annotation of somatic variants for genes involved in malignant transformation |
| Hugo Symbol | Variant Class | Variant Classification | dbSNP RS | HGVSc | HGVSp | HGVSp Short | SWISSPROT | BIOTYPE | SIFT | PolyPhen | Tumor Sample Barcode | Tissue | Histology | Sex | Age | Stage | Therapy Types | Drugs | Outcome |
| Page: 1 |
Top |
Related drugs of malignant transformation related genes |
| Identification of chemicals and drugs interact with genes involved in malignant transfromation |
| (DGIdb 4.0) |
| Entrez ID | Symbol | Category | Interaction Types | Drug Claim Name | Drug Name | PMIDs |
| Page: 1 |

Copyright 2023-Present -The University of Texas Health Science Center at Houston |