
|
|||||
|
 | |
| |
| |
| |
| |
| |
|
Gene: ATP6V1G1 |
Gene summary for ATP6V1G1 |
| Gene information | Species | Human | Gene symbol | ATP6V1G1 | Gene ID | 9550 |
| Gene name | ATPase H+ transporting V1 subunit G1 | |
| Gene Alias | ATP6G | |
| Cytomap | 9q32 | |
| Gene Type | protein-coding | GO ID | GO:0006810 | UniProtAcc | A0A024R883 |
Top |
Malignant transformation analysis |
| Identification of the aberrant gene expression in precancerous and cancerous lesions by comparing the gene expression of stem-like cells in diseased tissues with normal stem cells |
| Entrez ID | Symbol | Replicates | Species | Organ | Tissue | Adj P-value | Log2FC | Malignancy |
| 9550 | ATP6V1G1 | GSM4909282 | Human | Breast | IDC | 1.42e-03 | -2.39e-01 | -0.0288 |
| 9550 | ATP6V1G1 | GSM4909285 | Human | Breast | IDC | 8.73e-05 | 2.62e-01 | 0.21 |
| 9550 | ATP6V1G1 | GSM4909286 | Human | Breast | IDC | 6.84e-08 | -1.47e-01 | 0.1081 |
| 9550 | ATP6V1G1 | GSM4909287 | Human | Breast | IDC | 2.42e-05 | -3.33e-01 | 0.2057 |
| 9550 | ATP6V1G1 | GSM4909288 | Human | Breast | IDC | 6.33e-03 | -2.60e-01 | 0.0988 |
| 9550 | ATP6V1G1 | GSM4909289 | Human | Breast | IDC | 2.67e-05 | 3.96e-01 | 0.1064 |
| 9550 | ATP6V1G1 | GSM4909290 | Human | Breast | IDC | 4.12e-07 | 2.69e-01 | 0.2096 |
| 9550 | ATP6V1G1 | GSM4909293 | Human | Breast | IDC | 7.34e-05 | -1.17e-01 | 0.1581 |
| 9550 | ATP6V1G1 | GSM4909294 | Human | Breast | IDC | 1.42e-34 | 9.67e-02 | 0.2022 |
| 9550 | ATP6V1G1 | GSM4909296 | Human | Breast | IDC | 5.32e-16 | -2.07e-01 | 0.1524 |
| 9550 | ATP6V1G1 | GSM4909297 | Human | Breast | IDC | 1.37e-37 | -3.24e-01 | 0.1517 |
| 9550 | ATP6V1G1 | GSM4909301 | Human | Breast | IDC | 3.22e-06 | 1.04e-01 | 0.1577 |
| 9550 | ATP6V1G1 | GSM4909302 | Human | Breast | IDC | 4.74e-05 | -2.50e-01 | 0.1545 |
| 9550 | ATP6V1G1 | GSM4909309 | Human | Breast | IDC | 3.06e-09 | -1.30e-02 | 0.0483 |
| 9550 | ATP6V1G1 | GSM4909311 | Human | Breast | IDC | 2.23e-67 | -6.54e-01 | 0.1534 |
| 9550 | ATP6V1G1 | GSM4909312 | Human | Breast | IDC | 9.64e-18 | 7.76e-02 | 0.1552 |
| 9550 | ATP6V1G1 | GSM4909313 | Human | Breast | IDC | 1.10e-05 | -1.17e-02 | 0.0391 |
| 9550 | ATP6V1G1 | GSM4909315 | Human | Breast | IDC | 5.67e-40 | 3.54e-01 | 0.21 |
| 9550 | ATP6V1G1 | GSM4909316 | Human | Breast | IDC | 7.89e-15 | 2.53e-01 | 0.21 |
| 9550 | ATP6V1G1 | GSM4909318 | Human | Breast | IDC | 1.76e-10 | 2.94e-01 | 0.2031 |
| Page: 1 2 3 4 5 6 7 8 9 10 11 12 13 |
| Tissue | Expression Dynamics | Abbreviation |
| Breast | 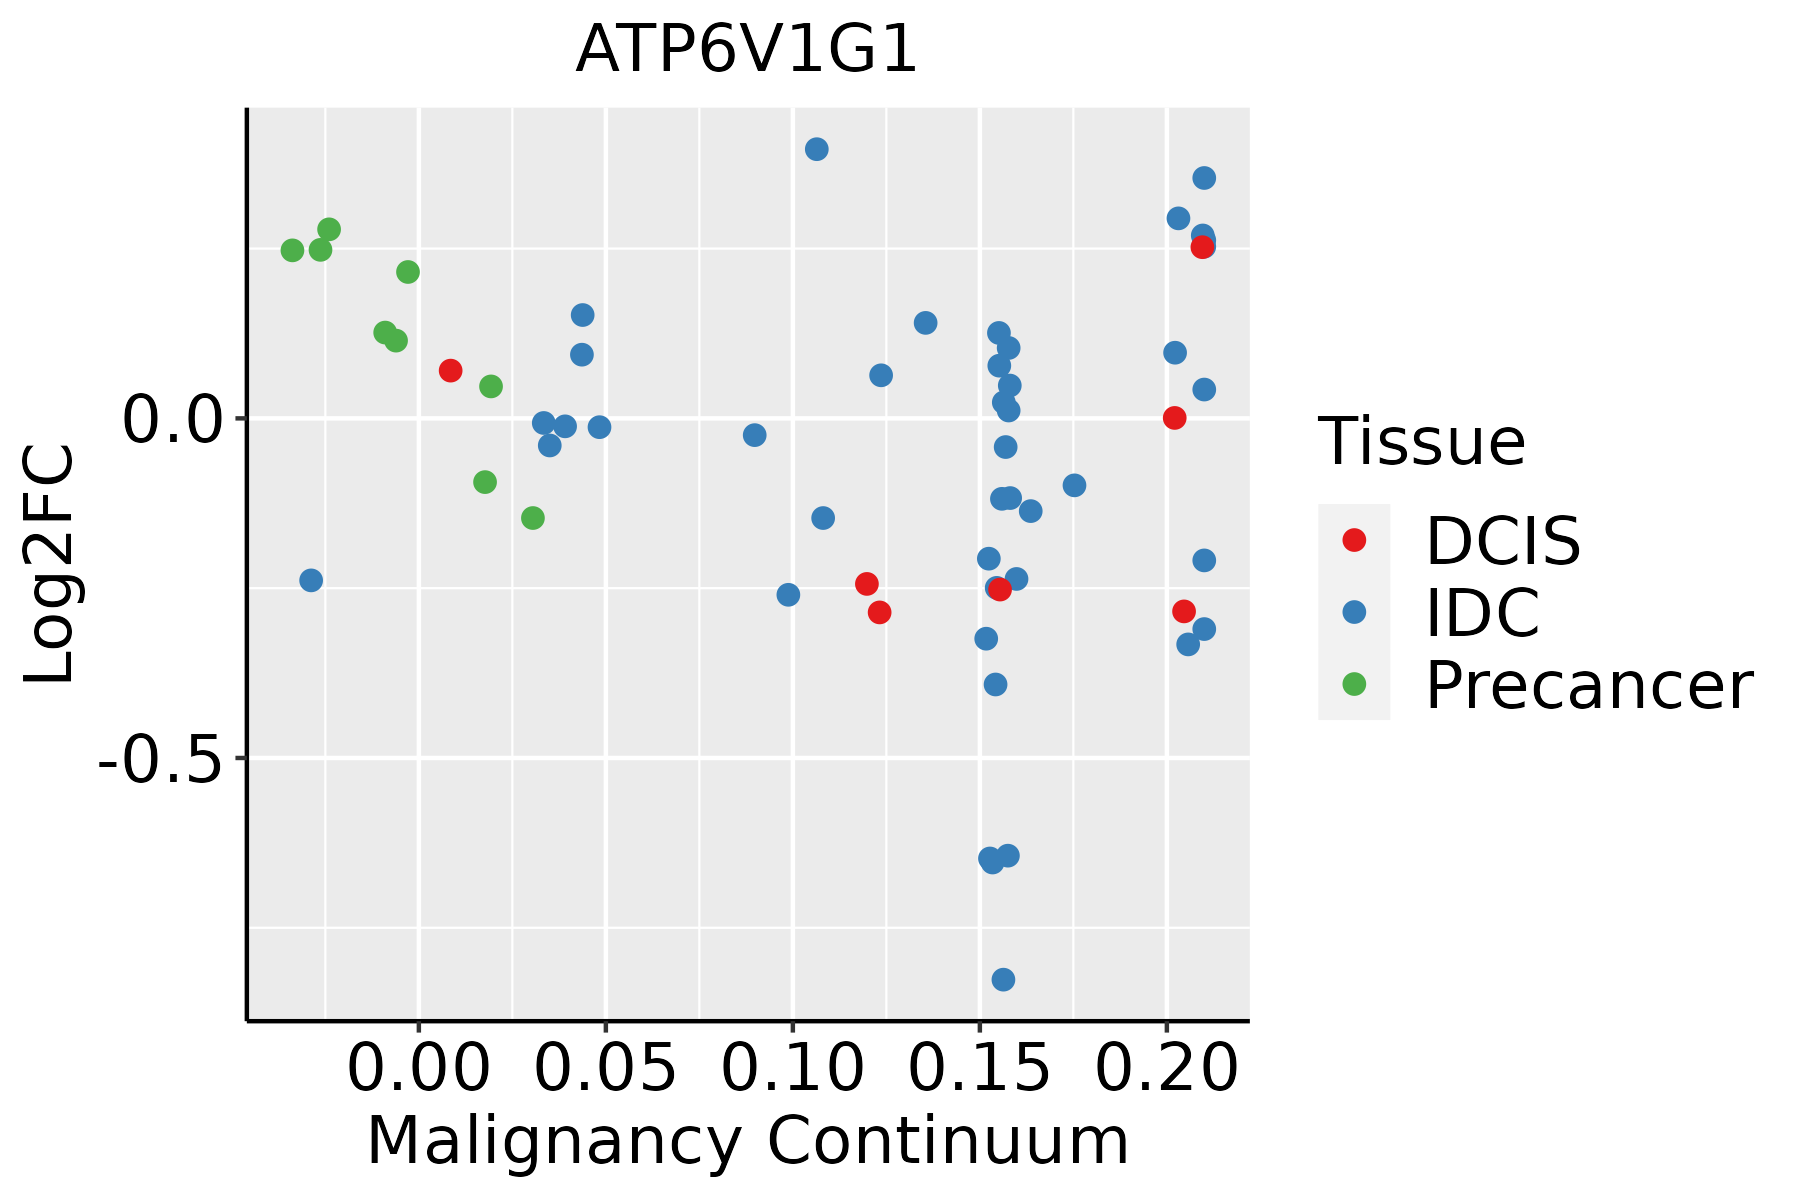 | IDC: Invasive ductal carcinoma |
| DCIS: Ductal carcinoma in situ | ||
| Precancer(BRCA1-mut): Precancerous lesion from BRCA1 mutation carriers | ||
| Cervix | 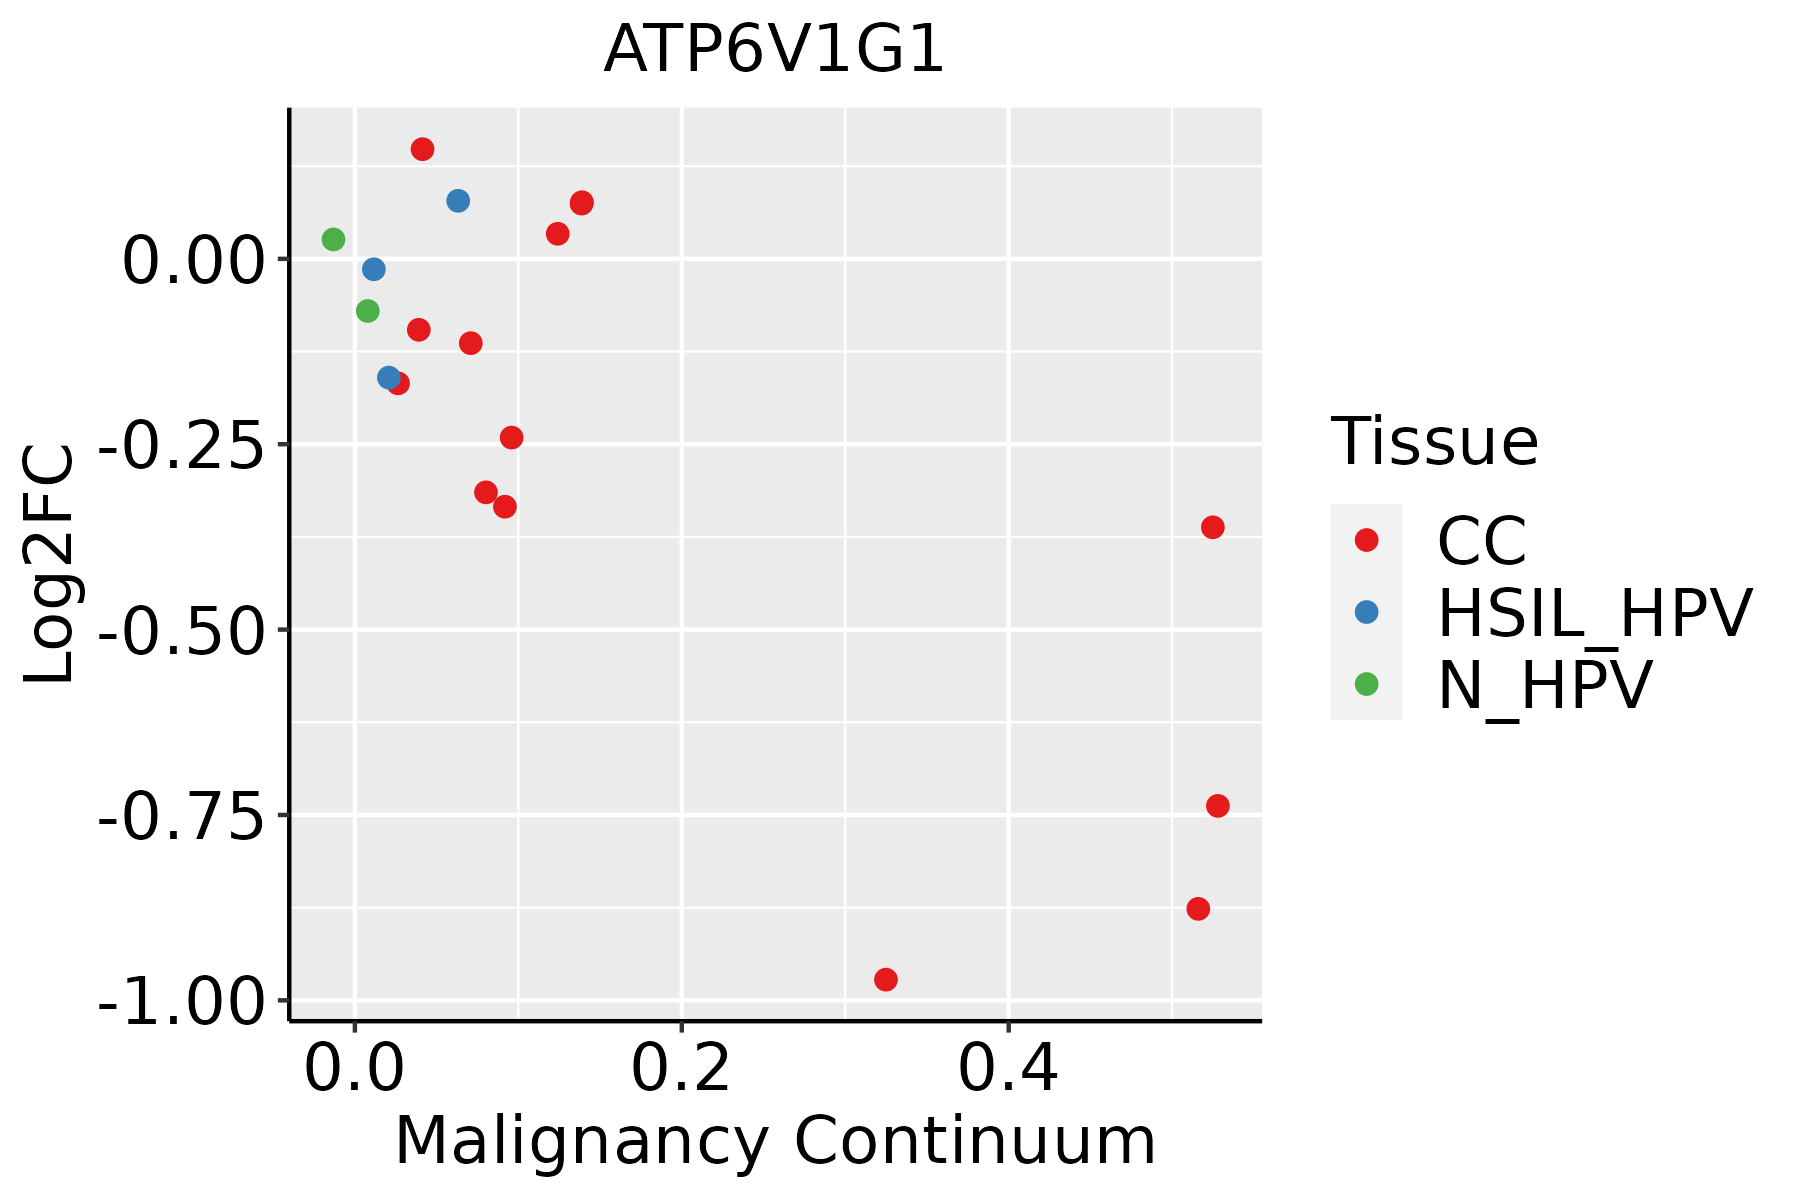 | CC: Cervix cancer |
| HSIL_HPV: HPV-infected high-grade squamous intraepithelial lesions | ||
| N_HPV: HPV-infected normal cervix | ||
| Colorectum (GSE201348) |  | FAP: Familial adenomatous polyposis |
| CRC: Colorectal cancer | ||
| Colorectum (HTA11) |  | AD: Adenomas |
| SER: Sessile serrated lesions | ||
| MSI-H: Microsatellite-high colorectal cancer | ||
| MSS: Microsatellite stable colorectal cancer | ||
| Endometrium |  | AEH: Atypical endometrial hyperplasia |
| EEC: Endometrioid Cancer | ||
| Esophagus |  | ESCC: Esophageal squamous cell carcinoma |
| HGIN: High-grade intraepithelial neoplasias | ||
| LGIN: Low-grade intraepithelial neoplasias | ||
| Liver | 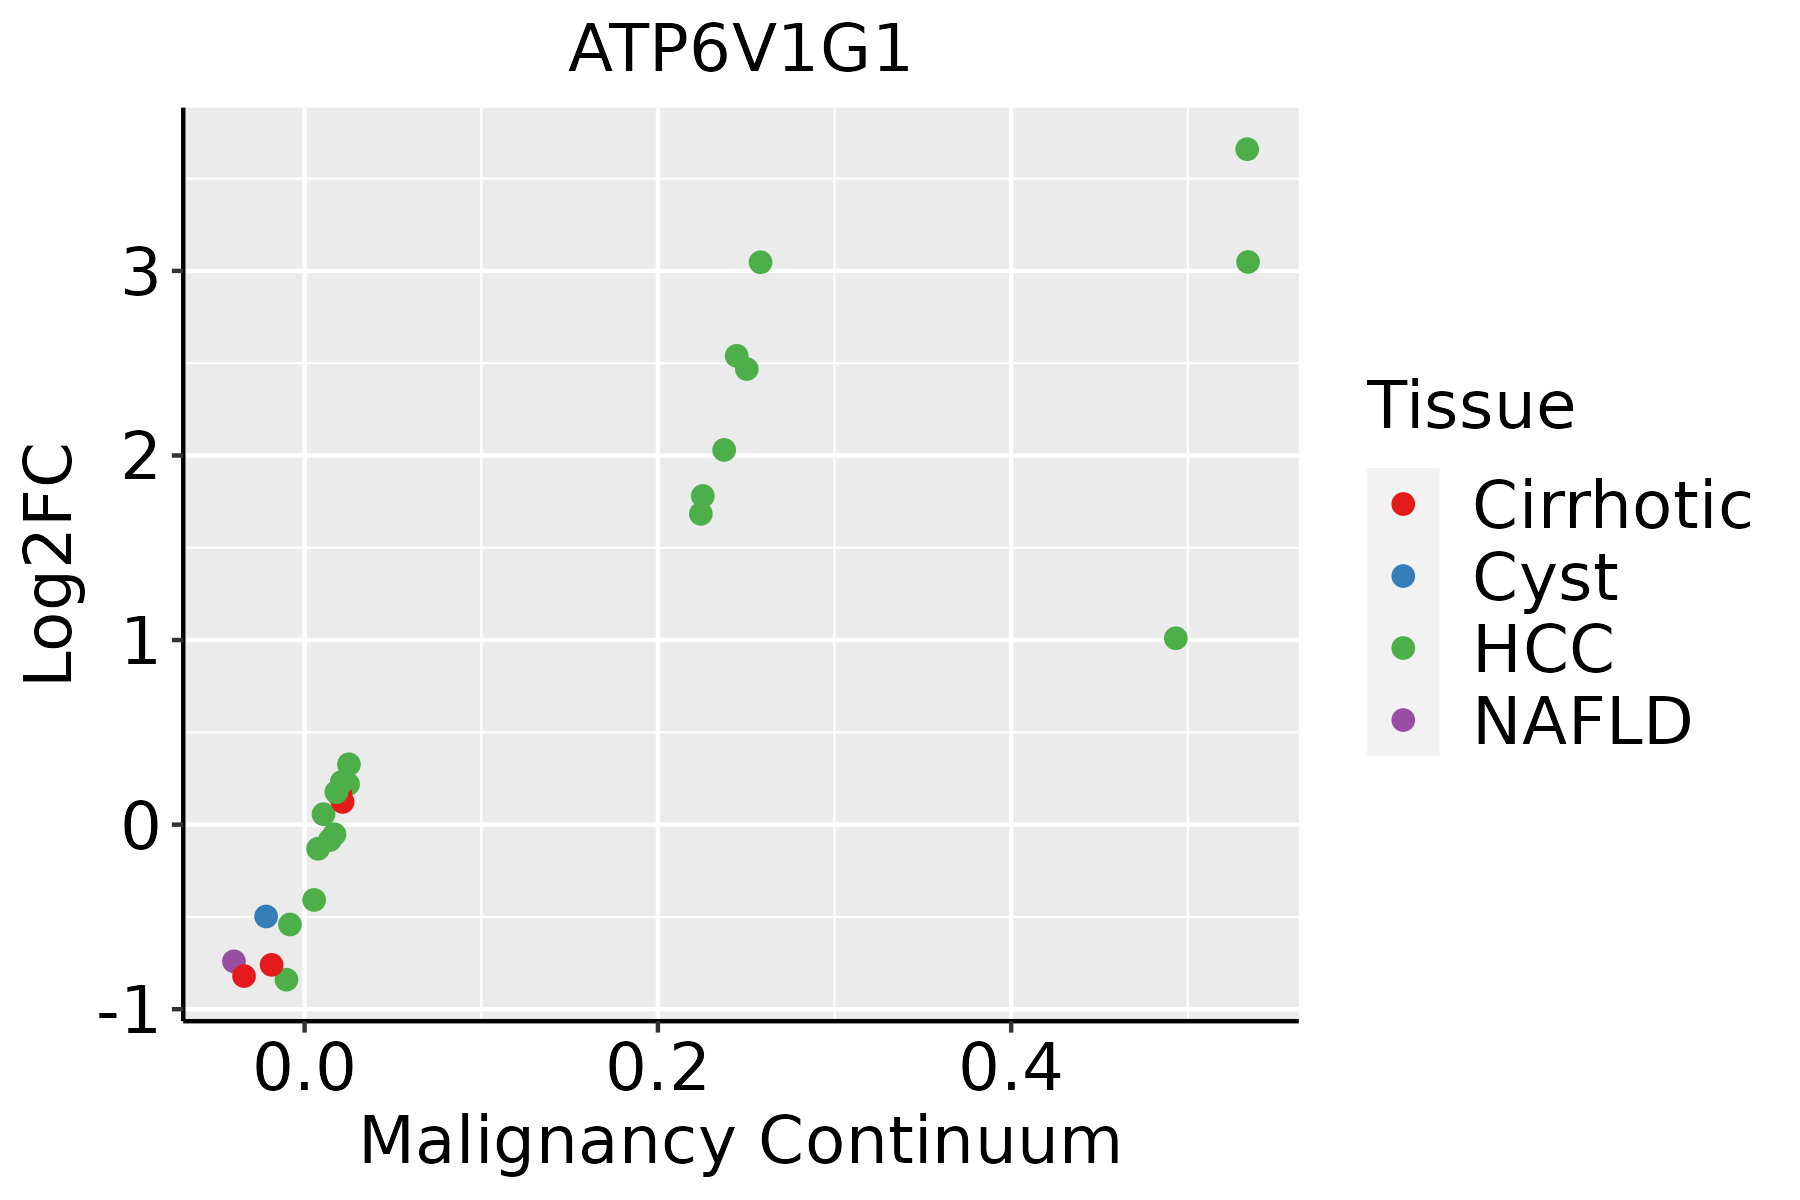 | HCC: Hepatocellular carcinoma |
| NAFLD: Non-alcoholic fatty liver disease | ||
| Oral Cavity |  | EOLP: Erosive Oral lichen planus |
| LP: leukoplakia | ||
| NEOLP: Non-erosive oral lichen planus | ||
| OSCC: Oral squamous cell carcinoma | ||
| Prostate | 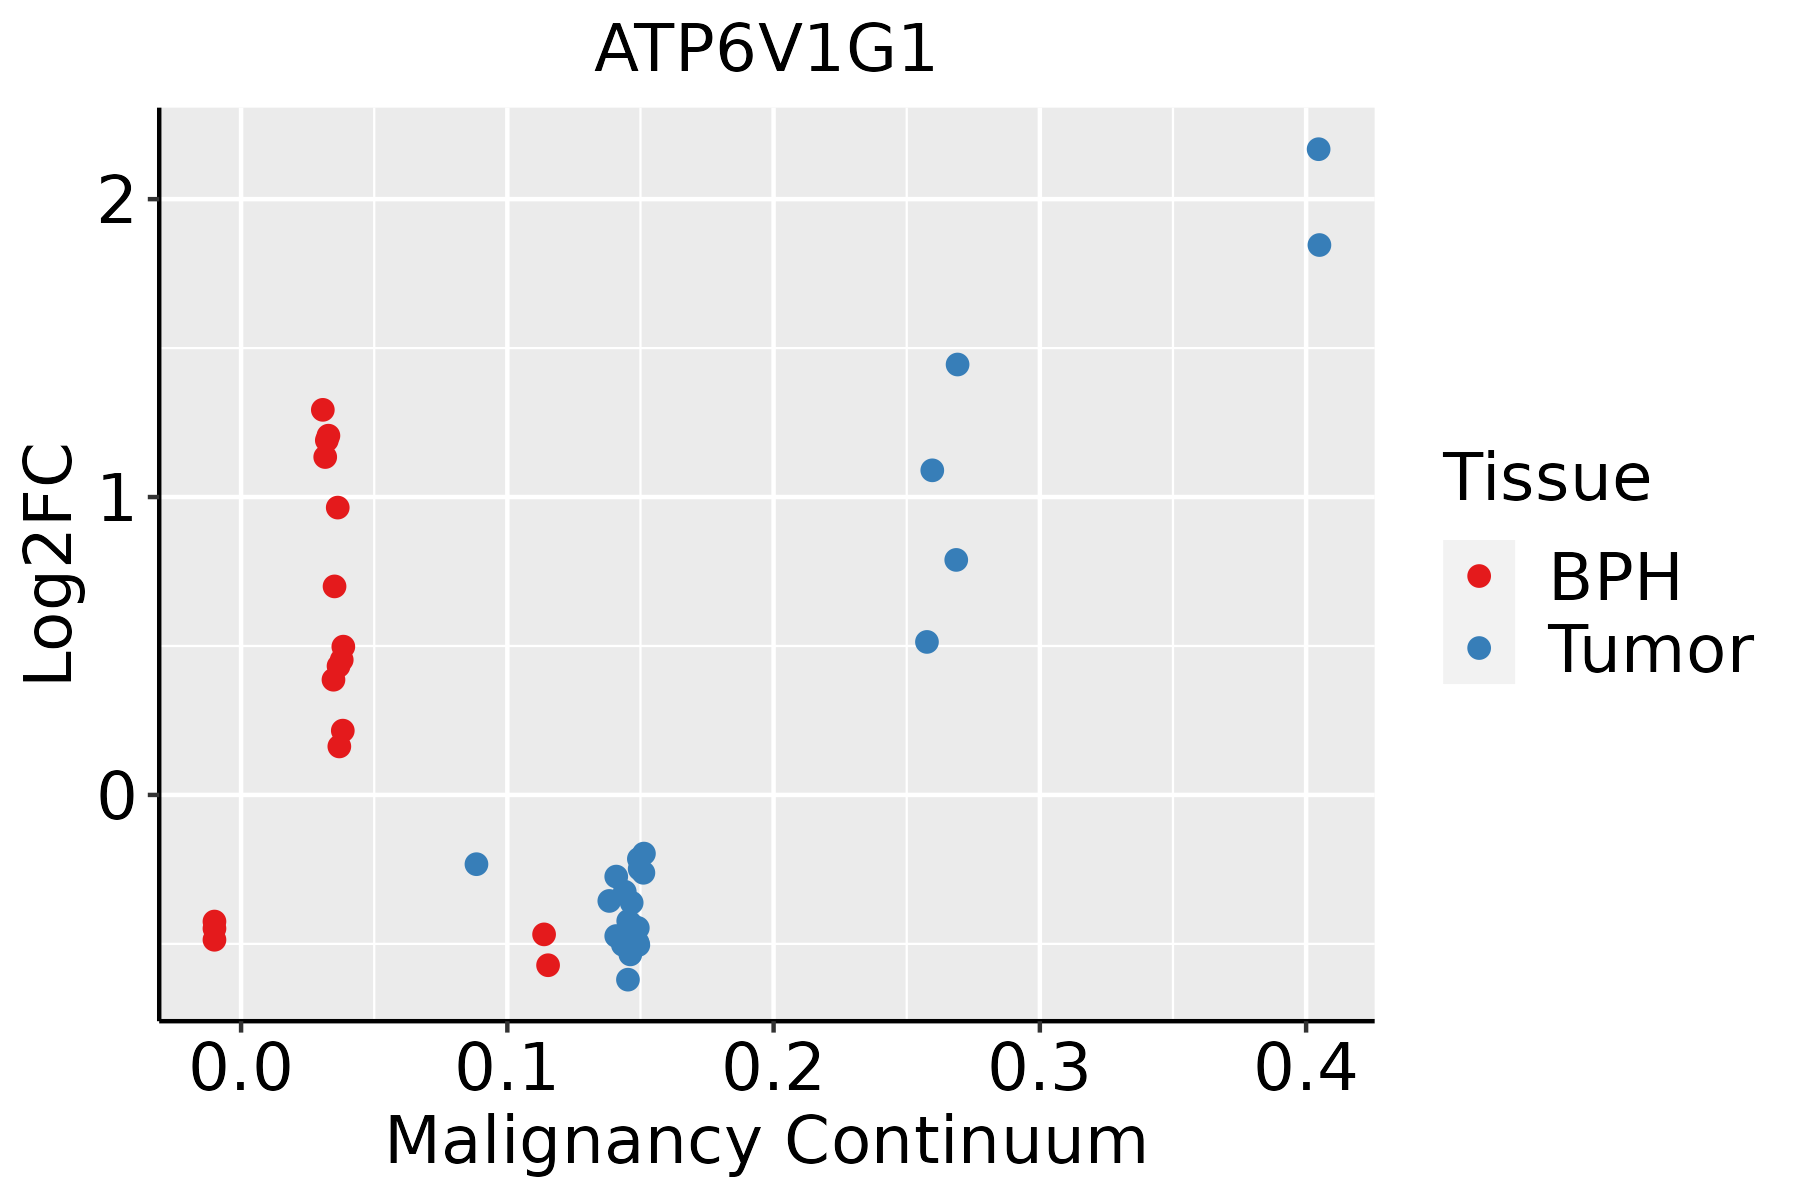 | BPH: Benign Prostatic Hyperplasia |
| Skin |  | AK: Actinic keratosis |
| cSCC: Cutaneous squamous cell carcinoma | ||
| SCCIS:squamous cell carcinoma in situ | ||
| Thyroid | 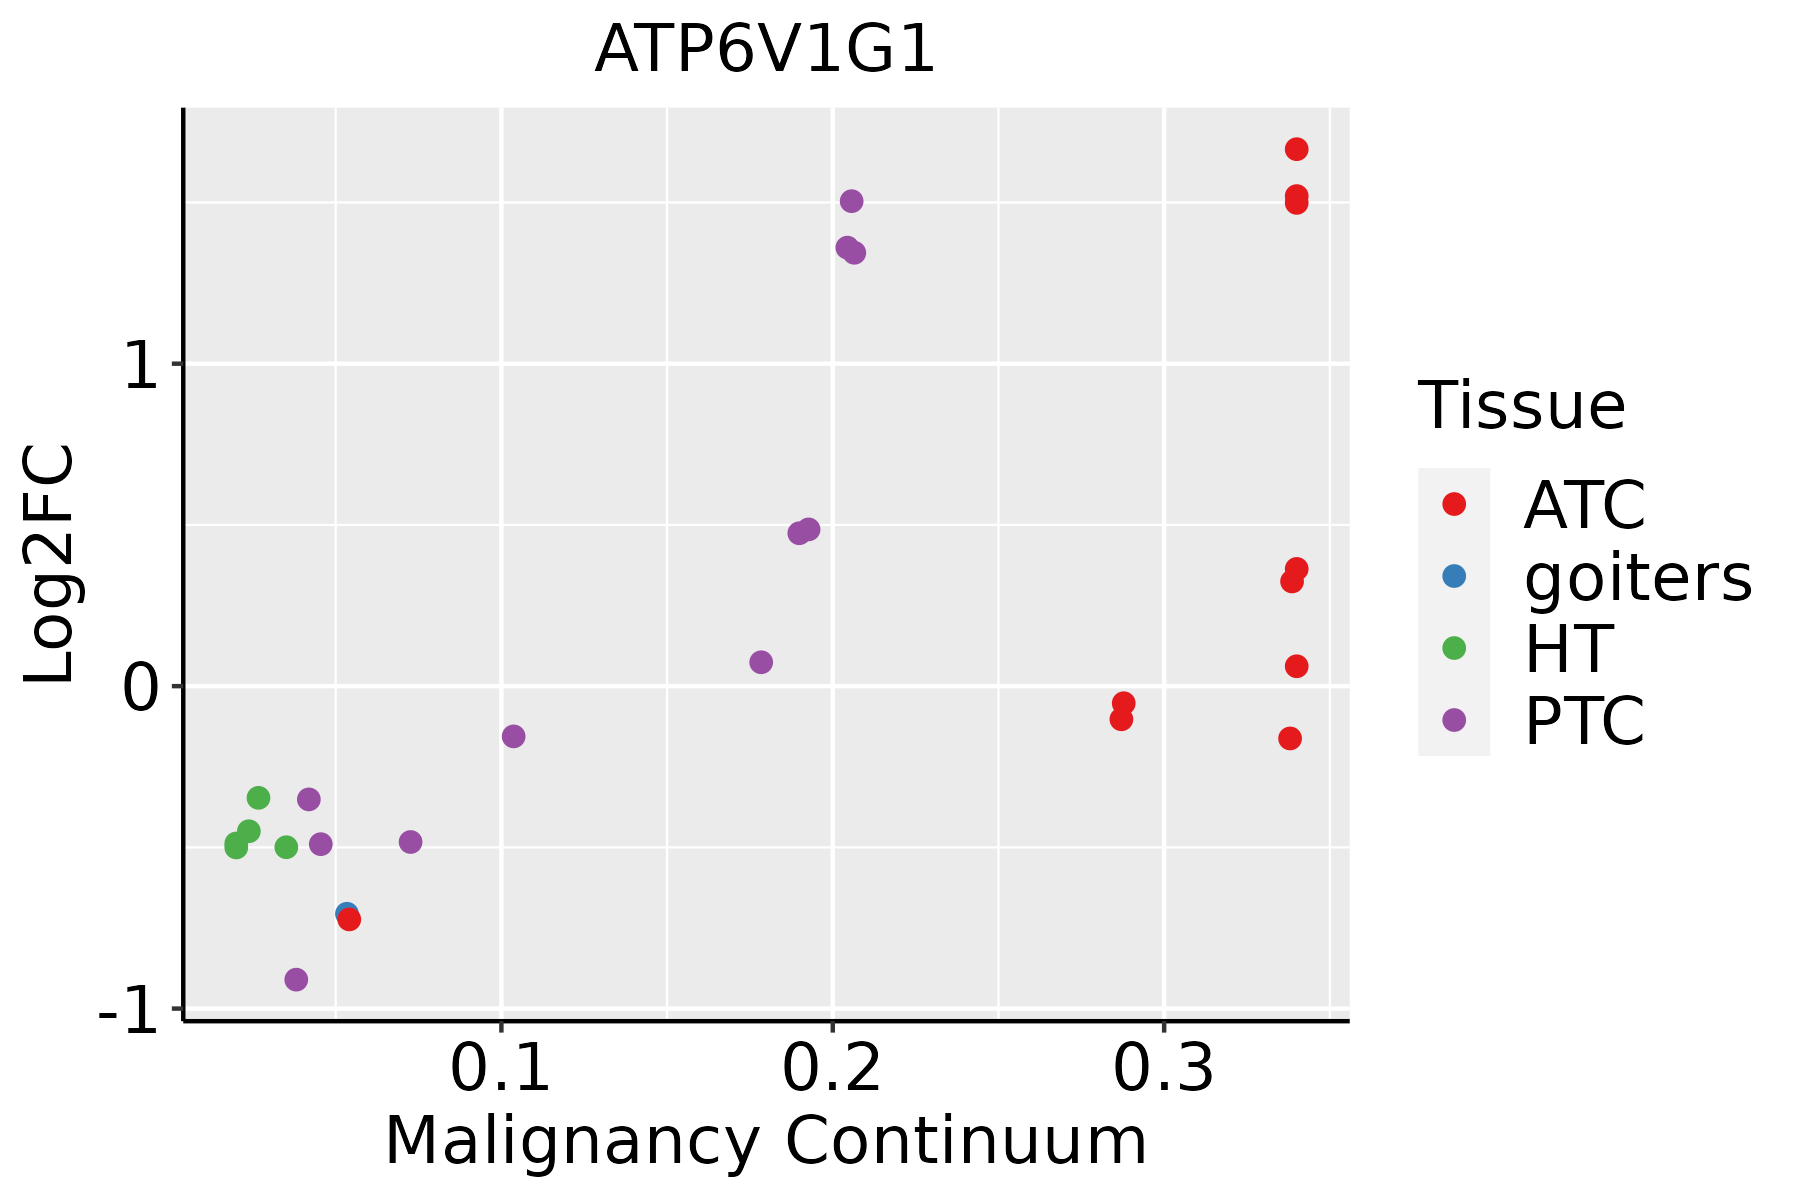 | ATC: Anaplastic thyroid cancer |
| HT: Hashimoto's thyroiditis | ||
| PTC: Papillary thyroid cancer |
| ∗log2FC in expression of this searched gene in stem-like cells from each diseased tissue sample relative to stem-like cells in normal samples in each tissue plotted against the malignancy continuum. Samples are colored based on if they are from different disease stage. |
Top |
Malignant transformation related pathway analysis |
| Find out the enriched GO biological processes and KEGG pathways involved in transition from healthy to precancer to cancer |
| Tissue | Disease Stage | Enriched GO biological Processes |
| Esophagus | ESCC |  |
| Skin | AK |  |
| Skin | SCCIS |  |
| Skin | cSCC |  |
| Thyroid | HT |  |
| ∗Top 15 enriched GO BP terms are showed in the bar plot of each disease state in each tissue. Each row represents a significant GO biological process which is colored according to the -log10(p.adjust). |
| Page: 1 2 3 4 5 6 7 8 9 |
| GO ID | Tissue | Disease Stage | Description | Gene Ratio | Bg Ratio | pvalue | p.adjust | Count |
| GO:19026008 | Breast | Precancer | proton transmembrane transport | 39/1080 | 157/18723 | 4.18e-15 | 1.18e-12 | 39 |
| GO:00704829 | Breast | Precancer | response to oxygen levels | 55/1080 | 347/18723 | 7.47e-12 | 1.11e-09 | 55 |
| GO:00714538 | Breast | Precancer | cellular response to oxygen levels | 32/1080 | 177/18723 | 7.32e-09 | 5.52e-07 | 32 |
| GO:00550767 | Breast | Precancer | transition metal ion homeostasis | 20/1080 | 138/18723 | 1.28e-04 | 2.24e-03 | 20 |
| GO:00469165 | Breast | Precancer | cellular transition metal ion homeostasis | 17/1080 | 115/18723 | 3.15e-04 | 4.49e-03 | 17 |
| GO:00550725 | Breast | Precancer | iron ion homeostasis | 12/1080 | 85/18723 | 3.41e-03 | 2.85e-02 | 12 |
| GO:190260012 | Breast | IDC | proton transmembrane transport | 40/1434 | 157/18723 | 7.34e-12 | 1.34e-09 | 40 |
| GO:007048214 | Breast | IDC | response to oxygen levels | 64/1434 | 347/18723 | 3.45e-11 | 5.57e-09 | 64 |
| GO:007145313 | Breast | IDC | cellular response to oxygen levels | 35/1434 | 177/18723 | 1.68e-07 | 9.10e-06 | 35 |
| GO:005507613 | Breast | IDC | transition metal ion homeostasis | 23/1434 | 138/18723 | 3.20e-04 | 4.79e-03 | 23 |
| GO:004691612 | Breast | IDC | cellular transition metal ion homeostasis | 20/1434 | 115/18723 | 4.35e-04 | 5.90e-03 | 20 |
| GO:005507212 | Breast | IDC | iron ion homeostasis | 14/1434 | 85/18723 | 4.98e-03 | 3.77e-02 | 14 |
| GO:190260022 | Breast | DCIS | proton transmembrane transport | 40/1390 | 157/18723 | 2.77e-12 | 5.80e-10 | 40 |
| GO:007048223 | Breast | DCIS | response to oxygen levels | 63/1390 | 347/18723 | 2.66e-11 | 4.56e-09 | 63 |
| GO:007145322 | Breast | DCIS | cellular response to oxygen levels | 35/1390 | 177/18723 | 7.89e-08 | 4.47e-06 | 35 |
| GO:005507622 | Breast | DCIS | transition metal ion homeostasis | 23/1390 | 138/18723 | 2.04e-04 | 3.27e-03 | 23 |
| GO:004691621 | Breast | DCIS | cellular transition metal ion homeostasis | 20/1390 | 115/18723 | 2.91e-04 | 4.27e-03 | 20 |
| GO:005507221 | Breast | DCIS | iron ion homeostasis | 14/1390 | 85/18723 | 3.78e-03 | 3.03e-02 | 14 |
| GO:19026009 | Cervix | CC | proton transmembrane transport | 39/2311 | 157/18723 | 1.23e-05 | 2.57e-04 | 39 |
| GO:007048210 | Cervix | CC | response to oxygen levels | 67/2311 | 347/18723 | 1.21e-04 | 1.51e-03 | 67 |
| Page: 1 2 3 4 5 6 7 8 9 |
| Pathway ID | Tissue | Disease Stage | Description | Gene Ratio | Bg Ratio | pvalue | p.adjust | qvalue | Count |
| hsa0019016 | Breast | Precancer | Oxidative phosphorylation | 59/684 | 134/8465 | 6.15e-30 | 3.24e-28 | 2.48e-28 | 59 |
| hsa0511014 | Breast | Precancer | Vibrio cholerae infection | 14/684 | 50/8465 | 2.67e-05 | 2.64e-04 | 2.02e-04 | 14 |
| hsa0414518 | Breast | Precancer | Phagosome | 27/684 | 152/8465 | 7.37e-05 | 6.85e-04 | 5.25e-04 | 27 |
| hsa0532312 | Breast | Precancer | Rheumatoid arthritis | 19/684 | 93/8465 | 1.30e-04 | 1.14e-03 | 8.73e-04 | 19 |
| hsa051206 | Breast | Precancer | Epithelial cell signaling in Helicobacter pylori infection | 14/684 | 70/8465 | 1.21e-03 | 7.99e-03 | 6.12e-03 | 14 |
| hsa0019017 | Breast | Precancer | Oxidative phosphorylation | 59/684 | 134/8465 | 6.15e-30 | 3.24e-28 | 2.48e-28 | 59 |
| hsa0511015 | Breast | Precancer | Vibrio cholerae infection | 14/684 | 50/8465 | 2.67e-05 | 2.64e-04 | 2.02e-04 | 14 |
| hsa0414519 | Breast | Precancer | Phagosome | 27/684 | 152/8465 | 7.37e-05 | 6.85e-04 | 5.25e-04 | 27 |
| hsa0532313 | Breast | Precancer | Rheumatoid arthritis | 19/684 | 93/8465 | 1.30e-04 | 1.14e-03 | 8.73e-04 | 19 |
| hsa0512013 | Breast | Precancer | Epithelial cell signaling in Helicobacter pylori infection | 14/684 | 70/8465 | 1.21e-03 | 7.99e-03 | 6.12e-03 | 14 |
| hsa0019023 | Breast | IDC | Oxidative phosphorylation | 62/867 | 134/8465 | 4.78e-27 | 2.59e-25 | 1.94e-25 | 62 |
| hsa0511022 | Breast | IDC | Vibrio cholerae infection | 17/867 | 50/8465 | 4.82e-06 | 6.82e-05 | 5.10e-05 | 17 |
| hsa0414522 | Breast | IDC | Phagosome | 34/867 | 152/8465 | 8.00e-06 | 9.99e-05 | 7.48e-05 | 34 |
| hsa0532321 | Breast | IDC | Rheumatoid arthritis | 21/867 | 93/8465 | 3.69e-04 | 3.15e-03 | 2.36e-03 | 21 |
| hsa0512022 | Breast | IDC | Epithelial cell signaling in Helicobacter pylori infection | 16/867 | 70/8465 | 1.56e-03 | 1.13e-02 | 8.42e-03 | 16 |
| hsa0019033 | Breast | IDC | Oxidative phosphorylation | 62/867 | 134/8465 | 4.78e-27 | 2.59e-25 | 1.94e-25 | 62 |
| hsa0511032 | Breast | IDC | Vibrio cholerae infection | 17/867 | 50/8465 | 4.82e-06 | 6.82e-05 | 5.10e-05 | 17 |
| hsa0414532 | Breast | IDC | Phagosome | 34/867 | 152/8465 | 8.00e-06 | 9.99e-05 | 7.48e-05 | 34 |
| hsa0532331 | Breast | IDC | Rheumatoid arthritis | 21/867 | 93/8465 | 3.69e-04 | 3.15e-03 | 2.36e-03 | 21 |
| hsa0512032 | Breast | IDC | Epithelial cell signaling in Helicobacter pylori infection | 16/867 | 70/8465 | 1.56e-03 | 1.13e-02 | 8.42e-03 | 16 |
| Page: 1 2 3 4 5 6 7 8 |
Top |
Cell-cell communication analysis |
| Identification of potential cell-cell interactions between two cell types and their ligand-receptor pairs for different disease states |
| Ligand | Receptor | LRpair | Pathway | Tissue | Disease Stage |
| Page: 1 |
Top |
Single-cell gene regulatory network inference analysis |
| Find out the significant the regulons (TFs) and the target genes of each regulon across cell types for different disease states |
| TF | Cell Type | Tissue | Disease Stage | Target Gene | RSS | Regulon Activity |
| ∗The dot plots of a searched regulon are shown for all cell subpopulations in each disease state of each tissue based on the regulon specific score inferred using pySCENIC and by calculating the average expression. |
| Page: 1 |
Top |
Somatic mutation of malignant transformation related genes |
| Annotation of somatic variants for genes involved in malignant transformation |
| Hugo Symbol | Variant Class | Variant Classification | dbSNP RS | HGVSc | HGVSp | HGVSp Short | SWISSPROT | BIOTYPE | SIFT | PolyPhen | Tumor Sample Barcode | Tissue | Histology | Sex | Age | Stage | Therapy Types | Drugs | Outcome |
| ATP6V1G1 | SNV | Missense_Mutation | novel | c.117A>C | p.Glu39Asp | p.E39D | O75348 | protein_coding | deleterious(0.03) | benign(0.27) | TCGA-AA-A00N-01 | Colorectum | colon adenocarcinoma | Male | >=65 | I/II | Unknown | Unknown | PD |
| ATP6V1G1 | SNV | Missense_Mutation | c.265C>T | p.Arg89Trp | p.R89W | O75348 | protein_coding | deleterious(0.01) | benign(0.443) | TCGA-G4-6309-01 | Colorectum | colon adenocarcinoma | Female | <65 | III/IV | Chemotherapy | xeloda | PD | |
| ATP6V1G1 | SNV | Missense_Mutation | novel | c.110N>G | p.Lys37Arg | p.K37R | O75348 | protein_coding | deleterious(0.03) | possibly_damaging(0.876) | TCGA-AP-A1E0-01 | Endometrium | uterine corpus endometrioid carcinoma | Female | <65 | III/IV | Chemotherapy | paclitaxel | SD |
| ATP6V1G1 | SNV | Missense_Mutation | c.165N>A | p.Phe55Leu | p.F55L | O75348 | protein_coding | deleterious(0.04) | benign(0.211) | TCGA-AX-A0J0-01 | Endometrium | uterine corpus endometrioid carcinoma | Female | <65 | I/II | Unknown | Unknown | SD | |
| ATP6V1G1 | SNV | Missense_Mutation | novel | c.62N>C | p.Lys21Thr | p.K21T | O75348 | protein_coding | deleterious(0) | possibly_damaging(0.903) | TCGA-AX-A1CE-01 | Endometrium | uterine corpus endometrioid carcinoma | Female | <65 | I/II | Unspecific | Paclitaxel | SD |
| ATP6V1G1 | SNV | Missense_Mutation | rs748762523 | c.91C>T | p.Arg31Trp | p.R31W | O75348 | protein_coding | deleterious(0) | benign(0.063) | TCGA-BG-A3PP-01 | Endometrium | uterine corpus endometrioid carcinoma | Female | >=65 | I/II | Chemotherapy | taxol | PD |
| ATP6V1G1 | SNV | Missense_Mutation | novel | c.190N>A | p.Gly64Arg | p.G64R | O75348 | protein_coding | deleterious(0) | probably_damaging(0.996) | TCGA-EO-A22U-01 | Endometrium | uterine corpus endometrioid carcinoma | Female | >=65 | I/II | Unknown | Unknown | SD |
| ATP6V1G1 | SNV | Missense_Mutation | novel | c.72N>T | p.Glu24Asp | p.E24D | O75348 | protein_coding | tolerated(0.1) | probably_damaging(0.978) | TCGA-FI-A2D5-01 | Endometrium | uterine corpus endometrioid carcinoma | Female | <65 | III/IV | Chemotherapy | carboplatinum | PD |
| ATP6V1G1 | SNV | Missense_Mutation | rs754577497 | c.343N>T | p.Arg115Cys | p.R115C | O75348 | protein_coding | deleterious(0.02) | benign(0.003) | TCGA-63-A5MU-01 | Lung | lung squamous cell carcinoma | Male | <65 | I/II | Chemotherapy | cisplatin | PD |
| Page: 1 |
Top |
Related drugs of malignant transformation related genes |
| Identification of chemicals and drugs interact with genes involved in malignant transfromation |
| (DGIdb 4.0) |
| Entrez ID | Symbol | Category | Interaction Types | Drug Claim Name | Drug Name | PMIDs |
| Page: 1 |

Copyright 2023-Present -The University of Texas Health Science Center at Houston |