
|
|||||
|
 | |
| |
| |
| |
| |
| |
|
Gene: SUV420H1 |
Gene summary for SUV420H1 |
| Gene information | Species | Human | Gene symbol | SUV420H1 | Gene ID | 51111 |
| Gene name | lysine methyltransferase 5B | |
| Gene Alias | CGI-85 | |
| Cytomap | 11q13.2 | |
| Gene Type | protein-coding | GO ID | GO:0000018 | UniProtAcc | B7WNX0 |
Top |
Malignant transformation analysis |
| Identification of the aberrant gene expression in precancerous and cancerous lesions by comparing the gene expression of stem-like cells in diseased tissues with normal stem cells |
| Entrez ID | Symbol | Replicates | Species | Organ | Tissue | Adj P-value | Log2FC | Malignancy |
| 51111 | SUV420H1 | GSM5353216_PA_PB1A_Pool_1_3_S50_L002 | Human | Prostate | Tumor | 1.91e-08 | 7.26e-01 | 0.159 |
| 51111 | SUV420H1 | GSM5353218_PA_PB1B_Pool_1_2_S74_L003 | Human | Prostate | Tumor | 1.55e-02 | 4.37e-01 | 0.1479 |
| 51111 | SUV420H1 | GSM5353220_PA_PB1B_Pool_3_S51_L002 | Human | Prostate | Tumor | 3.71e-02 | 4.55e-01 | 0.1531 |
| 51111 | SUV420H1 | GSM5353221_PA_PB2A_Pool_1_3_S25_L001 | Human | Prostate | Tumor | 2.58e-19 | 6.49e-01 | 0.1633 |
| 51111 | SUV420H1 | GSM5353222_PA_PB2B_Pool_1_3_S52_L002 | Human | Prostate | Tumor | 2.73e-18 | 5.91e-01 | 0.1608 |
| 51111 | SUV420H1 | GSM5353223_PA_PB2B_Pool_2_S26_L001 | Human | Prostate | Tumor | 8.77e-19 | 7.23e-01 | 0.1604 |
| 51111 | SUV420H1 | GSM5353224_PA_PR5186_Pool_1_2_3_S27_L001 | Human | Prostate | Tumor | 1.12e-19 | 6.47e-01 | 0.1621 |
| 51111 | SUV420H1 | GSM5353225_PA_PR5196-1_Pool_1_2_3_S53_L002 | Human | Prostate | Tumor | 3.27e-04 | 4.18e-01 | 0.1619 |
| 51111 | SUV420H1 | GSM5353226_PA_PR5196-2_Pool_1_2_3_S54_L002 | Human | Prostate | Tumor | 2.91e-04 | 4.75e-01 | 0.159 |
| 51111 | SUV420H1 | GSM5353227_PA_PR5199-193K_Pool_1_2_3_S55_L002 | Human | Prostate | Tumor | 9.38e-11 | 5.07e-01 | 0.1602 |
| 51111 | SUV420H1 | GSM5353236_PA_PR5251_T1_S7_L001 | Human | Prostate | Tumor | 2.14e-14 | 7.41e-01 | 0.1608 |
| 51111 | SUV420H1 | GSM5353237_PA_PR5251_T2_S8_L001 | Human | Prostate | Tumor | 3.79e-09 | 6.83e-01 | 0.1622 |
| 51111 | SUV420H1 | GSM5353240_PA_PR5254_T1_S15_L001 | Human | Prostate | Tumor | 6.84e-22 | 6.81e-01 | 0.1575 |
| 51111 | SUV420H1 | GSM5353243_PA_PR5261_T1_S23_L002 | Human | Prostate | Tumor | 2.85e-08 | 4.09e-01 | 0.1545 |
| 51111 | SUV420H1 | GSM5353244_PA_PR5261_T2_S24_L002 | Human | Prostate | Tumor | 1.24e-08 | 4.35e-01 | 0.1569 |
| 51111 | SUV420H1 | GSM5353248_PA_PR5269_4_S28_L002 | Human | Prostate | Tumor | 6.98e-05 | 6.83e-01 | 0.1541 |
| 51111 | SUV420H1 | P1_cSCC | Human | Skin | cSCC | 2.33e-10 | 4.86e-01 | 0.0292 |
| 51111 | SUV420H1 | P2_cSCC | Human | Skin | cSCC | 3.29e-10 | 3.59e-01 | -0.024 |
| 51111 | SUV420H1 | P4_cSCC | Human | Skin | cSCC | 8.07e-12 | 2.88e-01 | -0.00290000000000005 |
| 51111 | SUV420H1 | P10_cSCC | Human | Skin | cSCC | 1.28e-15 | 4.97e-01 | 0.1017 |
| Page: 1 |
| Tissue | Expression Dynamics | Abbreviation |
| Prostate | 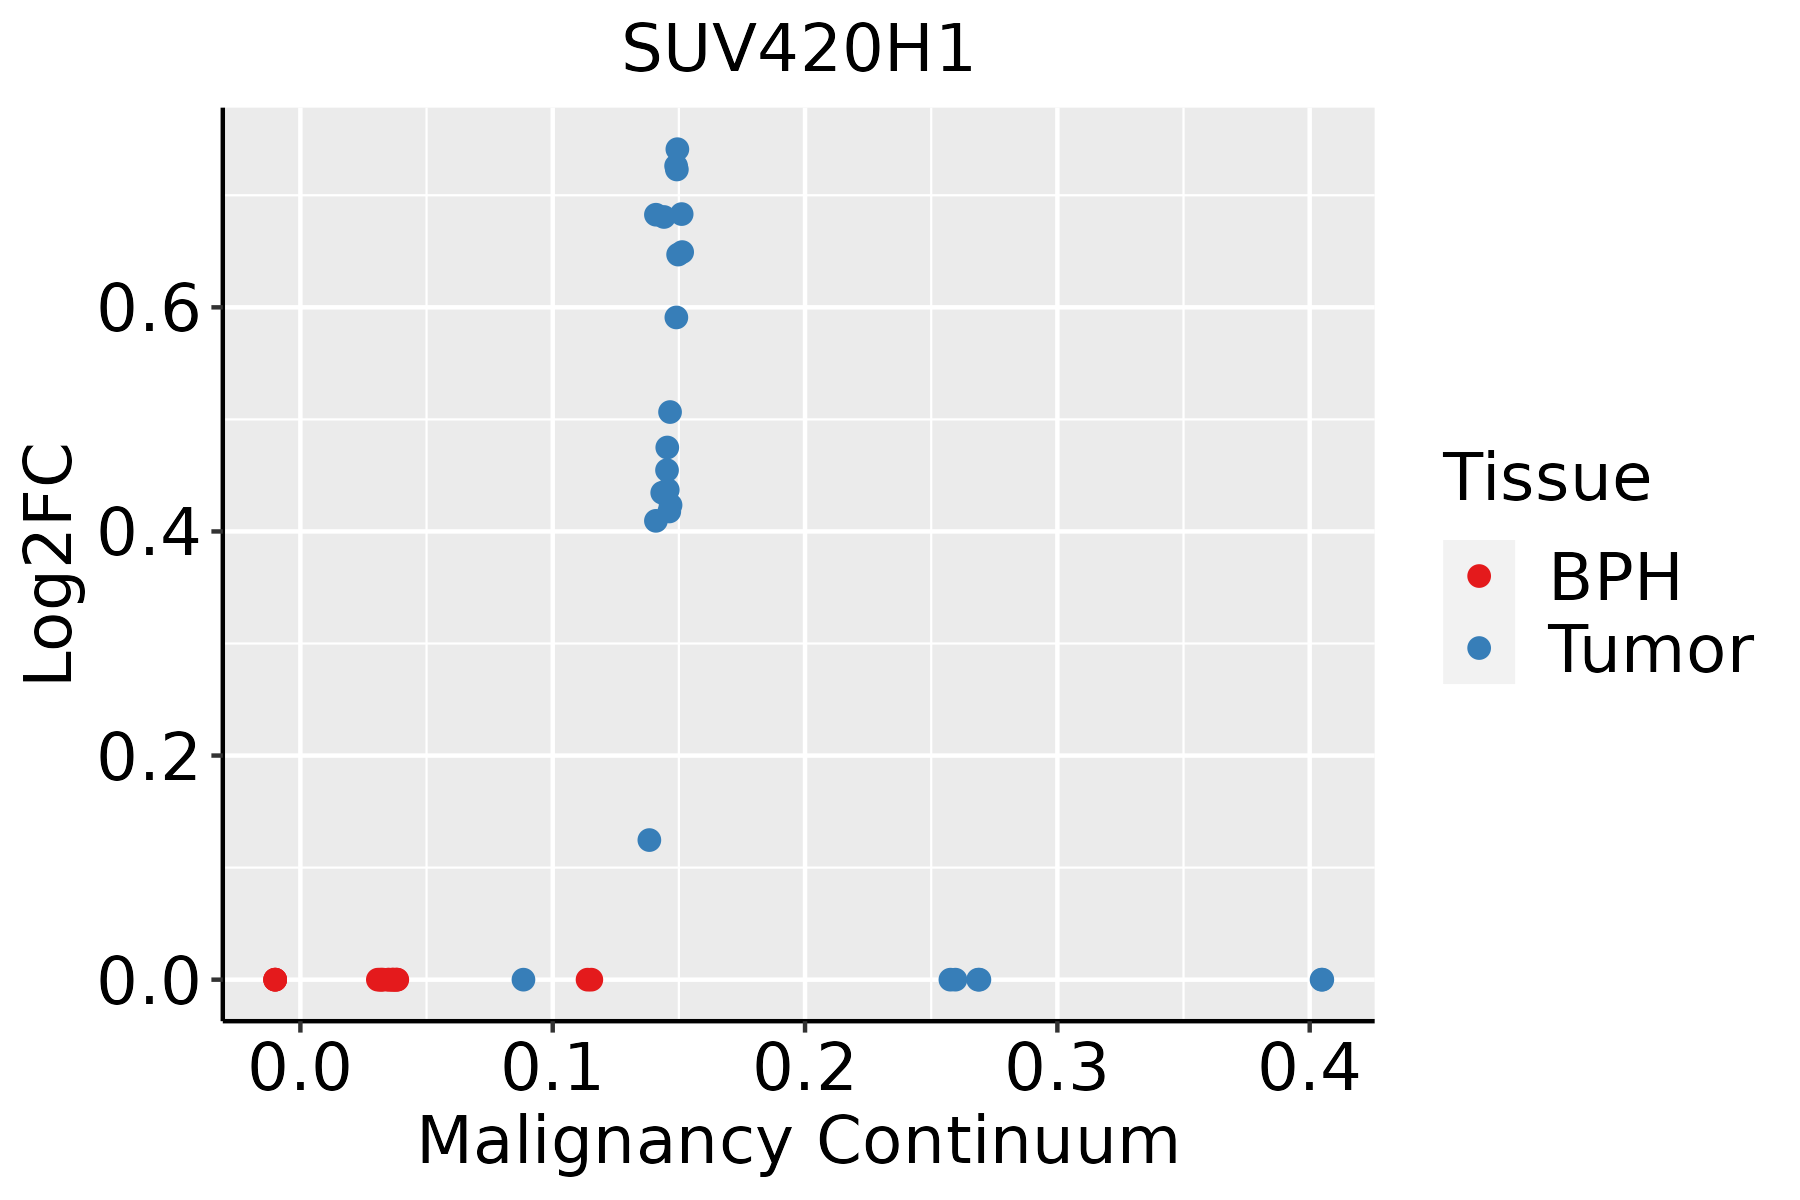 | BPH: Benign Prostatic Hyperplasia |
| Skin |  | AK: Actinic keratosis |
| cSCC: Cutaneous squamous cell carcinoma | ||
| SCCIS:squamous cell carcinoma in situ |
| ∗log2FC in expression of this searched gene in stem-like cells from each diseased tissue sample relative to stem-like cells in normal samples in each tissue plotted against the malignancy continuum. Samples are colored based on if they are from different disease stage. |
Top |
Malignant transformation related pathway analysis |
| Find out the enriched GO biological processes and KEGG pathways involved in transition from healthy to precancer to cancer |
| Tissue | Disease Stage | Enriched GO biological Processes |
| Oral cavity | OSCC |  |
| Oral cavity | LP |  |
| Oral cavity | EOLP |  |
| Oral cavity | NEOLP |  |
| Esophagus | HGIN |  |
| ∗Top 15 enriched GO BP terms are showed in the bar plot of each disease state in each tissue. Each row represents a significant GO biological process which is colored according to the -log10(p.adjust). |
| Page: 1 2 3 4 5 6 7 8 9 |
| GO ID | Tissue | Disease Stage | Description | Gene Ratio | Bg Ratio | pvalue | p.adjust | Count |
| Page: 1 |
| Pathway ID | Tissue | Disease Stage | Description | Gene Ratio | Bg Ratio | pvalue | p.adjust | qvalue | Count |
| hsa00310 | Colorectum | AD | Lysine degradation | 27/2092 | 63/8465 | 1.17e-03 | 7.75e-03 | 4.94e-03 | 27 |
| hsa003101 | Colorectum | AD | Lysine degradation | 27/2092 | 63/8465 | 1.17e-03 | 7.75e-03 | 4.94e-03 | 27 |
| hsa003104 | Colorectum | FAP | Lysine degradation | 23/1404 | 63/8465 | 1.04e-04 | 9.46e-04 | 5.76e-04 | 23 |
| hsa003105 | Colorectum | FAP | Lysine degradation | 23/1404 | 63/8465 | 1.04e-04 | 9.46e-04 | 5.76e-04 | 23 |
| hsa003106 | Colorectum | CRC | Lysine degradation | 18/1091 | 63/8465 | 7.21e-04 | 6.34e-03 | 4.30e-03 | 18 |
| hsa003107 | Colorectum | CRC | Lysine degradation | 18/1091 | 63/8465 | 7.21e-04 | 6.34e-03 | 4.30e-03 | 18 |
| hsa0031010 | Esophagus | ESCC | Lysine degradation | 41/4205 | 63/8465 | 9.63e-03 | 2.27e-02 | 1.16e-02 | 41 |
| hsa0031013 | Esophagus | ESCC | Lysine degradation | 41/4205 | 63/8465 | 9.63e-03 | 2.27e-02 | 1.16e-02 | 41 |
| hsa003108 | Liver | NAFLD | Lysine degradation | 21/1043 | 63/8465 | 1.09e-05 | 3.58e-04 | 2.89e-04 | 21 |
| hsa0031011 | Liver | NAFLD | Lysine degradation | 21/1043 | 63/8465 | 1.09e-05 | 3.58e-04 | 2.89e-04 | 21 |
| hsa0031021 | Liver | Cirrhotic | Lysine degradation | 29/2530 | 63/8465 | 4.81e-03 | 1.74e-02 | 1.07e-02 | 29 |
| hsa0031031 | Liver | Cirrhotic | Lysine degradation | 29/2530 | 63/8465 | 4.81e-03 | 1.74e-02 | 1.07e-02 | 29 |
| hsa0031041 | Liver | HCC | Lysine degradation | 47/4020 | 63/8465 | 1.02e-05 | 7.58e-05 | 4.22e-05 | 47 |
| hsa0031051 | Liver | HCC | Lysine degradation | 47/4020 | 63/8465 | 1.02e-05 | 7.58e-05 | 4.22e-05 | 47 |
| Page: 1 |
Top |
Cell-cell communication analysis |
| Identification of potential cell-cell interactions between two cell types and their ligand-receptor pairs for different disease states |
| Ligand | Receptor | LRpair | Pathway | Tissue | Disease Stage |
| Page: 1 |
Top |
Single-cell gene regulatory network inference analysis |
| Find out the significant the regulons (TFs) and the target genes of each regulon across cell types for different disease states |
| TF | Cell Type | Tissue | Disease Stage | Target Gene | RSS | Regulon Activity |
| ∗The dot plots of a searched regulon are shown for all cell subpopulations in each disease state of each tissue based on the regulon specific score inferred using pySCENIC and by calculating the average expression. |
| Page: 1 |
Top |
Somatic mutation of malignant transformation related genes |
| Annotation of somatic variants for genes involved in malignant transformation |
| Hugo Symbol | Variant Class | Variant Classification | dbSNP RS | HGVSc | HGVSp | HGVSp Short | SWISSPROT | BIOTYPE | SIFT | PolyPhen | Tumor Sample Barcode | Tissue | Histology | Sex | Age | Stage | Therapy Types | Drugs | Outcome |
| Page: 1 |
Top |
Related drugs of malignant transformation related genes |
| Identification of chemicals and drugs interact with genes involved in malignant transfromation |
| (DGIdb 4.0) |
| Entrez ID | Symbol | Category | Interaction Types | Drug Claim Name | Drug Name | PMIDs |
| Page: 1 |

Copyright 2023-Present -The University of Texas Health Science Center at Houston |