
|
|||||
|
 | |
| |
| |
| |
| |
| |
|
Gene: SNHG12 |
Gene summary for SNHG12 |
| Gene information | Species | Human | Gene symbol | SNHG12 | Gene ID | 85028 |
| Gene name | small nucleolar RNA host gene 12 | |
| Gene Alias | ASLNC04080 | |
| Cytomap | 1p35.3 | |
| Gene Type | ncRNA | GO ID | GO:0006139 | UniProtAcc | NA |
Top |
Malignant transformation analysis |
| Identification of the aberrant gene expression in precancerous and cancerous lesions by comparing the gene expression of stem-like cells in diseased tissues with normal stem cells |
| Entrez ID | Symbol | Replicates | Species | Organ | Tissue | Adj P-value | Log2FC | Malignancy |
| 85028 | SNHG12 | CCI_1 | Human | Cervix | CC | 2.33e-03 | 2.11e-01 | 0.528 |
| 85028 | SNHG12 | Tumor | Human | Cervix | CC | 8.81e-06 | 1.40e-01 | 0.1241 |
| 85028 | SNHG12 | sample1 | Human | Cervix | CC | 7.04e-14 | 4.57e-01 | 0.0959 |
| 85028 | SNHG12 | sample3 | Human | Cervix | CC | 1.88e-05 | 1.74e-01 | 0.1387 |
| 85028 | SNHG12 | H2 | Human | Cervix | HSIL_HPV | 1.91e-09 | 2.54e-01 | 0.0632 |
| 85028 | SNHG12 | L1 | Human | Cervix | CC | 2.90e-02 | 1.62e-01 | 0.0802 |
| 85028 | SNHG12 | T1 | Human | Cervix | CC | 7.83e-36 | 6.76e-01 | 0.0918 |
| 85028 | SNHG12 | T2 | Human | Cervix | CC | 3.58e-17 | 5.41e-01 | 0.0709 |
| 85028 | SNHG12 | T3 | Human | Cervix | CC | 7.36e-13 | 1.92e-01 | 0.1389 |
| 85028 | SNHG12 | LZE4T | Human | Esophagus | ESCC | 2.37e-10 | 4.97e-01 | 0.0811 |
| 85028 | SNHG12 | LZE7T | Human | Esophagus | ESCC | 1.89e-17 | 1.11e+00 | 0.0667 |
| 85028 | SNHG12 | LZE8T | Human | Esophagus | ESCC | 2.47e-24 | 7.46e-01 | 0.067 |
| 85028 | SNHG12 | LZE20T | Human | Esophagus | ESCC | 1.81e-11 | 4.96e-01 | 0.0662 |
| 85028 | SNHG12 | LZE22D1 | Human | Esophagus | HGIN | 1.10e-02 | 5.32e-01 | 0.0595 |
| 85028 | SNHG12 | LZE22T | Human | Esophagus | ESCC | 6.62e-05 | 8.81e-01 | 0.068 |
| 85028 | SNHG12 | LZE24T | Human | Esophagus | ESCC | 4.22e-28 | 1.20e+00 | 0.0596 |
| 85028 | SNHG12 | LZE21T | Human | Esophagus | ESCC | 4.49e-04 | 6.53e-01 | 0.0655 |
| 85028 | SNHG12 | LZE6T | Human | Esophagus | ESCC | 1.10e-08 | 5.38e-01 | 0.0845 |
| 85028 | SNHG12 | P1T-E | Human | Esophagus | ESCC | 1.98e-21 | 1.17e+00 | 0.0875 |
| 85028 | SNHG12 | P2T-E | Human | Esophagus | ESCC | 1.86e-60 | 1.42e+00 | 0.1177 |
| Page: 1 2 3 4 5 6 |
| Tissue | Expression Dynamics | Abbreviation |
| Cervix |  | CC: Cervix cancer |
| HSIL_HPV: HPV-infected high-grade squamous intraepithelial lesions | ||
| N_HPV: HPV-infected normal cervix | ||
| Esophagus | 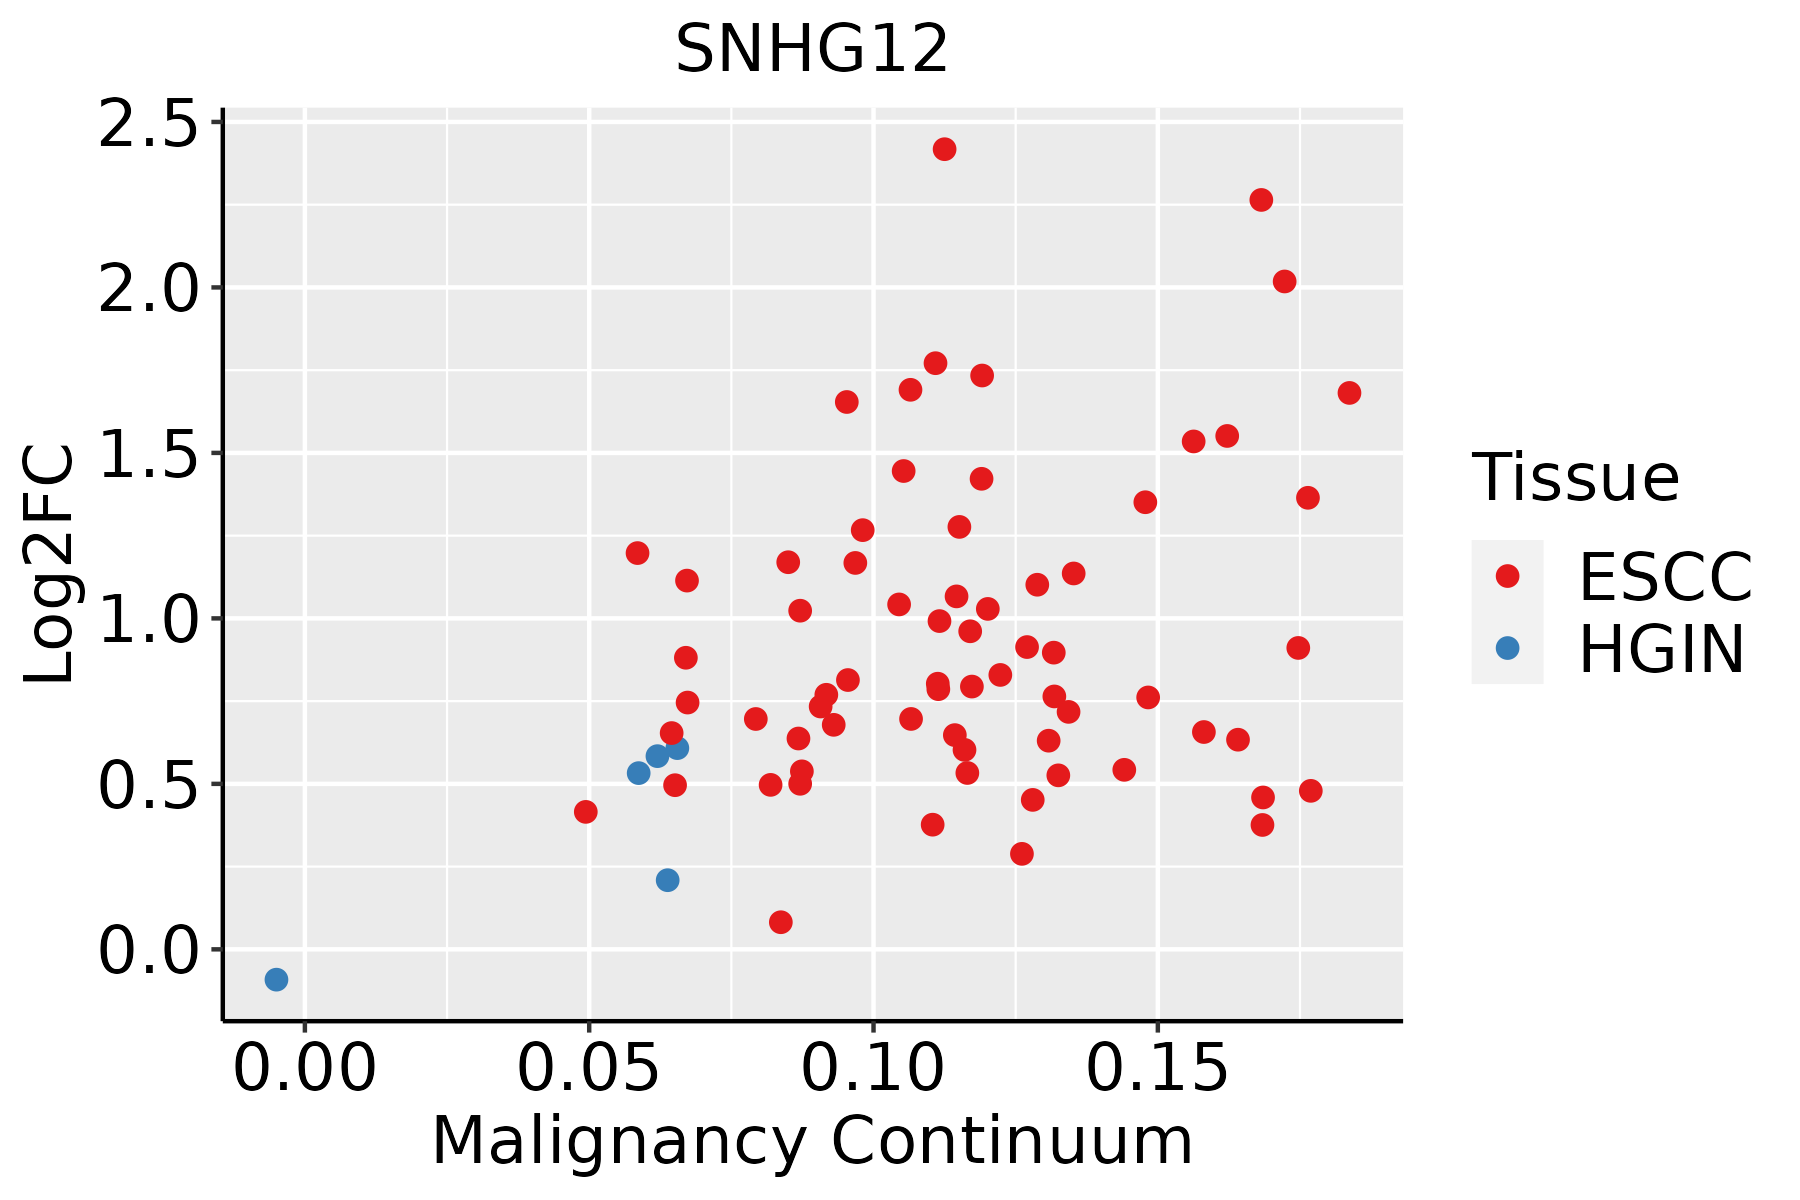 | ESCC: Esophageal squamous cell carcinoma |
| HGIN: High-grade intraepithelial neoplasias | ||
| LGIN: Low-grade intraepithelial neoplasias | ||
| Liver |  | HCC: Hepatocellular carcinoma |
| NAFLD: Non-alcoholic fatty liver disease | ||
| Oral Cavity |  | EOLP: Erosive Oral lichen planus |
| LP: leukoplakia | ||
| NEOLP: Non-erosive oral lichen planus | ||
| OSCC: Oral squamous cell carcinoma | ||
| Prostate | 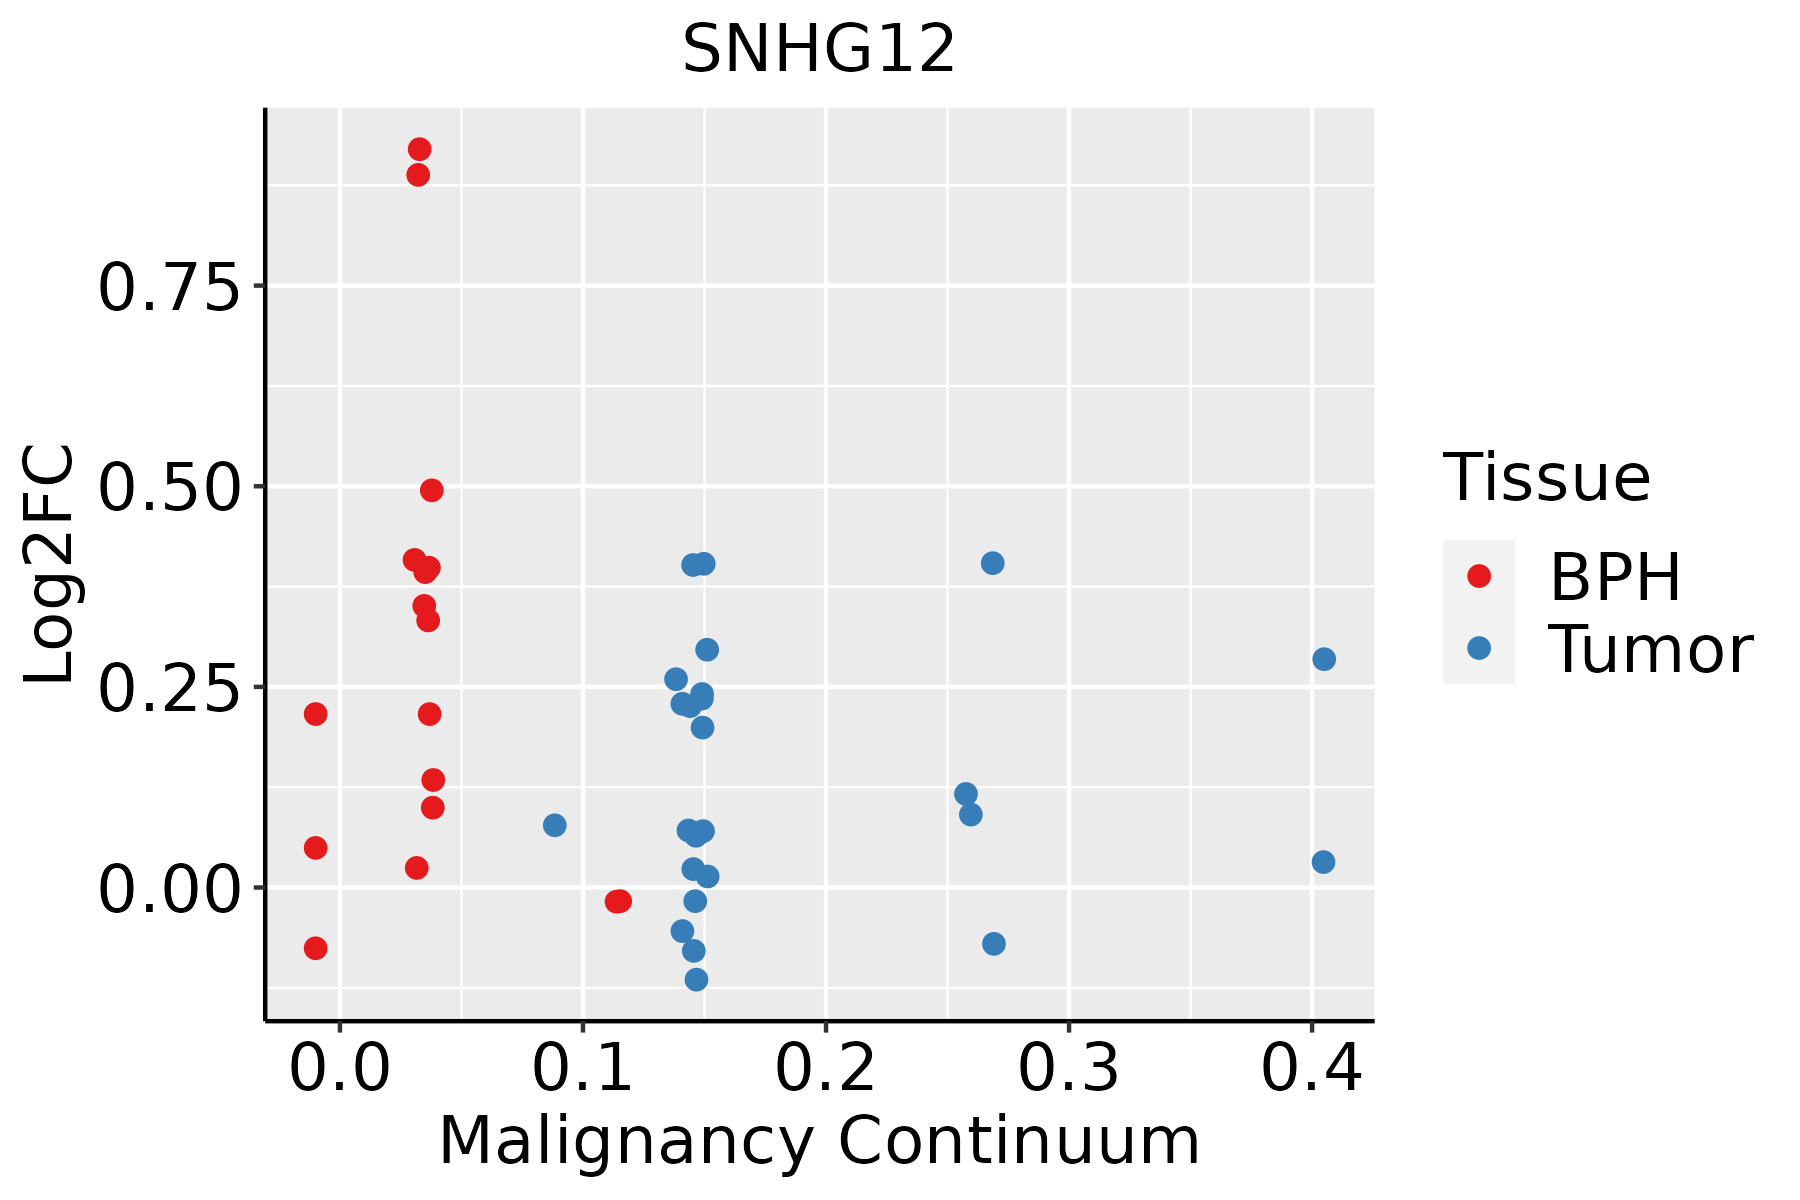 | BPH: Benign Prostatic Hyperplasia |
| Skin | 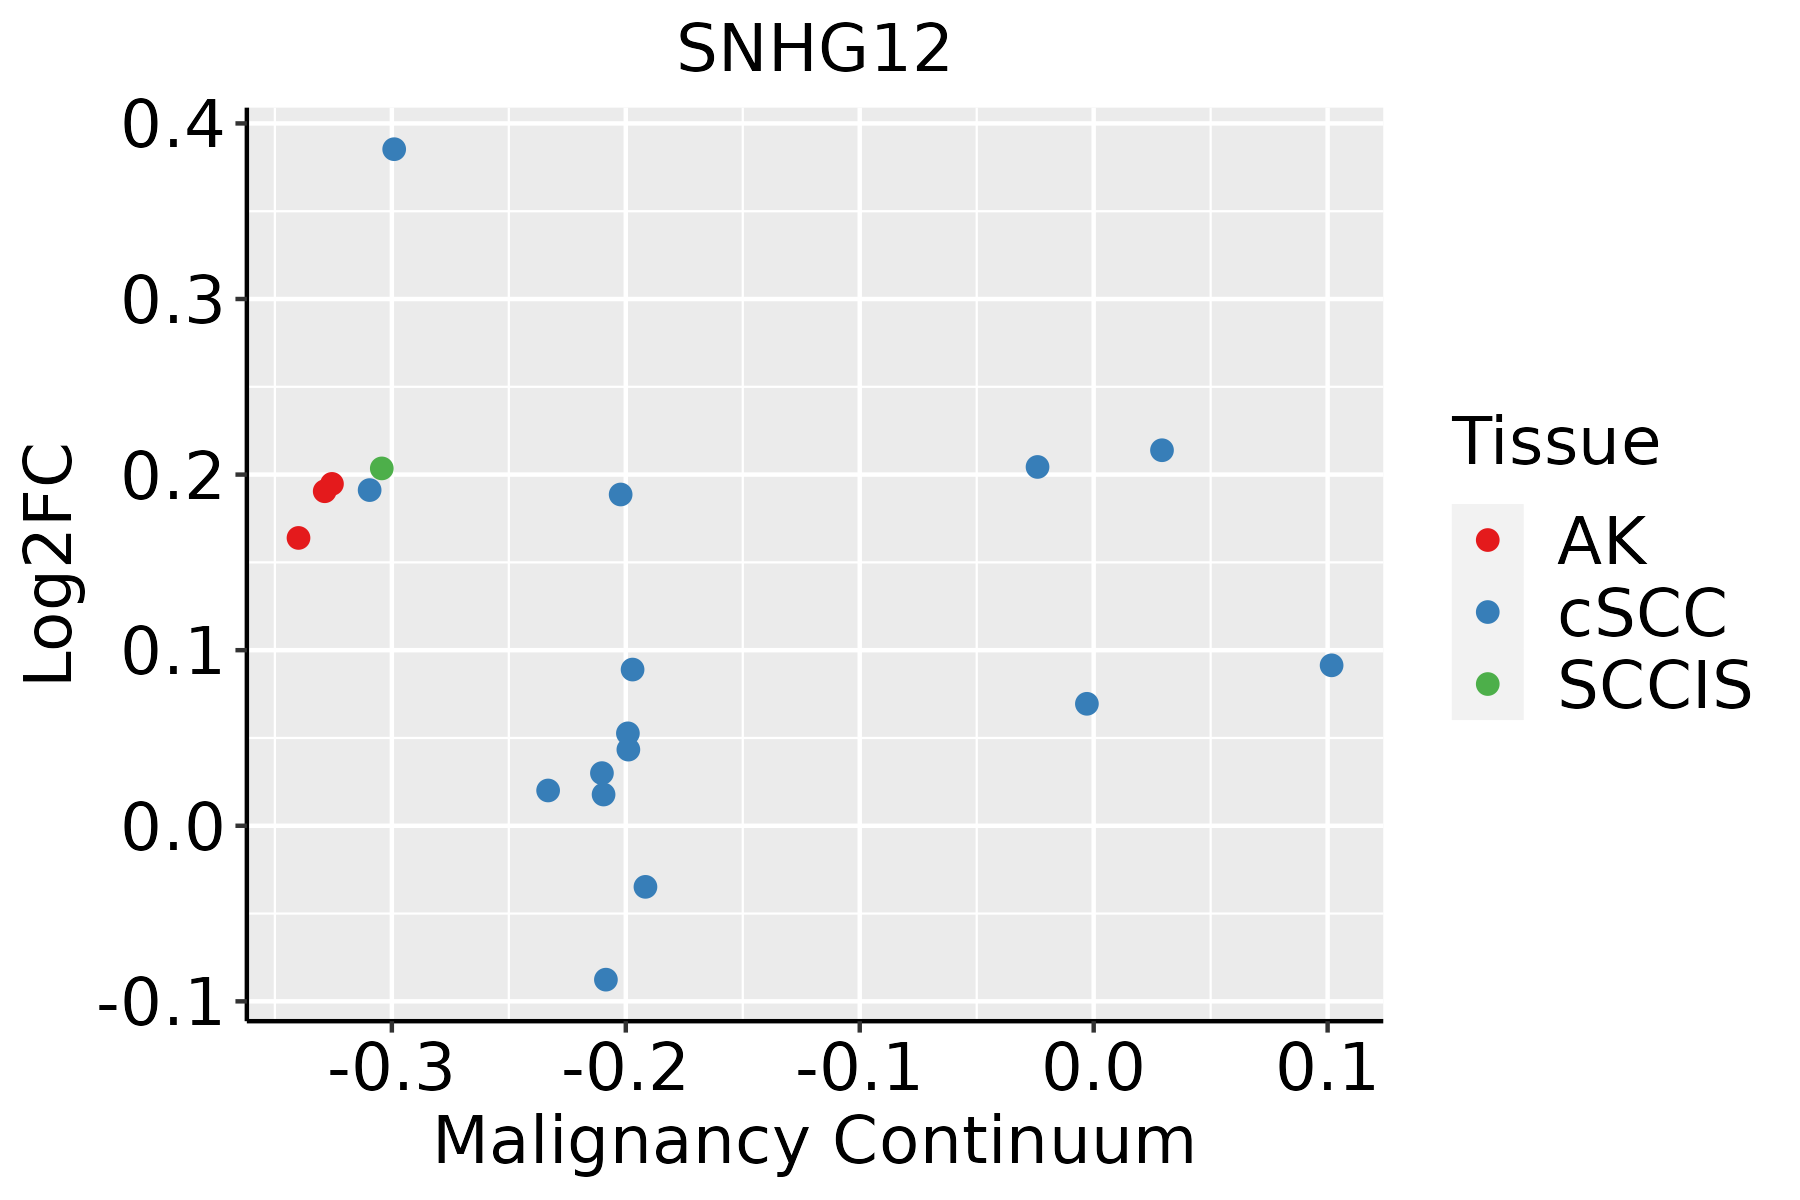 | AK: Actinic keratosis |
| cSCC: Cutaneous squamous cell carcinoma | ||
| SCCIS:squamous cell carcinoma in situ |
| ∗log2FC in expression of this searched gene in stem-like cells from each diseased tissue sample relative to stem-like cells in normal samples in each tissue plotted against the malignancy continuum. Samples are colored based on if they are from different disease stage. |
Top |
Malignant transformation related pathway analysis |
| Find out the enriched GO biological processes and KEGG pathways involved in transition from healthy to precancer to cancer |
| Tissue | Disease Stage | Enriched GO biological Processes |
| Oral cavity | OSCC |  |
| Oral cavity | LP |  |
| Oral cavity | EOLP |  |
| Oral cavity | NEOLP |  |
| Esophagus | HGIN |  |
| ∗Top 15 enriched GO BP terms are showed in the bar plot of each disease state in each tissue. Each row represents a significant GO biological process which is colored according to the -log10(p.adjust). |
| Page: 1 2 3 4 5 6 7 8 9 |
| GO ID | Tissue | Disease Stage | Description | Gene Ratio | Bg Ratio | pvalue | p.adjust | Count |
| Page: 1 |
| Pathway ID | Tissue | Disease Stage | Description | Gene Ratio | Bg Ratio | pvalue | p.adjust | qvalue | Count |
| Page: 1 |
Top |
Cell-cell communication analysis |
| Identification of potential cell-cell interactions between two cell types and their ligand-receptor pairs for different disease states |
| Ligand | Receptor | LRpair | Pathway | Tissue | Disease Stage |
| Page: 1 |
Top |
Single-cell gene regulatory network inference analysis |
| Find out the significant the regulons (TFs) and the target genes of each regulon across cell types for different disease states |
| TF | Cell Type | Tissue | Disease Stage | Target Gene | RSS | Regulon Activity |
| ∗The dot plots of a searched regulon are shown for all cell subpopulations in each disease state of each tissue based on the regulon specific score inferred using pySCENIC and by calculating the average expression. |
| Page: 1 |
Top |
Somatic mutation of malignant transformation related genes |
| Annotation of somatic variants for genes involved in malignant transformation |
| Hugo Symbol | Variant Class | Variant Classification | dbSNP RS | HGVSc | HGVSp | HGVSp Short | SWISSPROT | BIOTYPE | SIFT | PolyPhen | Tumor Sample Barcode | Tissue | Histology | Sex | Age | Stage | Therapy Types | Drugs | Outcome |
| Page: 1 |
Top |
Related drugs of malignant transformation related genes |
| Identification of chemicals and drugs interact with genes involved in malignant transfromation |
| (DGIdb 4.0) |
| Entrez ID | Symbol | Category | Interaction Types | Drug Claim Name | Drug Name | PMIDs |
| Page: 1 |

Copyright 2023-Present -The University of Texas Health Science Center at Houston |