
|
|||||
|
 | |
| |
| |
| |
| |
| |
|
Gene: RNR2 |
Gene summary for RNR2 |
| Gene information | Species | Human | Gene symbol | RNR2 | Gene ID | 4550 |
| Gene name | l-rRNA | |
| Gene Alias | MTRNR2 | |
| Cytomap | NA | |
| Gene Type | rRNA | GO ID | NA | UniProtAcc | NA |
Top |
Malignant transformation analysis |
| Identification of the aberrant gene expression in precancerous and cancerous lesions by comparing the gene expression of stem-like cells in diseased tissues with normal stem cells |
| Entrez ID | Symbol | Replicates | Species | Organ | Tissue | Adj P-value | Log2FC | Malignancy |
| 4550 | RNR2 | HCC1 | Human | Liver | HCC | 9.00e-75 | 1.44e+01 | 0.5336 |
| 4550 | RNR2 | HCC2 | Human | Liver | HCC | 9.34e-91 | 1.41e+01 | 0.5341 |
| 4550 | RNR2 | HCC5 | Human | Liver | HCC | 1.24e-112 | 1.52e+01 | 0.4932 |
| Page: 1 |
| Tissue | Expression Dynamics | Abbreviation |
| Liver | 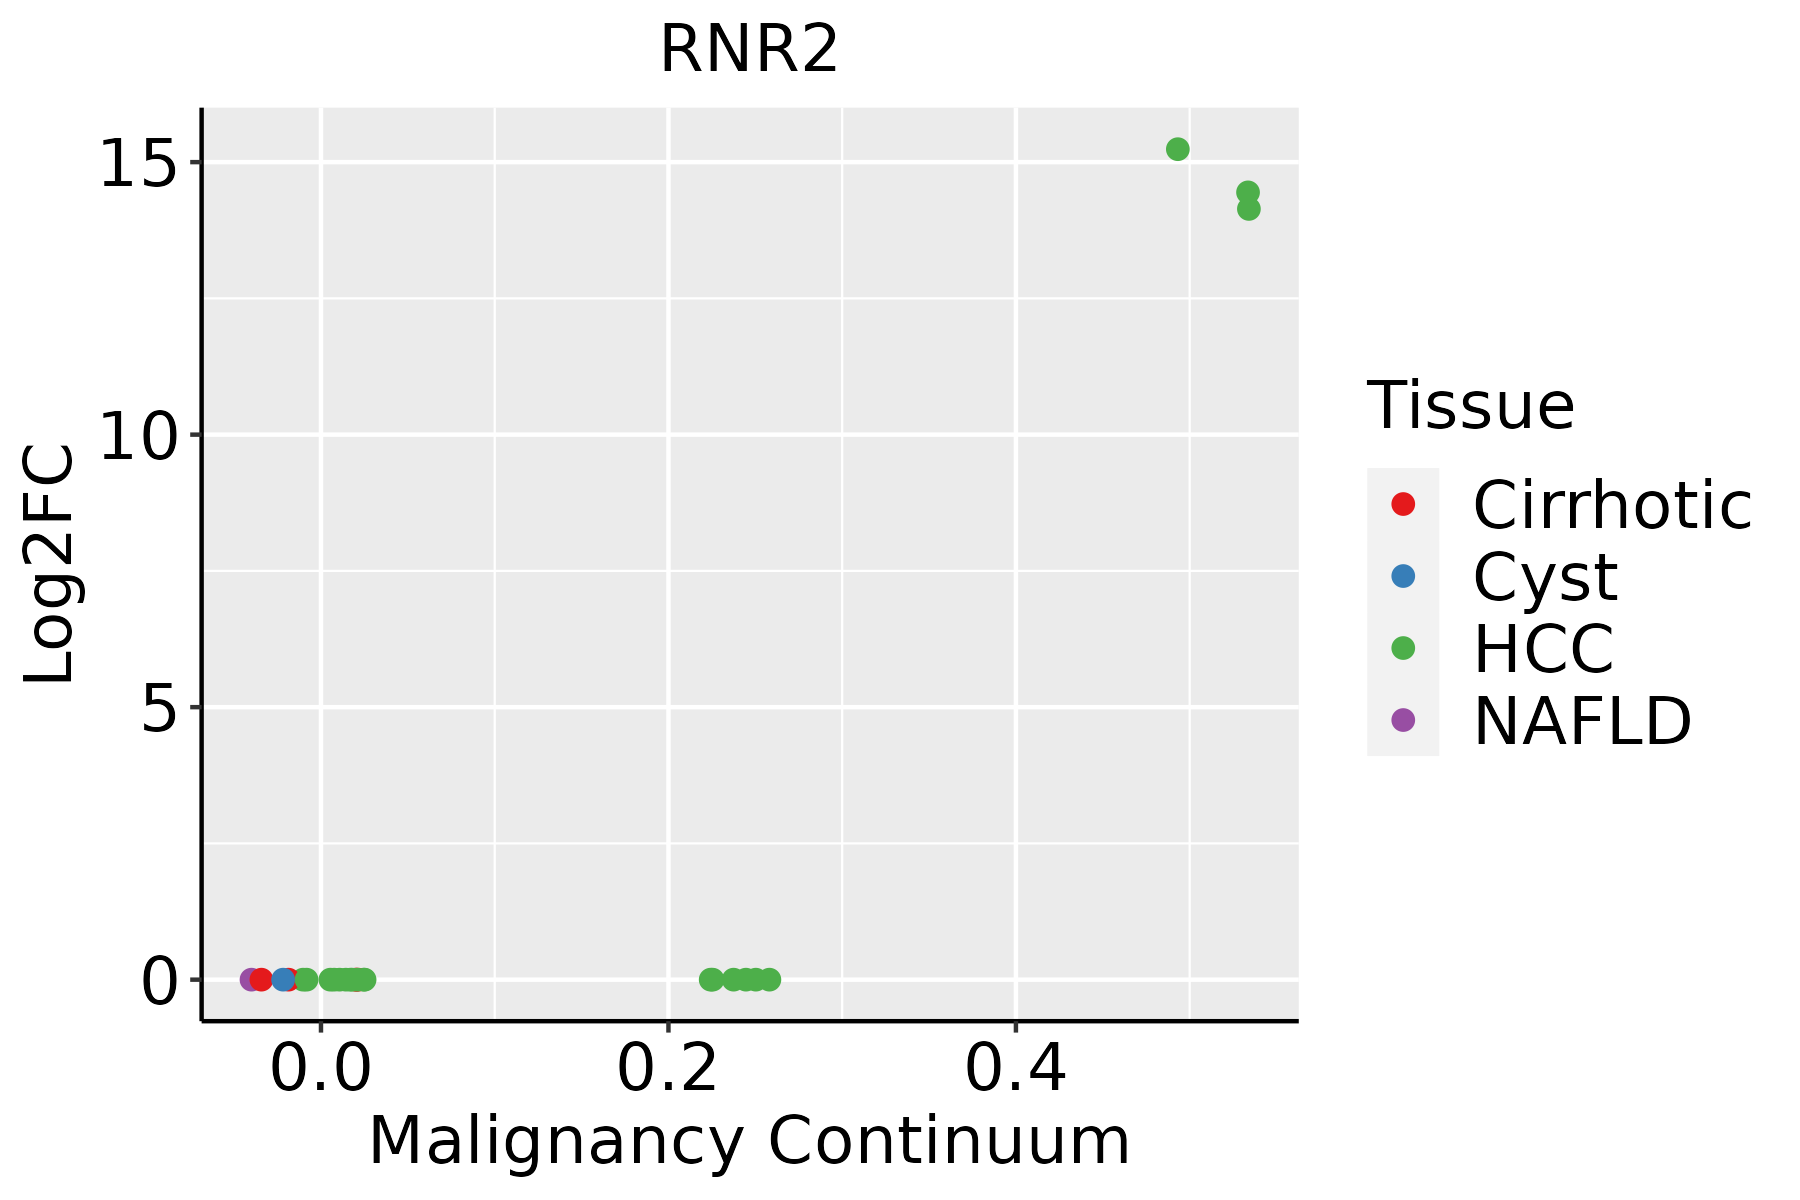 | HCC: Hepatocellular carcinoma |
| NAFLD: Non-alcoholic fatty liver disease |
| ∗log2FC in expression of this searched gene in stem-like cells from each diseased tissue sample relative to stem-like cells in normal samples in each tissue plotted against the malignancy continuum. Samples are colored based on if they are from different disease stage. |
Top |
Malignant transformation related pathway analysis |
| Find out the enriched GO biological processes and KEGG pathways involved in transition from healthy to precancer to cancer |
| Tissue | Disease Stage | Enriched GO biological Processes |
| Oral cavity | OSCC |  |
| Oral cavity | LP |  |
| Oral cavity | EOLP |  |
| Oral cavity | NEOLP |  |
| Esophagus | HGIN |  |
| ∗Top 15 enriched GO BP terms are showed in the bar plot of each disease state in each tissue. Each row represents a significant GO biological process which is colored according to the -log10(p.adjust). |
| Page: 1 2 3 4 5 6 7 8 9 |
| GO ID | Tissue | Disease Stage | Description | Gene Ratio | Bg Ratio | pvalue | p.adjust | Count |
| GO:000683912 | Liver | HCC | mitochondrial transport | 184/7958 | 254/18723 | 2.30e-22 | 3.83e-20 | 184 |
| GO:000700612 | Liver | HCC | mitochondrial membrane organization | 80/7958 | 116/18723 | 7.09e-09 | 1.81e-07 | 80 |
| GO:000863712 | Liver | HCC | apoptotic mitochondrial changes | 70/7958 | 107/18723 | 1.39e-06 | 2.01e-05 | 70 |
| GO:009055912 | Liver | HCC | regulation of membrane permeability | 47/7958 | 78/18723 | 1.17e-03 | 6.54e-03 | 47 |
| GO:004690212 | Liver | HCC | regulation of mitochondrial membrane permeability | 39/7958 | 63/18723 | 1.47e-03 | 7.80e-03 | 39 |
| GO:190210811 | Liver | HCC | regulation of mitochondrial membrane permeability involved in apoptotic process | 28/7958 | 45/18723 | 5.99e-03 | 2.45e-02 | 28 |
| GO:0097194 | Liver | HCC | execution phase of apoptosis | 48/7958 | 85/18723 | 6.47e-03 | 2.63e-02 | 48 |
| GO:00432791 | Liver | HCC | response to alkaloid | 62/7958 | 115/18723 | 8.79e-03 | 3.42e-02 | 62 |
| GO:1900117 | Liver | HCC | regulation of execution phase of apoptosis | 19/7958 | 29/18723 | 1.05e-02 | 3.89e-02 | 19 |
| Page: 1 |
| Pathway ID | Tissue | Disease Stage | Description | Gene Ratio | Bg Ratio | pvalue | p.adjust | qvalue | Count |
| Page: 1 |
Top |
Cell-cell communication analysis |
| Identification of potential cell-cell interactions between two cell types and their ligand-receptor pairs for different disease states |
| Ligand | Receptor | LRpair | Pathway | Tissue | Disease Stage |
| Page: 1 |
Top |
Single-cell gene regulatory network inference analysis |
| Find out the significant the regulons (TFs) and the target genes of each regulon across cell types for different disease states |
| TF | Cell Type | Tissue | Disease Stage | Target Gene | RSS | Regulon Activity |
| ∗The dot plots of a searched regulon are shown for all cell subpopulations in each disease state of each tissue based on the regulon specific score inferred using pySCENIC and by calculating the average expression. |
| Page: 1 |
Top |
Somatic mutation of malignant transformation related genes |
| Annotation of somatic variants for genes involved in malignant transformation |
| Hugo Symbol | Variant Class | Variant Classification | dbSNP RS | HGVSc | HGVSp | HGVSp Short | SWISSPROT | BIOTYPE | SIFT | PolyPhen | Tumor Sample Barcode | Tissue | Histology | Sex | Age | Stage | Therapy Types | Drugs | Outcome |
| Page: 1 |
Top |
Related drugs of malignant transformation related genes |
| Identification of chemicals and drugs interact with genes involved in malignant transfromation |
| (DGIdb 4.0) |
| Entrez ID | Symbol | Category | Interaction Types | Drug Claim Name | Drug Name | PMIDs |
| Page: 1 |

Copyright 2023-Present -The University of Texas Health Science Center at Houston |