
|
|||||
|
 | |
| |
| |
| |
| |
| |
|
Gene: MUCL3 |
Gene summary for MUCL3 |
| Gene information | Species | Human | Gene symbol | MUCL3 | Gene ID | 135656 |
| Gene name | mucin like 3 | |
| Gene Alias | C6orf37 | |
| Cytomap | 6p21.33 | |
| Gene Type | protein-coding | GO ID | GO:0008150 | UniProtAcc | E9PEI6 |
Top |
Malignant transformation analysis |
| Identification of the aberrant gene expression in precancerous and cancerous lesions by comparing the gene expression of stem-like cells in diseased tissues with normal stem cells |
| Entrez ID | Symbol | Replicates | Species | Organ | Tissue | Adj P-value | Log2FC | Malignancy |
| 135656 | MUCL3 | HTA12-9-1 | Human | Pancreas | PDAC | 7.67e-32 | 1.33e+00 | 0.1532 |
| 135656 | MUCL3 | HTA12-9-2 | Human | Pancreas | PDAC | 8.35e-19 | 9.19e-01 | 0.0835 |
| 135656 | MUCL3 | HTA12-9-3 | Human | Pancreas | PDAC | 4.13e-07 | 8.35e-01 | 0.2045 |
| 135656 | MUCL3 | Pat02-B | Human | Stomach | GC | 4.40e-40 | 8.50e-01 | 0.0368 |
| 135656 | MUCL3 | Pat03-B | Human | Stomach | GC | 8.68e-03 | 1.50e-01 | 0.3693 |
| 135656 | MUCL3 | Pat04-B | Human | Stomach | GC | 4.50e-11 | 4.52e-01 | -0.1483 |
| 135656 | MUCL3 | Pat05-B | Human | Stomach | GC | 3.80e-07 | 4.15e-01 | -0.0353 |
| 135656 | MUCL3 | Pat06-B | Human | Stomach | GC | 6.82e-16 | 4.35e-01 | -0.1961 |
| 135656 | MUCL3 | Pat08-B | Human | Stomach | GC | 1.69e-02 | 2.41e-01 | 0.0182 |
| 135656 | MUCL3 | Pat10-B | Human | Stomach | GC | 3.96e-13 | 7.57e-01 | 0.084 |
| 135656 | MUCL3 | Pat11-B | Human | Stomach | GC | 3.11e-20 | 7.14e-01 | -0.182 |
| 135656 | MUCL3 | Pat12-B | Human | Stomach | GC | 2.83e-21 | 6.03e-01 | 0.0325 |
| 135656 | MUCL3 | Pat13-B | Human | Stomach | GC | 1.86e-06 | 3.19e-01 | 0.0555 |
| 135656 | MUCL3 | Pat15-B | Human | Stomach | GC | 8.28e-07 | 3.06e-01 | -0.0778 |
| 135656 | MUCL3 | Pat17-B | Human | Stomach | GC | 8.72e-11 | 4.04e-01 | 0.3109 |
| 135656 | MUCL3 | Pat18-B | Human | Stomach | GC | 1.35e-32 | 9.94e-01 | -0.0432 |
| 135656 | MUCL3 | Pat19-B | Human | Stomach | GC | 3.53e-05 | 2.76e-01 | 0.0826 |
| 135656 | MUCL3 | Pat22-B | Human | Stomach | GC | 5.41e-45 | 1.05e+00 | -0.1042 |
| 135656 | MUCL3 | Pat24-B | Human | Stomach | GC | 1.16e-20 | 8.03e-01 | -0.1184 |
| 135656 | MUCL3 | Pat25-A | Human | Stomach | CAG with IM | 2.02e-07 | 2.14e-01 | -0.1648 |
| Page: 1 2 |
| Tissue | Expression Dynamics | Abbreviation |
| GC | 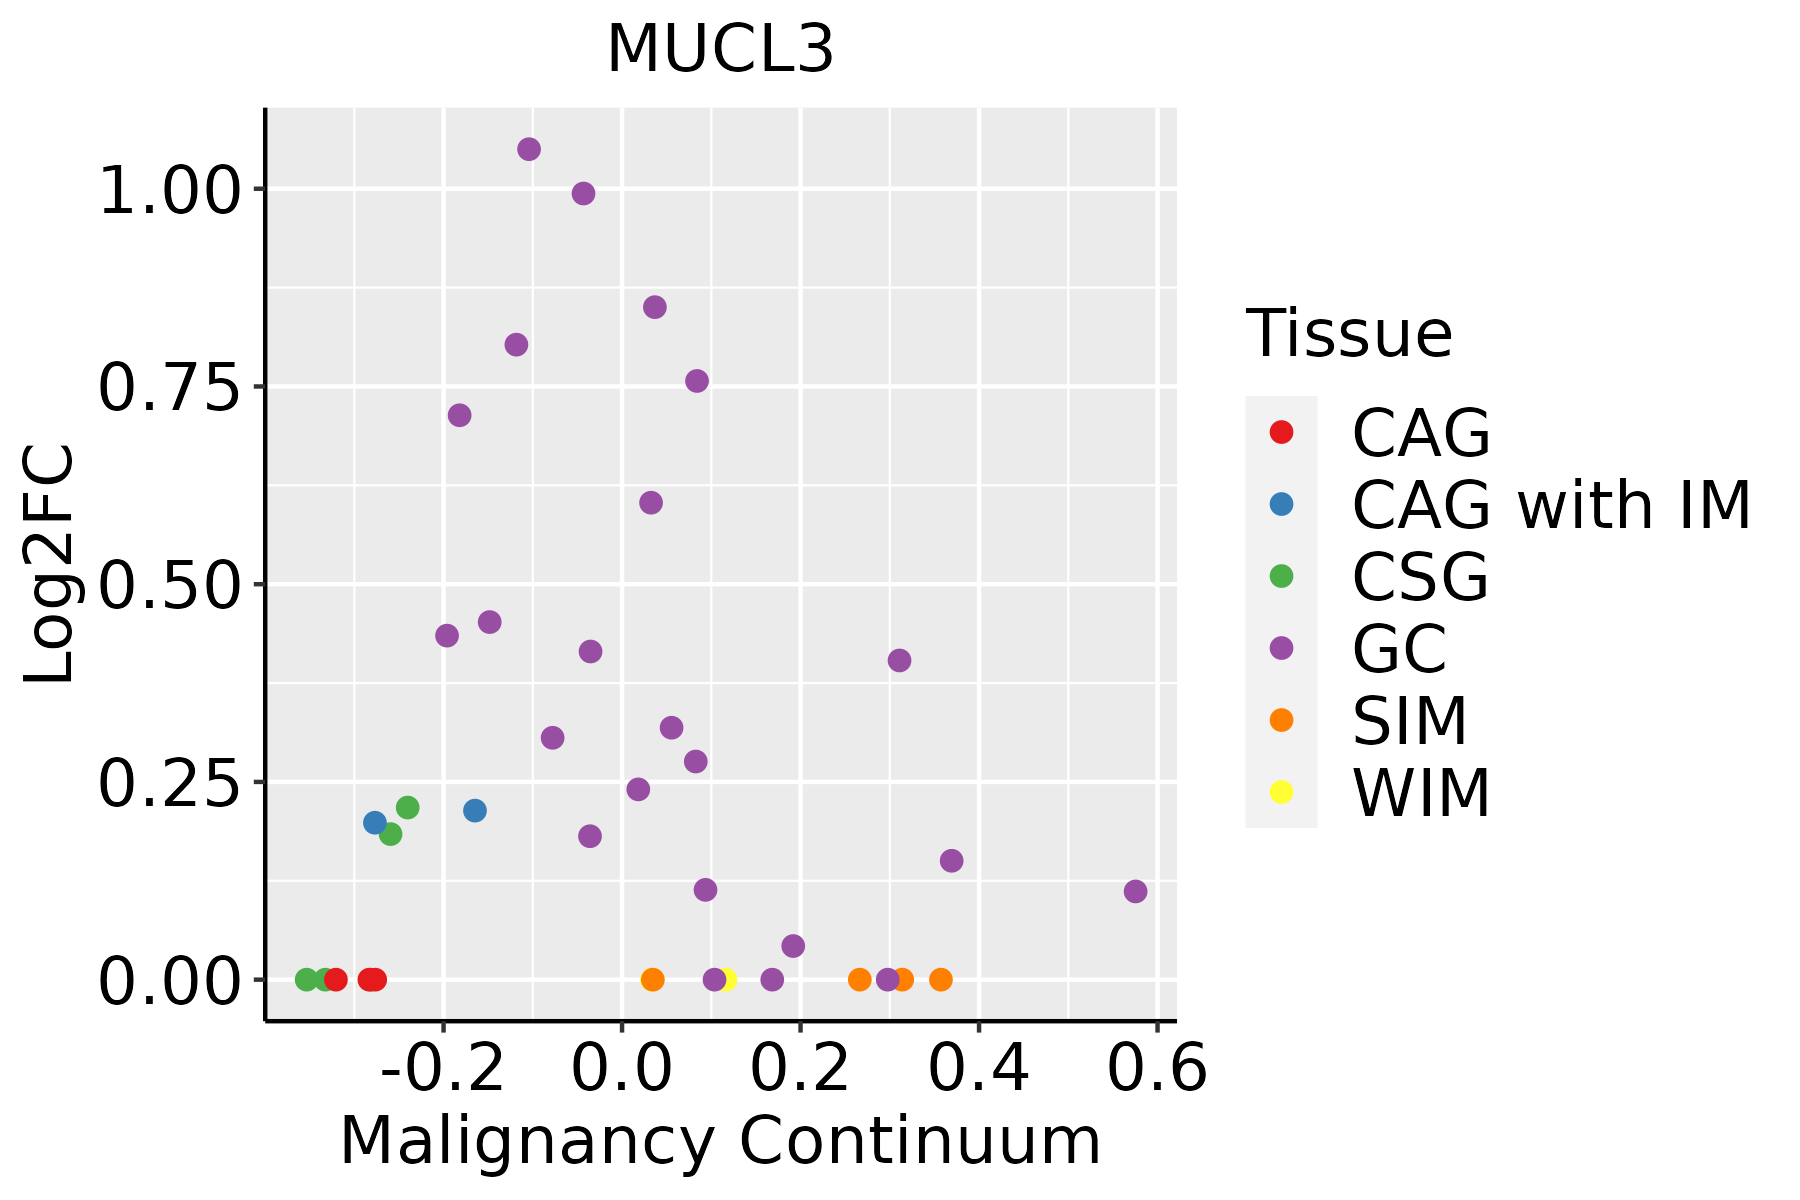 | CAG: Chronic atrophic gastritis |
| CAG with IM: Chronic atrophic gastritis with intestinal metaplasia | ||
| CSG: Chronic superficial gastritis | ||
| GC: Gastric cancer | ||
| SIM: Severe intestinal metaplasia | ||
| WIM: Wild intestinal metaplasia |
| ∗log2FC in expression of this searched gene in stem-like cells from each diseased tissue sample relative to stem-like cells in normal samples in each tissue plotted against the malignancy continuum. Samples are colored based on if they are from different disease stage. |
Top |
Malignant transformation related pathway analysis |
| Find out the enriched GO biological processes and KEGG pathways involved in transition from healthy to precancer to cancer |
| Tissue | Disease Stage | Enriched GO biological Processes |
| Oral cavity | OSCC |  |
| Oral cavity | LP |  |
| Oral cavity | EOLP |  |
| Oral cavity | NEOLP |  |
| Esophagus | HGIN |  |
| ∗Top 15 enriched GO BP terms are showed in the bar plot of each disease state in each tissue. Each row represents a significant GO biological process which is colored according to the -log10(p.adjust). |
| Page: 1 2 3 4 5 6 7 8 9 |
| GO ID | Tissue | Disease Stage | Description | Gene Ratio | Bg Ratio | pvalue | p.adjust | Count |
| Page: 1 |
| Pathway ID | Tissue | Disease Stage | Description | Gene Ratio | Bg Ratio | pvalue | p.adjust | qvalue | Count |
| Page: 1 |
Top |
Cell-cell communication analysis |
| Identification of potential cell-cell interactions between two cell types and their ligand-receptor pairs for different disease states |
| Ligand | Receptor | LRpair | Pathway | Tissue | Disease Stage |
| Page: 1 |
Top |
Single-cell gene regulatory network inference analysis |
| Find out the significant the regulons (TFs) and the target genes of each regulon across cell types for different disease states |
| TF | Cell Type | Tissue | Disease Stage | Target Gene | RSS | Regulon Activity |
| ∗The dot plots of a searched regulon are shown for all cell subpopulations in each disease state of each tissue based on the regulon specific score inferred using pySCENIC and by calculating the average expression. |
| Page: 1 |
Top |
Somatic mutation of malignant transformation related genes |
| Annotation of somatic variants for genes involved in malignant transformation |
| Hugo Symbol | Variant Class | Variant Classification | dbSNP RS | HGVSc | HGVSp | HGVSp Short | SWISSPROT | BIOTYPE | SIFT | PolyPhen | Tumor Sample Barcode | Tissue | Histology | Sex | Age | Stage | Therapy Types | Drugs | Outcome |
| Page: 1 |
Top |
Related drugs of malignant transformation related genes |
| Identification of chemicals and drugs interact with genes involved in malignant transfromation |
| (DGIdb 4.0) |
| Entrez ID | Symbol | Category | Interaction Types | Drug Claim Name | Drug Name | PMIDs |
| 135656 | MUCL3 | NA | gemcitabine | GEMCITABINE | 31616045 | |
| 135656 | MUCL3 | NA | carboplatin | CARBOPLATIN | 31616045 |
| Page: 1 |

Copyright 2023-Present -The University of Texas Health Science Center at Houston |