
|
|||||
|
 | |
| |
| |
| |
| |
| |
|
Gene: MRPL23 |
Gene summary for MRPL23 |
| Gene information | Species | Human | Gene symbol | MRPL23 | Gene ID | 6150 |
| Gene name | mitochondrial ribosomal protein L23 | |
| Gene Alias | L23MRP | |
| Cytomap | 11p15.5 | |
| Gene Type | protein-coding | GO ID | GO:0006412 | UniProtAcc | A0A024RCB2 |
Top |
Malignant transformation analysis |
| Identification of the aberrant gene expression in precancerous and cancerous lesions by comparing the gene expression of stem-like cells in diseased tissues with normal stem cells |
| Entrez ID | Symbol | Replicates | Species | Organ | Tissue | Adj P-value | Log2FC | Malignancy |
| 6150 | MRPL23 | LZE22T | Human | Esophagus | ESCC | 1.04e-02 | 2.53e-01 | 0.068 |
| 6150 | MRPL23 | LZE24T | Human | Esophagus | ESCC | 3.95e-21 | 5.49e-01 | 0.0596 |
| 6150 | MRPL23 | LZE21T | Human | Esophagus | ESCC | 1.14e-03 | 2.72e-01 | 0.0655 |
| 6150 | MRPL23 | P2T-E | Human | Esophagus | ESCC | 4.32e-06 | 1.50e-01 | 0.1177 |
| 6150 | MRPL23 | P5T-E | Human | Esophagus | ESCC | 1.84e-07 | 1.44e-01 | 0.1327 |
| 6150 | MRPL23 | P9T-E | Human | Esophagus | ESCC | 2.09e-16 | 3.40e-01 | 0.1131 |
| 6150 | MRPL23 | P10T-E | Human | Esophagus | ESCC | 1.96e-05 | 1.17e-01 | 0.116 |
| 6150 | MRPL23 | P11T-E | Human | Esophagus | ESCC | 3.33e-03 | 1.95e-01 | 0.1426 |
| 6150 | MRPL23 | P15T-E | Human | Esophagus | ESCC | 8.43e-05 | 1.59e-01 | 0.1149 |
| 6150 | MRPL23 | P16T-E | Human | Esophagus | ESCC | 2.05e-07 | 1.41e-01 | 0.1153 |
| 6150 | MRPL23 | P17T-E | Human | Esophagus | ESCC | 2.94e-18 | 6.98e-01 | 0.1278 |
| 6150 | MRPL23 | P19T-E | Human | Esophagus | ESCC | 4.65e-03 | 3.48e-01 | 0.1662 |
| 6150 | MRPL23 | P20T-E | Human | Esophagus | ESCC | 1.01e-11 | 2.86e-01 | 0.1124 |
| 6150 | MRPL23 | P21T-E | Human | Esophagus | ESCC | 8.57e-10 | 1.51e-01 | 0.1617 |
| 6150 | MRPL23 | P22T-E | Human | Esophagus | ESCC | 4.25e-10 | 1.42e-01 | 0.1236 |
| 6150 | MRPL23 | P24T-E | Human | Esophagus | ESCC | 4.44e-08 | 1.67e-01 | 0.1287 |
| 6150 | MRPL23 | P27T-E | Human | Esophagus | ESCC | 1.96e-05 | 8.87e-02 | 0.1055 |
| 6150 | MRPL23 | P30T-E | Human | Esophagus | ESCC | 6.12e-04 | 1.61e-01 | 0.137 |
| 6150 | MRPL23 | P32T-E | Human | Esophagus | ESCC | 8.33e-05 | 1.11e-01 | 0.1666 |
| 6150 | MRPL23 | P36T-E | Human | Esophagus | ESCC | 1.60e-03 | 2.00e-01 | 0.1187 |
| Page: 1 2 3 4 5 6 7 |
| Tissue | Expression Dynamics | Abbreviation |
| Esophagus | 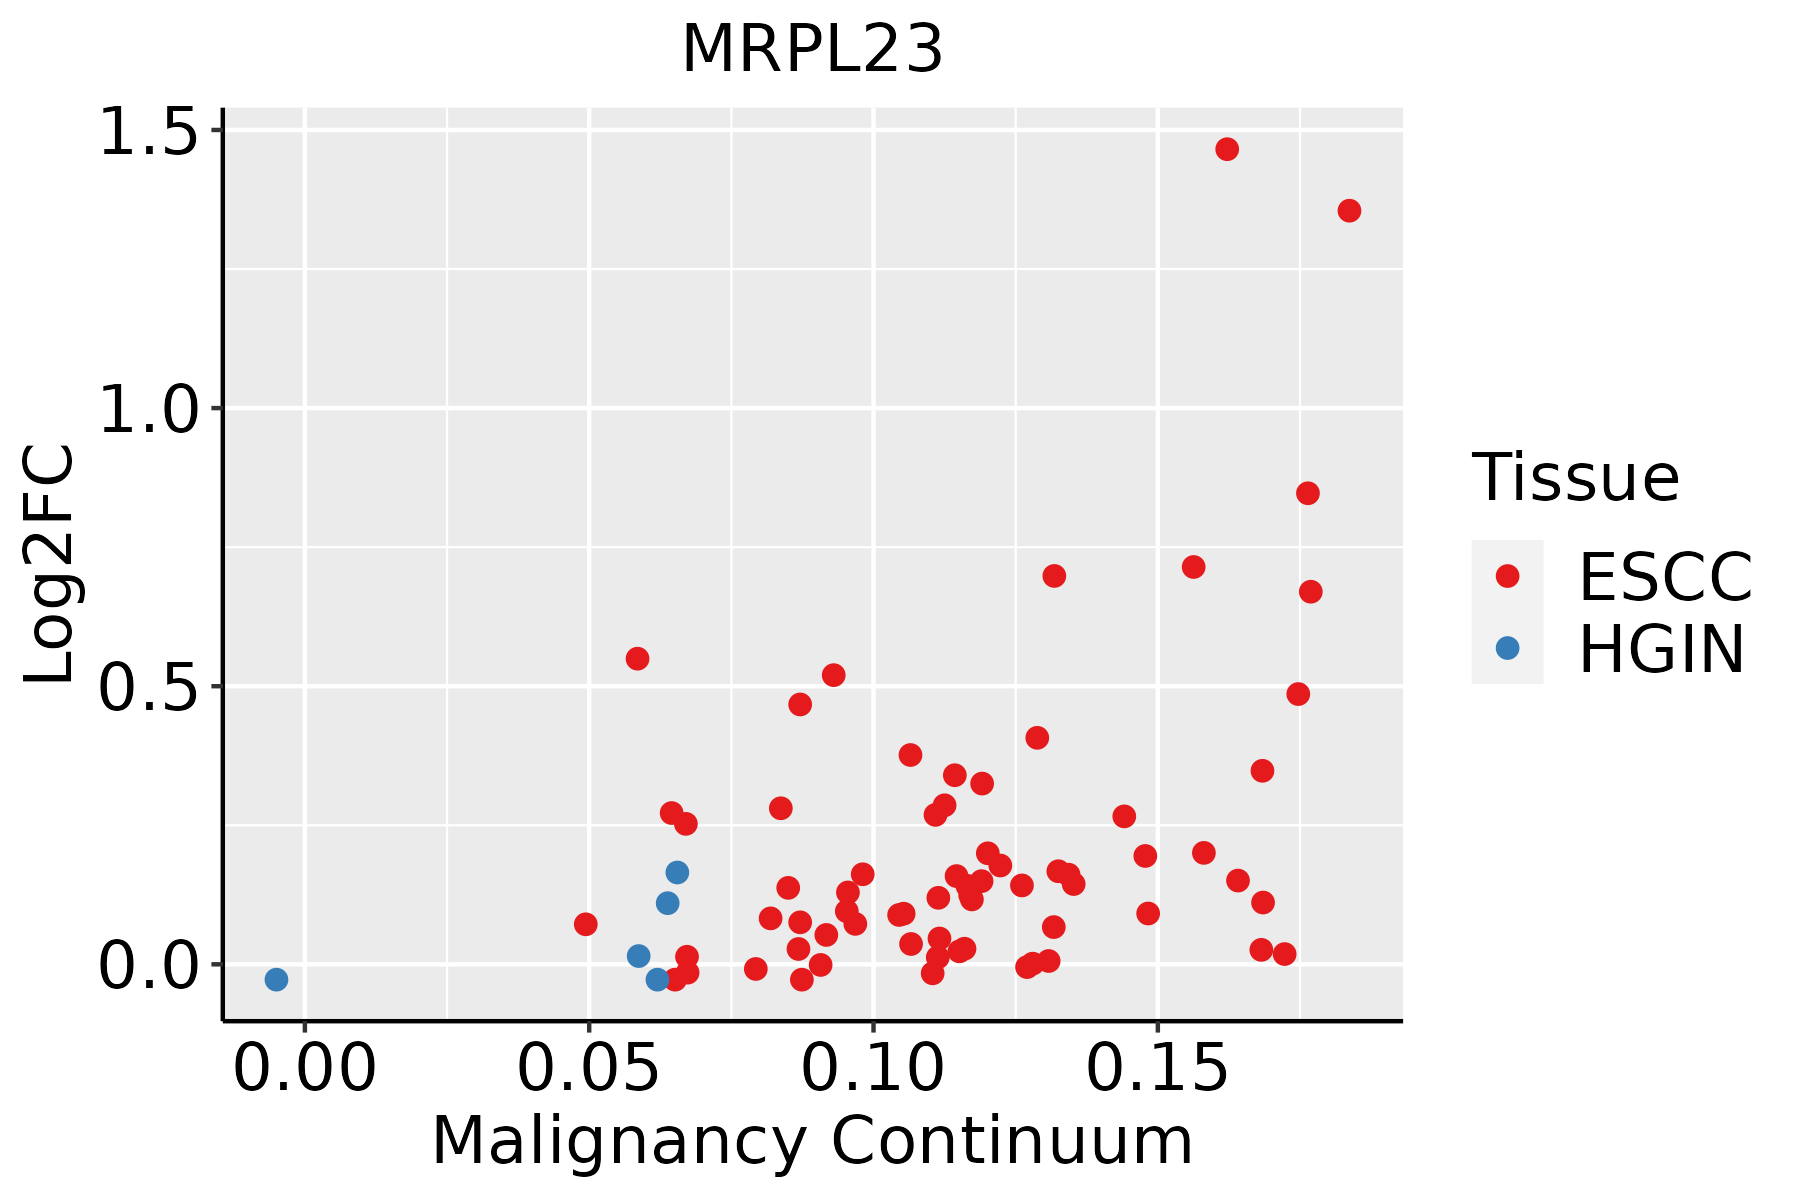 | ESCC: Esophageal squamous cell carcinoma |
| HGIN: High-grade intraepithelial neoplasias | ||
| LGIN: Low-grade intraepithelial neoplasias | ||
| GC |  | CAG: Chronic atrophic gastritis |
| CAG with IM: Chronic atrophic gastritis with intestinal metaplasia | ||
| CSG: Chronic superficial gastritis | ||
| GC: Gastric cancer | ||
| SIM: Severe intestinal metaplasia | ||
| WIM: Wild intestinal metaplasia | ||
| Liver |  | HCC: Hepatocellular carcinoma |
| NAFLD: Non-alcoholic fatty liver disease | ||
| Oral Cavity |  | EOLP: Erosive Oral lichen planus |
| LP: leukoplakia | ||
| NEOLP: Non-erosive oral lichen planus | ||
| OSCC: Oral squamous cell carcinoma | ||
| Prostate | 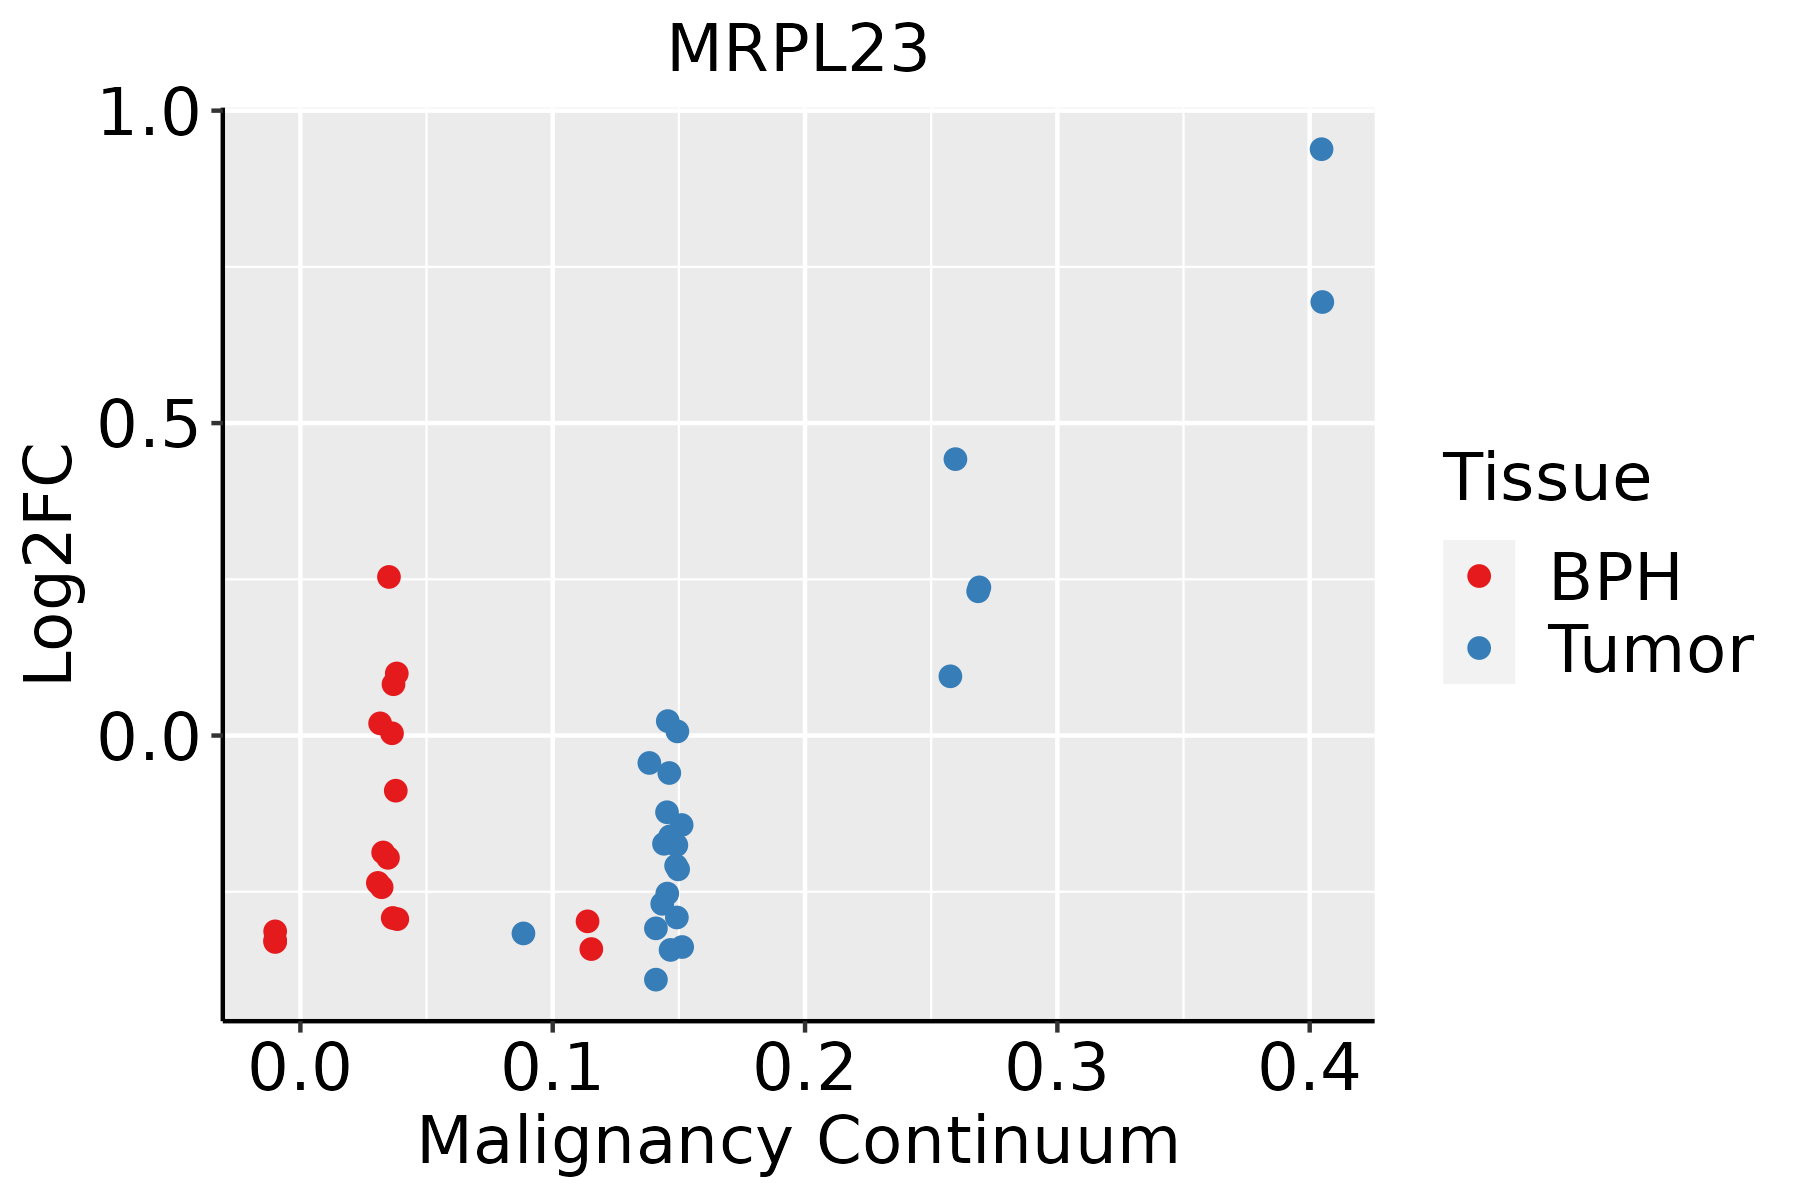 | BPH: Benign Prostatic Hyperplasia |
| Skin |  | AK: Actinic keratosis |
| cSCC: Cutaneous squamous cell carcinoma | ||
| SCCIS:squamous cell carcinoma in situ | ||
| Thyroid | 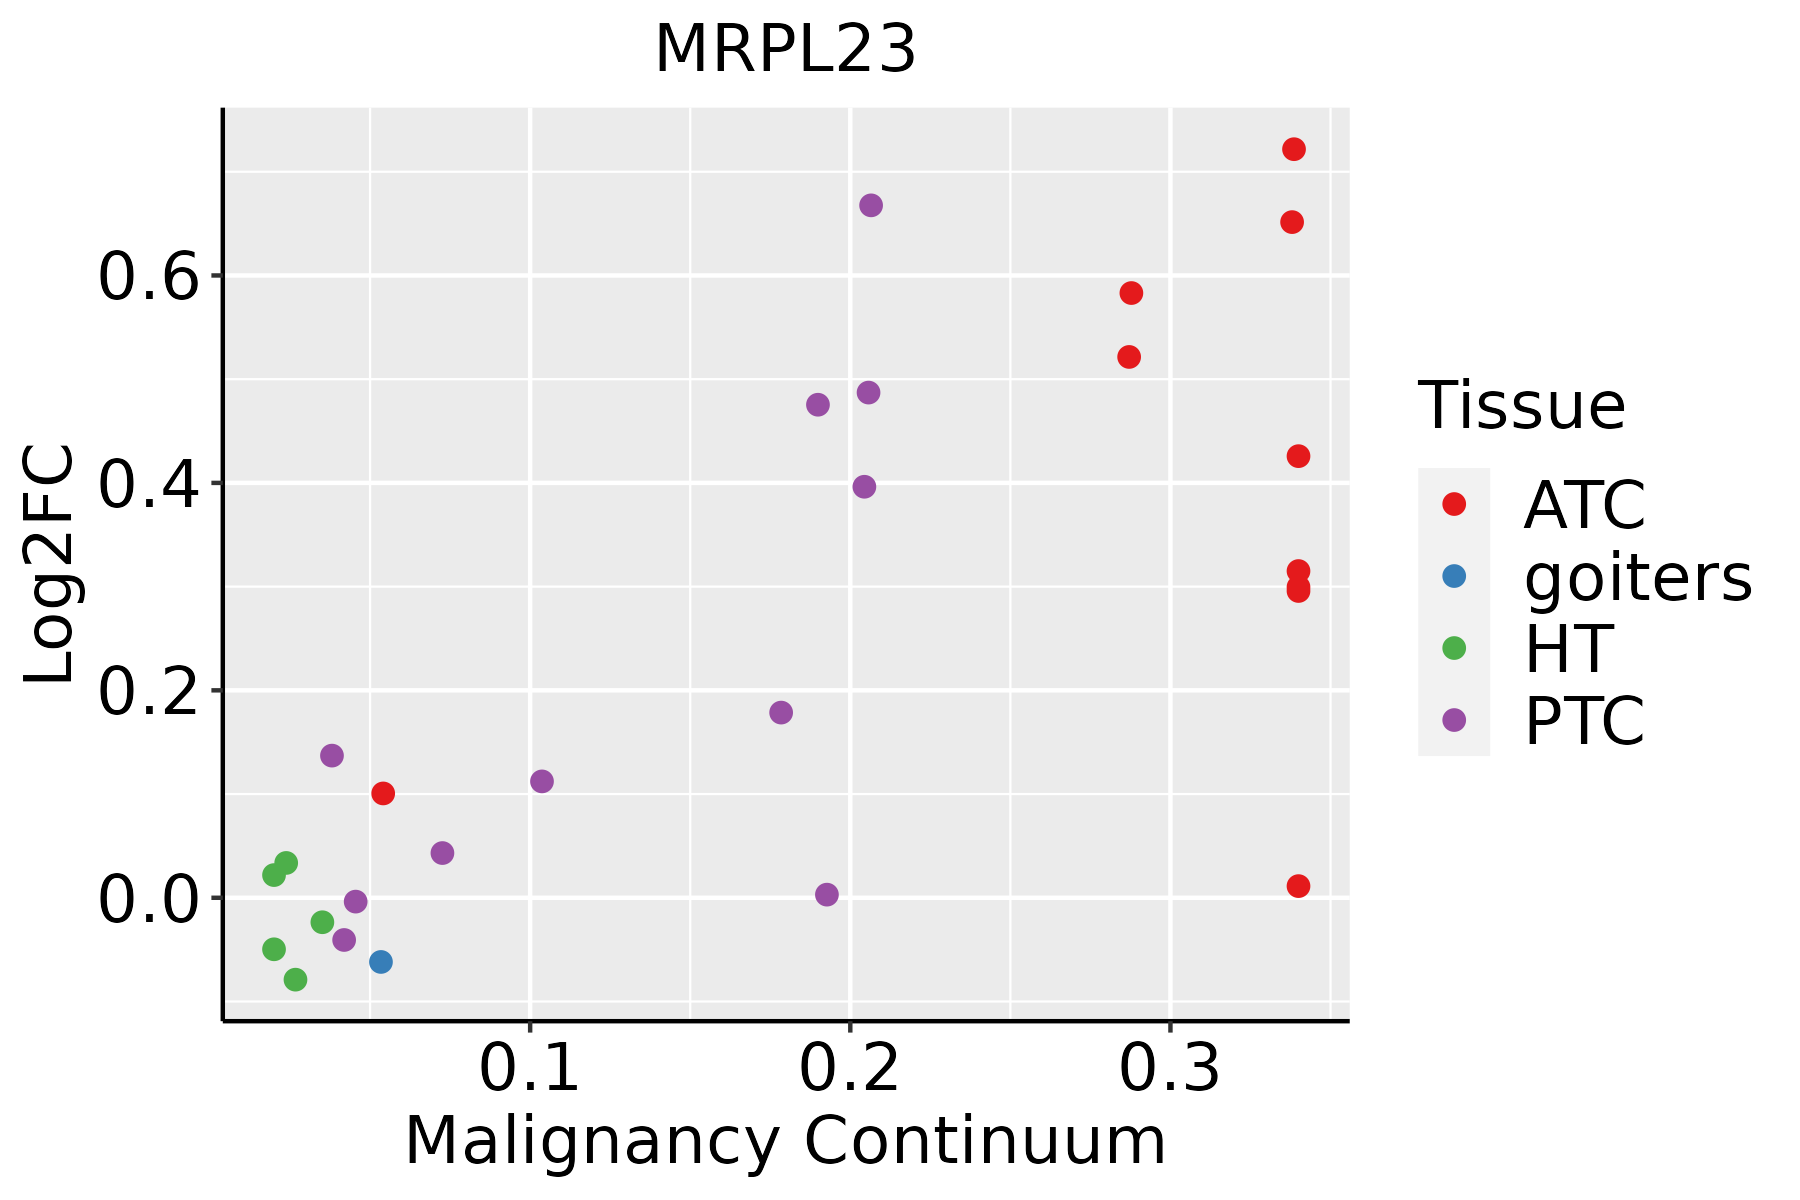 | ATC: Anaplastic thyroid cancer |
| HT: Hashimoto's thyroiditis | ||
| PTC: Papillary thyroid cancer |
| ∗log2FC in expression of this searched gene in stem-like cells from each diseased tissue sample relative to stem-like cells in normal samples in each tissue plotted against the malignancy continuum. Samples are colored based on if they are from different disease stage. |
Top |
Malignant transformation related pathway analysis |
| Find out the enriched GO biological processes and KEGG pathways involved in transition from healthy to precancer to cancer |
| Tissue | Disease Stage | Enriched GO biological Processes |
| Oral cavity | OSCC |  |
| Oral cavity | LP |  |
| Oral cavity | EOLP |  |
| Oral cavity | NEOLP |  |
| Esophagus | HGIN |  |
| ∗Top 15 enriched GO BP terms are showed in the bar plot of each disease state in each tissue. Each row represents a significant GO biological process which is colored according to the -log10(p.adjust). |
| Page: 1 2 3 4 5 6 7 8 9 |
| GO ID | Tissue | Disease Stage | Description | Gene Ratio | Bg Ratio | pvalue | p.adjust | Count |
| GO:014005313 | Esophagus | ESCC | mitochondrial gene expression | 93/8552 | 108/18723 | 1.96e-18 | 2.03e-16 | 93 |
| GO:003254314 | Esophagus | ESCC | mitochondrial translation | 68/8552 | 76/18723 | 1.02e-15 | 6.86e-14 | 68 |
| GO:0032543 | Liver | Cirrhotic | mitochondrial translation | 40/4634 | 76/18723 | 1.61e-07 | 4.29e-06 | 40 |
| GO:0140053 | Liver | Cirrhotic | mitochondrial gene expression | 49/4634 | 108/18723 | 2.35e-06 | 4.31e-05 | 49 |
| GO:01400531 | Liver | HCC | mitochondrial gene expression | 82/7958 | 108/18723 | 1.49e-12 | 7.20e-11 | 82 |
| GO:00325431 | Liver | HCC | mitochondrial translation | 62/7958 | 76/18723 | 2.95e-12 | 1.34e-10 | 62 |
| GO:01400533 | Oral cavity | OSCC | mitochondrial gene expression | 78/7305 | 108/18723 | 2.37e-12 | 9.86e-11 | 78 |
| GO:00325434 | Oral cavity | OSCC | mitochondrial translation | 59/7305 | 76/18723 | 7.21e-12 | 2.70e-10 | 59 |
| GO:003254313 | Oral cavity | LP | mitochondrial translation | 43/4623 | 76/18723 | 2.85e-09 | 1.26e-07 | 43 |
| GO:014005312 | Oral cavity | LP | mitochondrial gene expression | 53/4623 | 108/18723 | 3.54e-08 | 1.27e-06 | 53 |
| GO:00325433 | Prostate | BPH | mitochondrial translation | 23/3107 | 76/18723 | 2.21e-03 | 1.22e-02 | 23 |
| GO:01400532 | Prostate | BPH | mitochondrial gene expression | 29/3107 | 108/18723 | 4.68e-03 | 2.25e-02 | 29 |
| GO:003254312 | Prostate | Tumor | mitochondrial translation | 24/3246 | 76/18723 | 1.73e-03 | 1.03e-02 | 24 |
| GO:014005311 | Prostate | Tumor | mitochondrial gene expression | 31/3246 | 108/18723 | 2.31e-03 | 1.30e-02 | 31 |
| GO:00325436 | Skin | cSCC | mitochondrial translation | 47/4864 | 76/18723 | 4.70e-11 | 2.22e-09 | 47 |
| GO:01400535 | Skin | cSCC | mitochondrial gene expression | 56/4864 | 108/18723 | 8.06e-09 | 2.56e-07 | 56 |
| GO:01400536 | Thyroid | PTC | mitochondrial gene expression | 51/5968 | 108/18723 | 6.04e-04 | 3.83e-03 | 51 |
| GO:00325437 | Thyroid | PTC | mitochondrial translation | 38/5968 | 76/18723 | 7.52e-04 | 4.67e-03 | 38 |
| GO:014005314 | Thyroid | ATC | mitochondrial gene expression | 51/6293 | 108/18723 | 2.26e-03 | 1.06e-02 | 51 |
| GO:003254315 | Thyroid | ATC | mitochondrial translation | 38/6293 | 76/18723 | 2.26e-03 | 1.06e-02 | 38 |
| Page: 1 |
| Pathway ID | Tissue | Disease Stage | Description | Gene Ratio | Bg Ratio | pvalue | p.adjust | qvalue | Count |
| hsa0301022 | Liver | Cirrhotic | Ribosome | 127/2530 | 167/8465 | 2.12e-35 | 7.06e-33 | 4.35e-33 | 127 |
| hsa0301032 | Liver | Cirrhotic | Ribosome | 127/2530 | 167/8465 | 2.12e-35 | 7.06e-33 | 4.35e-33 | 127 |
| hsa0301042 | Liver | HCC | Ribosome | 128/4020 | 167/8465 | 7.32e-15 | 2.23e-13 | 1.24e-13 | 128 |
| hsa0301052 | Liver | HCC | Ribosome | 128/4020 | 167/8465 | 7.32e-15 | 2.23e-13 | 1.24e-13 | 128 |
| hsa0301030 | Oral cavity | OSCC | Ribosome | 128/3704 | 167/8465 | 2.42e-18 | 1.62e-16 | 8.25e-17 | 128 |
| hsa03010114 | Oral cavity | OSCC | Ribosome | 128/3704 | 167/8465 | 2.42e-18 | 1.62e-16 | 8.25e-17 | 128 |
| hsa03010210 | Oral cavity | LP | Ribosome | 127/2418 | 167/8465 | 1.22e-37 | 4.05e-35 | 2.61e-35 | 127 |
| hsa0301038 | Oral cavity | LP | Ribosome | 127/2418 | 167/8465 | 1.22e-37 | 4.05e-35 | 2.61e-35 | 127 |
| hsa0301028 | Prostate | BPH | Ribosome | 104/1718 | 167/8465 | 8.04e-33 | 1.33e-30 | 8.21e-31 | 104 |
| hsa03010113 | Prostate | BPH | Ribosome | 104/1718 | 167/8465 | 8.04e-33 | 1.33e-30 | 8.21e-31 | 104 |
| hsa0301029 | Prostate | Tumor | Ribosome | 104/1791 | 167/8465 | 3.53e-31 | 5.84e-29 | 3.62e-29 | 104 |
| hsa0301037 | Prostate | Tumor | Ribosome | 104/1791 | 167/8465 | 3.53e-31 | 5.84e-29 | 3.62e-29 | 104 |
| hsa0301012 | Stomach | GC | Ribosome | 64/708 | 167/8465 | 2.58e-27 | 8.26e-25 | 5.81e-25 | 64 |
| hsa0301013 | Stomach | GC | Ribosome | 64/708 | 167/8465 | 2.58e-27 | 8.26e-25 | 5.81e-25 | 64 |
| hsa0301021 | Stomach | CAG with IM | Ribosome | 63/640 | 167/8465 | 5.86e-29 | 1.86e-26 | 1.31e-26 | 63 |
| hsa0301031 | Stomach | CAG with IM | Ribosome | 63/640 | 167/8465 | 5.86e-29 | 1.86e-26 | 1.31e-26 | 63 |
| hsa0301041 | Stomach | CSG | Ribosome | 64/633 | 167/8465 | 3.70e-30 | 1.17e-27 | 8.41e-28 | 64 |
| hsa0301051 | Stomach | CSG | Ribosome | 64/633 | 167/8465 | 3.70e-30 | 1.17e-27 | 8.41e-28 | 64 |
| hsa0301061 | Stomach | CAG | Ribosome | 61/368 | 167/8465 | 2.85e-41 | 8.23e-39 | 6.59e-39 | 61 |
| hsa0301071 | Stomach | CAG | Ribosome | 61/368 | 167/8465 | 2.85e-41 | 8.23e-39 | 6.59e-39 | 61 |
| Page: 1 2 |
Top |
Cell-cell communication analysis |
| Identification of potential cell-cell interactions between two cell types and their ligand-receptor pairs for different disease states |
| Ligand | Receptor | LRpair | Pathway | Tissue | Disease Stage |
| Page: 1 |
Top |
Single-cell gene regulatory network inference analysis |
| Find out the significant the regulons (TFs) and the target genes of each regulon across cell types for different disease states |
| TF | Cell Type | Tissue | Disease Stage | Target Gene | RSS | Regulon Activity |
| ∗The dot plots of a searched regulon are shown for all cell subpopulations in each disease state of each tissue based on the regulon specific score inferred using pySCENIC and by calculating the average expression. |
| Page: 1 |
Top |
Somatic mutation of malignant transformation related genes |
| Annotation of somatic variants for genes involved in malignant transformation |
| Hugo Symbol | Variant Class | Variant Classification | dbSNP RS | HGVSc | HGVSp | HGVSp Short | SWISSPROT | BIOTYPE | SIFT | PolyPhen | Tumor Sample Barcode | Tissue | Histology | Sex | Age | Stage | Therapy Types | Drugs | Outcome |
| MRPL23 | SNV | Missense_Mutation | rs576240953 | c.391N>A | p.Glu131Lys | p.E131K | Q16540 | protein_coding | tolerated(0.84) | benign(0) | TCGA-VS-A9UZ-01 | Cervix | cervical & endocervical cancer | Female | <65 | I/II | Unknown | Unknown | SD |
| Page: 1 |
Top |
Related drugs of malignant transformation related genes |
| Identification of chemicals and drugs interact with genes involved in malignant transfromation |
| (DGIdb 4.0) |
| Entrez ID | Symbol | Category | Interaction Types | Drug Claim Name | Drug Name | PMIDs |
| Page: 1 |

Copyright 2023-Present -The University of Texas Health Science Center at Houston |