
|
|||||
|
 | |
| |
| |
| |
| |
| |
|
Gene: LINC00540 |
Gene summary for LINC00540 |
| Gene information | Species | Human | Gene symbol | LINC00540 | Gene ID | 100506622 |
| Gene name | long intergenic non-protein coding RNA 540 | |
| Gene Alias | LINC00540 | |
| Cytomap | 13q12.11 | |
| Gene Type | ncRNA | GO ID | NA | UniProtAcc | NA |
Top |
Malignant transformation analysis |
| Identification of the aberrant gene expression in precancerous and cancerous lesions by comparing the gene expression of stem-like cells in diseased tissues with normal stem cells |
| Entrez ID | Symbol | Replicates | Species | Organ | Tissue | Adj P-value | Log2FC | Malignancy |
| 100506622 | LINC00540 | HTA11_2487_2000001011 | Human | Colorectum | SER | 3.37e-03 | 1.53e-01 | -0.1808 |
| 100506622 | LINC00540 | HTA11_347_2000001011 | Human | Colorectum | AD | 3.56e-12 | 4.00e-01 | -0.1954 |
| 100506622 | LINC00540 | HTA11_2112_2000001011 | Human | Colorectum | SER | 1.71e-03 | 3.67e-01 | -0.2196 |
| 100506622 | LINC00540 | HTA11_3361_2000001011 | Human | Colorectum | AD | 6.03e-08 | 2.88e-01 | -0.1207 |
| 100506622 | LINC00540 | HTA11_83_2000001011 | Human | Colorectum | SER | 1.40e-25 | 8.34e-01 | -0.1526 |
| 100506622 | LINC00540 | HTA11_696_2000001011 | Human | Colorectum | AD | 3.61e-02 | 1.06e-01 | -0.1464 |
| 100506622 | LINC00540 | HTA11_866_2000001011 | Human | Colorectum | AD | 2.11e-21 | 4.66e-01 | -0.1001 |
| 100506622 | LINC00540 | HTA11_1391_2000001011 | Human | Colorectum | AD | 9.83e-03 | 1.30e-01 | -0.059 |
| 100506622 | LINC00540 | HTA11_2992_2000001011 | Human | Colorectum | SER | 1.94e-06 | 4.01e-01 | -0.1706 |
| 100506622 | LINC00540 | HTA11_11156_2000001011 | Human | Colorectum | AD | 1.57e-05 | 3.90e-01 | 0.0397 |
| 100506622 | LINC00540 | HTA11_99999973899_84307 | Human | Colorectum | MSS | 1.14e-04 | 1.84e-01 | 0.2585 |
| 100506622 | LINC00540 | P2T-E | Human | Esophagus | ESCC | 1.13e-16 | 3.71e-01 | 0.1177 |
| 100506622 | LINC00540 | P5T-E | Human | Esophagus | ESCC | 2.03e-09 | 2.64e-01 | 0.1327 |
| 100506622 | LINC00540 | P15T-E | Human | Esophagus | ESCC | 3.16e-13 | 2.79e-01 | 0.1149 |
| 100506622 | LINC00540 | P20T-E | Human | Esophagus | ESCC | 2.18e-13 | 3.13e-01 | 0.1124 |
| 100506622 | LINC00540 | P28T-E | Human | Esophagus | ESCC | 1.96e-05 | 1.36e-01 | 0.1149 |
| 100506622 | LINC00540 | P31T-E | Human | Esophagus | ESCC | 9.44e-07 | 1.90e-01 | 0.1251 |
| 100506622 | LINC00540 | P37T-E | Human | Esophagus | ESCC | 4.26e-12 | 2.84e-01 | 0.1371 |
| 100506622 | LINC00540 | P39T-E | Human | Esophagus | ESCC | 4.41e-07 | 1.63e-01 | 0.0894 |
| 100506622 | LINC00540 | P42T-E | Human | Esophagus | ESCC | 5.06e-16 | 5.17e-01 | 0.1175 |
| Page: 1 2 |
| Tissue | Expression Dynamics | Abbreviation |
| Colorectum (GSE201348) |  | FAP: Familial adenomatous polyposis |
| CRC: Colorectal cancer | ||
| Colorectum (HTA11) | 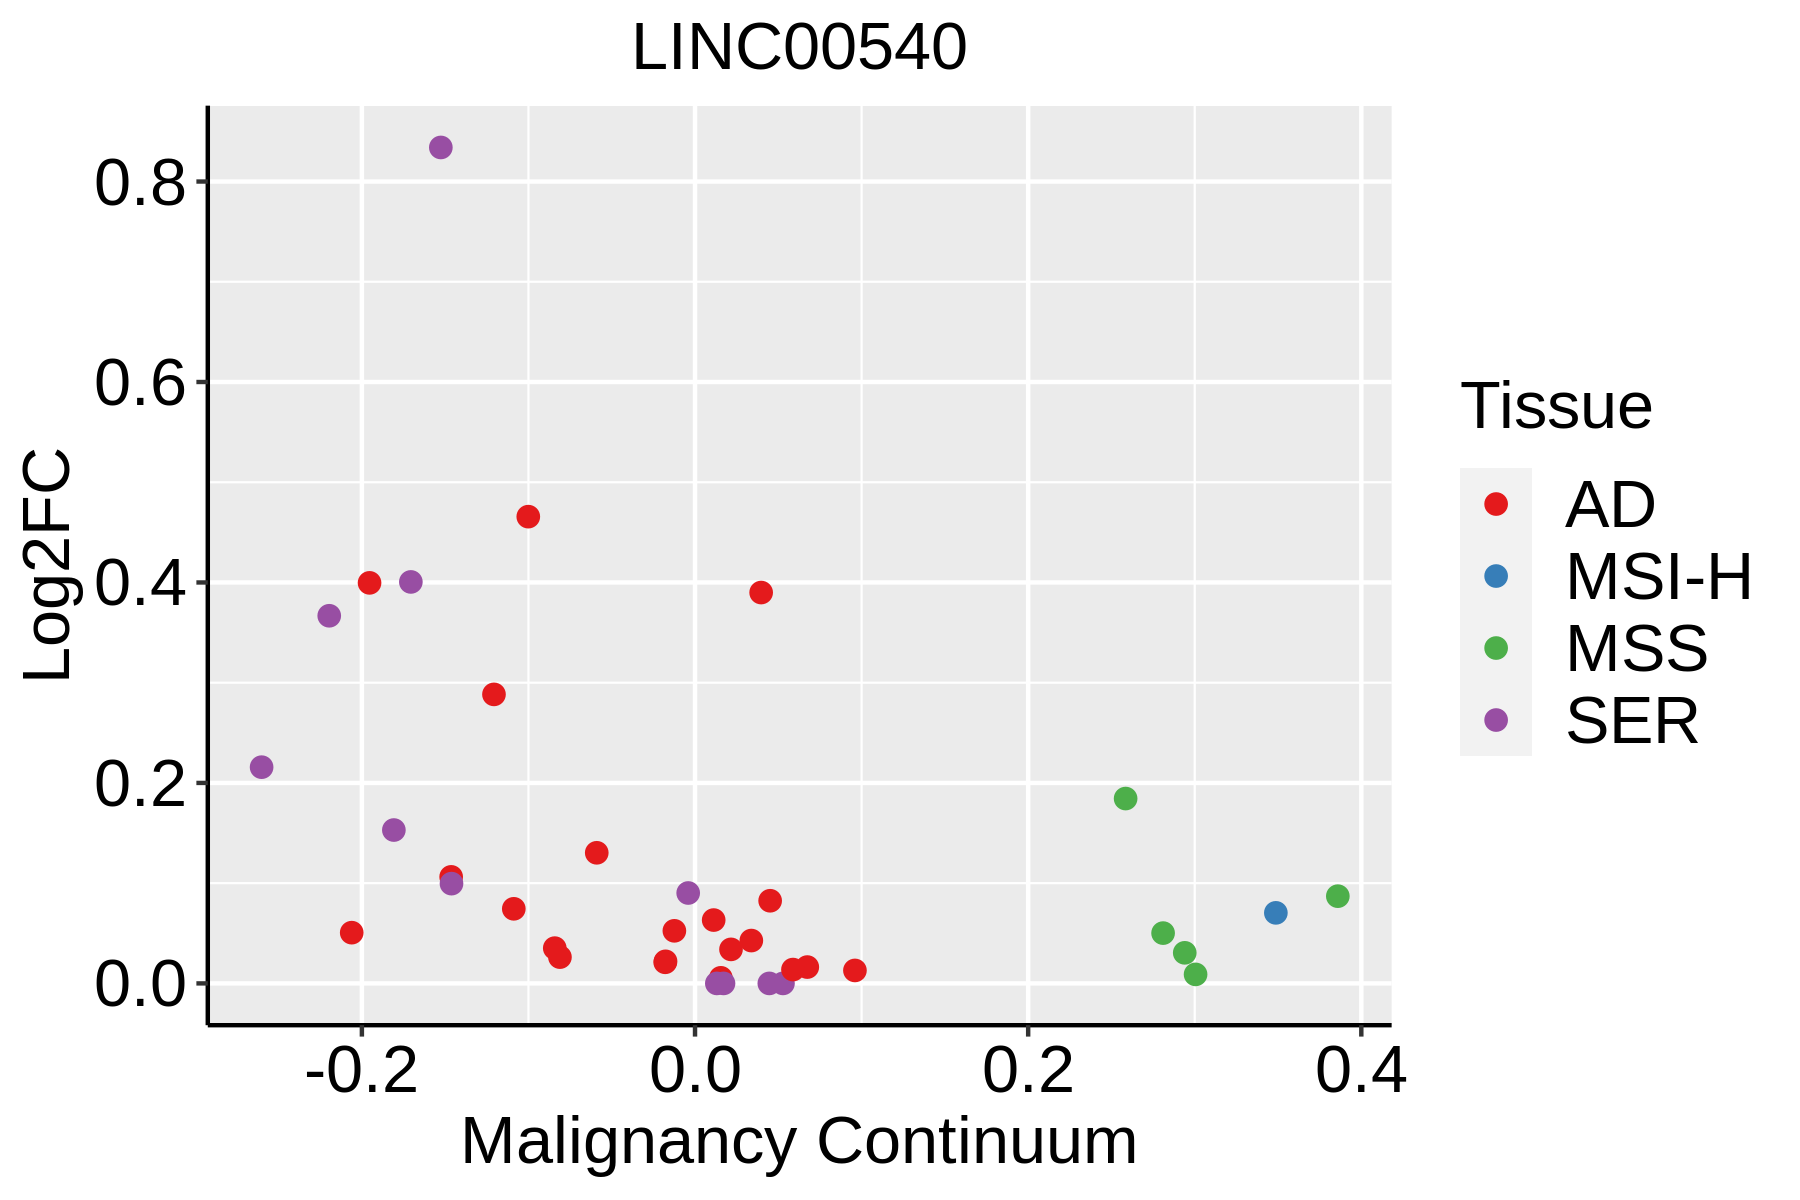 | AD: Adenomas |
| SER: Sessile serrated lesions | ||
| MSI-H: Microsatellite-high colorectal cancer | ||
| MSS: Microsatellite stable colorectal cancer | ||
| Esophagus | 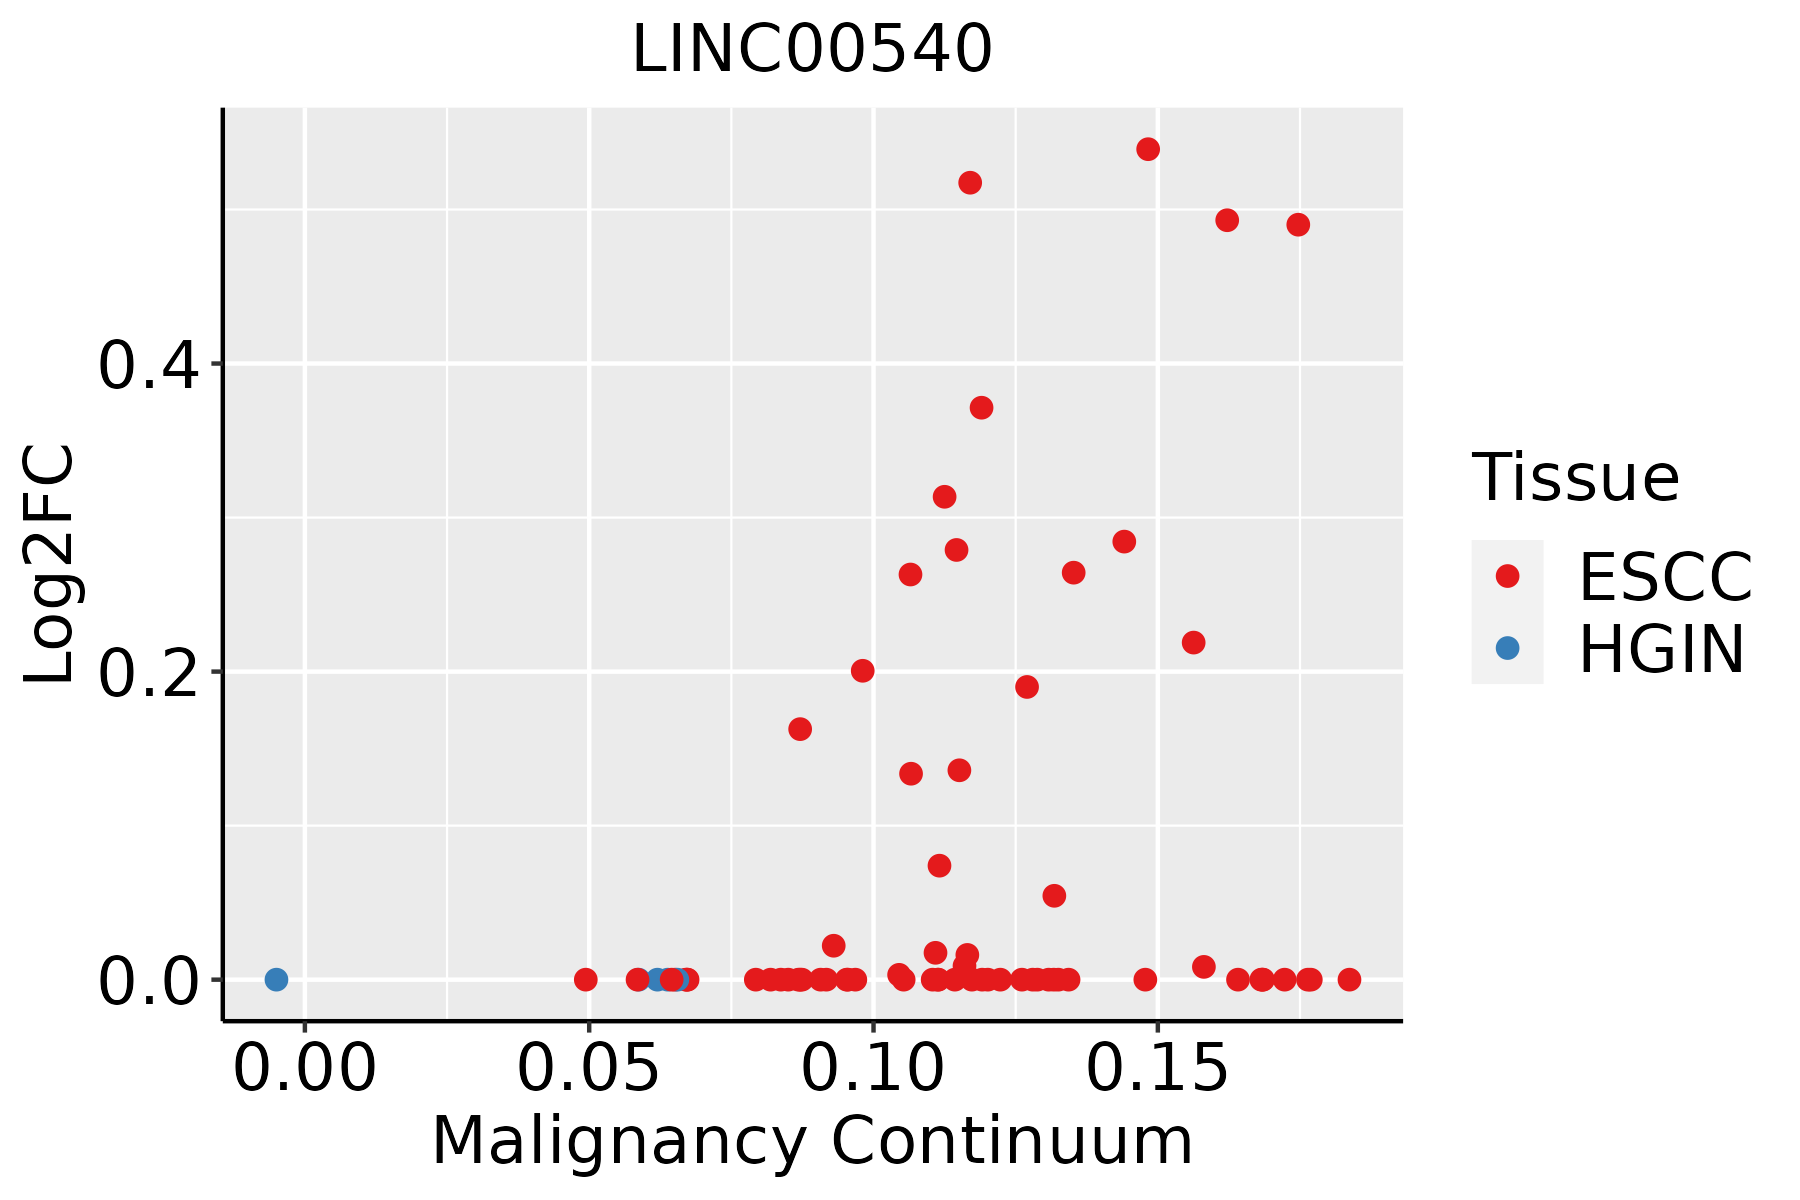 | ESCC: Esophageal squamous cell carcinoma |
| HGIN: High-grade intraepithelial neoplasias | ||
| LGIN: Low-grade intraepithelial neoplasias |
| ∗log2FC in expression of this searched gene in stem-like cells from each diseased tissue sample relative to stem-like cells in normal samples in each tissue plotted against the malignancy continuum. Samples are colored based on if they are from different disease stage. |
Top |
Malignant transformation related pathway analysis |
| Find out the enriched GO biological processes and KEGG pathways involved in transition from healthy to precancer to cancer |
| Tissue | Disease Stage | Enriched GO biological Processes |
| Oral cavity | OSCC |  |
| Oral cavity | LP |  |
| Oral cavity | EOLP |  |
| Oral cavity | NEOLP |  |
| Esophagus | HGIN |  |
| ∗Top 15 enriched GO BP terms are showed in the bar plot of each disease state in each tissue. Each row represents a significant GO biological process which is colored according to the -log10(p.adjust). |
| Page: 1 2 3 4 5 6 7 8 9 |
| GO ID | Tissue | Disease Stage | Description | Gene Ratio | Bg Ratio | pvalue | p.adjust | Count |
| Page: 1 |
| Pathway ID | Tissue | Disease Stage | Description | Gene Ratio | Bg Ratio | pvalue | p.adjust | qvalue | Count |
| Page: 1 |
Top |
Cell-cell communication analysis |
| Identification of potential cell-cell interactions between two cell types and their ligand-receptor pairs for different disease states |
| Ligand | Receptor | LRpair | Pathway | Tissue | Disease Stage |
| Page: 1 |
Top |
Single-cell gene regulatory network inference analysis |
| Find out the significant the regulons (TFs) and the target genes of each regulon across cell types for different disease states |
| TF | Cell Type | Tissue | Disease Stage | Target Gene | RSS | Regulon Activity |
| ∗The dot plots of a searched regulon are shown for all cell subpopulations in each disease state of each tissue based on the regulon specific score inferred using pySCENIC and by calculating the average expression. |
| Page: 1 |
Top |
Somatic mutation of malignant transformation related genes |
| Annotation of somatic variants for genes involved in malignant transformation |
| Hugo Symbol | Variant Class | Variant Classification | dbSNP RS | HGVSc | HGVSp | HGVSp Short | SWISSPROT | BIOTYPE | SIFT | PolyPhen | Tumor Sample Barcode | Tissue | Histology | Sex | Age | Stage | Therapy Types | Drugs | Outcome |
| Page: 1 |
Top |
Related drugs of malignant transformation related genes |
| Identification of chemicals and drugs interact with genes involved in malignant transfromation |
| (DGIdb 4.0) |
| Entrez ID | Symbol | Category | Interaction Types | Drug Claim Name | Drug Name | PMIDs |
| Page: 1 |

Copyright 2023-Present -The University of Texas Health Science Center at Houston |