
|
|||||
|
 | |
| |
| |
| |
| |
| |
|
Gene: ITGA10 |
Gene summary for ITGA10 |
| Gene information | Species | Human | Gene symbol | ITGA10 | Gene ID | 8515 |
| Gene name | integrin subunit alpha 10 | |
| Gene Alias | PRO827 | |
| Cytomap | 1q21.1 | |
| Gene Type | protein-coding | GO ID | GO:0007154 | UniProtAcc | B4E282 |
Top |
Malignant transformation analysis |
| Identification of the aberrant gene expression in precancerous and cancerous lesions by comparing the gene expression of stem-like cells in diseased tissues with normal stem cells |
| Entrez ID | Symbol | Replicates | Species | Organ | Tissue | Adj P-value | Log2FC | Malignancy |
| 8515 | ITGA10 | ATC11 | Human | Thyroid | ATC | 3.71e-05 | 7.14e-01 | 0.3386 |
| 8515 | ITGA10 | ATC12 | Human | Thyroid | ATC | 4.84e-63 | 1.29e+00 | 0.34 |
| 8515 | ITGA10 | ATC3 | Human | Thyroid | ATC | 5.97e-08 | 6.02e-01 | 0.338 |
| 8515 | ITGA10 | ATC4 | Human | Thyroid | ATC | 1.29e-70 | 1.46e+00 | 0.34 |
| Page: 1 |
| Tissue | Expression Dynamics | Abbreviation |
| Thyroid | 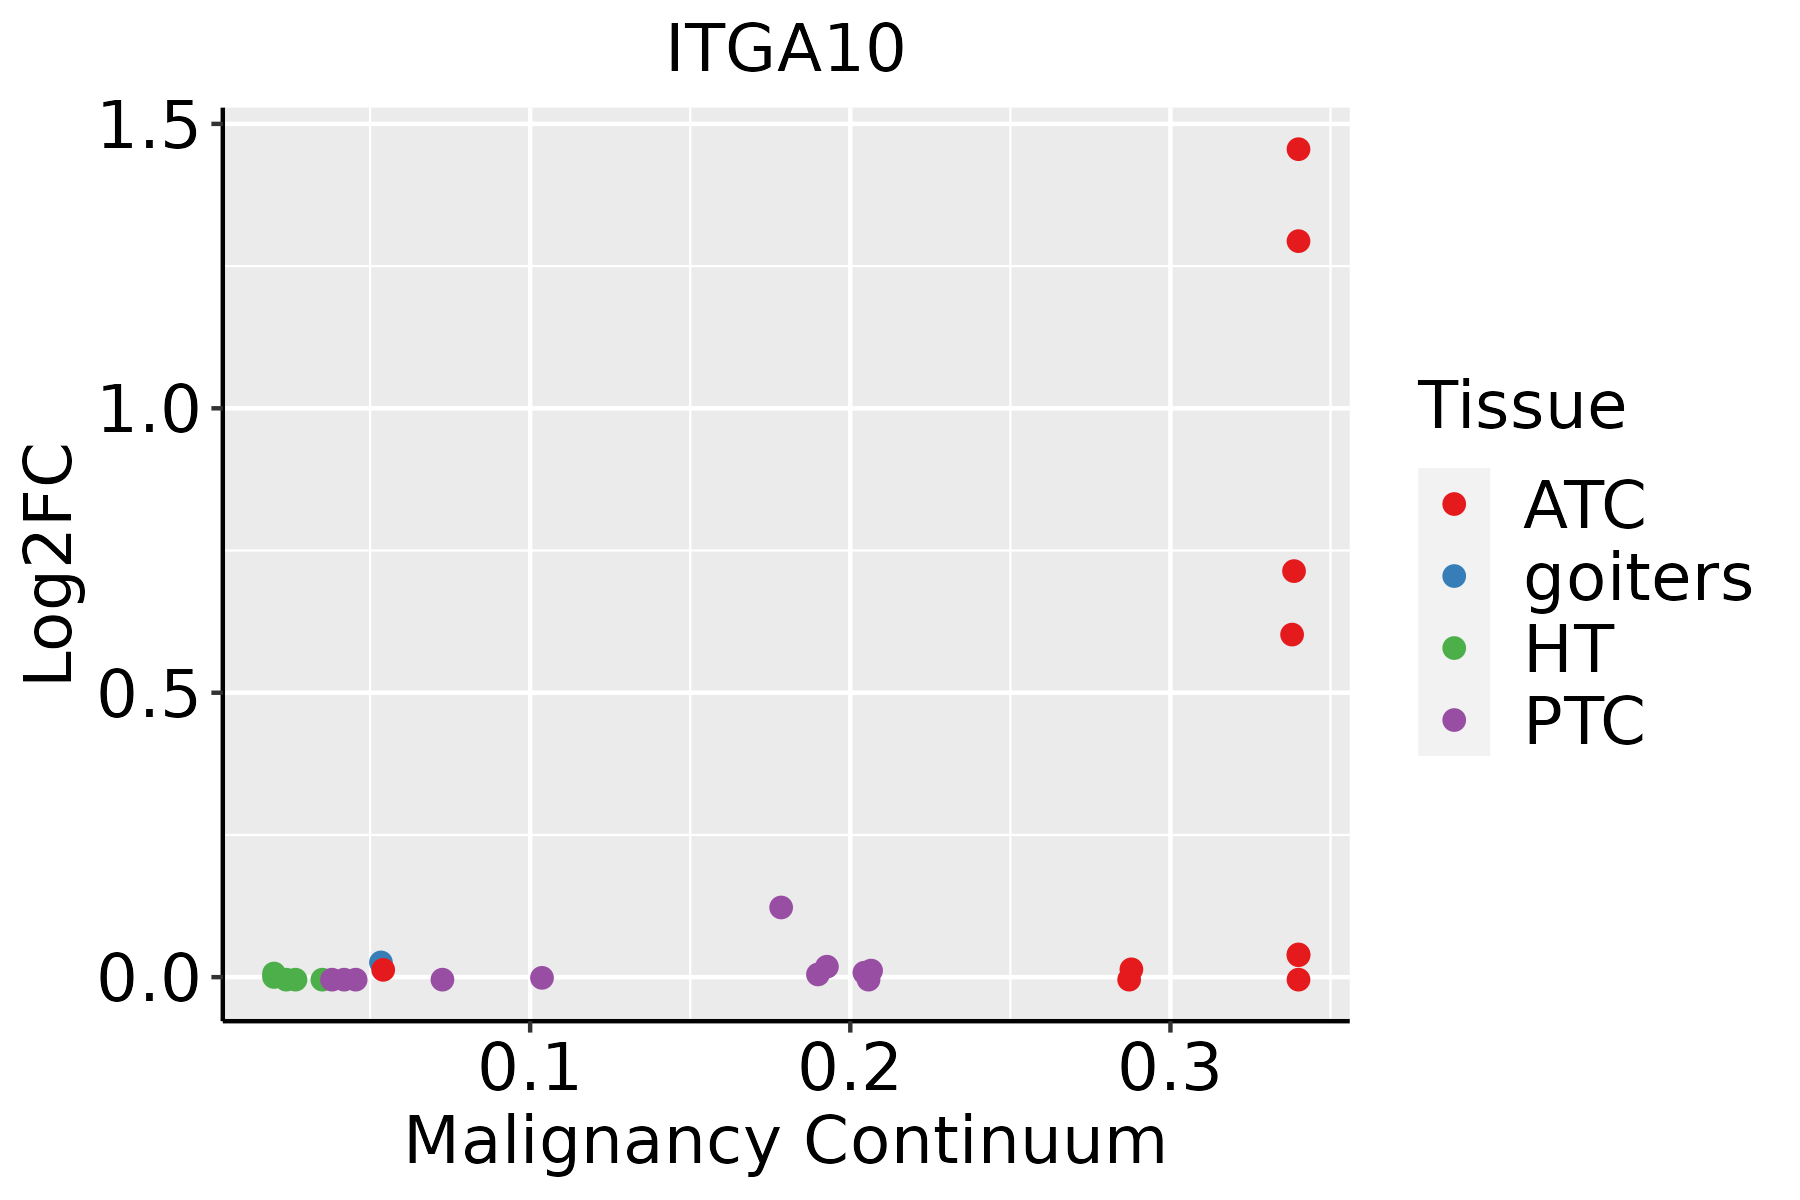 | ATC: Anaplastic thyroid cancer |
| HT: Hashimoto's thyroiditis | ||
| PTC: Papillary thyroid cancer |
| ∗log2FC in expression of this searched gene in stem-like cells from each diseased tissue sample relative to stem-like cells in normal samples in each tissue plotted against the malignancy continuum. Samples are colored based on if they are from different disease stage. |
Top |
Malignant transformation related pathway analysis |
| Find out the enriched GO biological processes and KEGG pathways involved in transition from healthy to precancer to cancer |
| Tissue | Disease Stage | Enriched GO biological Processes |
| Oral cavity | OSCC |  |
| Oral cavity | LP |  |
| Oral cavity | EOLP |  |
| Oral cavity | NEOLP |  |
| Esophagus | HGIN |  |
| ∗Top 15 enriched GO BP terms are showed in the bar plot of each disease state in each tissue. Each row represents a significant GO biological process which is colored according to the -log10(p.adjust). |
| Page: 1 2 3 4 5 6 7 8 9 |
| GO ID | Tissue | Disease Stage | Description | Gene Ratio | Bg Ratio | pvalue | p.adjust | Count |
| GO:003158928 | Thyroid | ATC | cell-substrate adhesion | 195/6293 | 363/18723 | 1.58e-15 | 1.17e-13 | 195 |
| GO:0007160111 | Thyroid | ATC | cell-matrix adhesion | 128/6293 | 233/18723 | 1.49e-11 | 5.41e-10 | 128 |
| GO:000722919 | Thyroid | ATC | integrin-mediated signaling pathway | 63/6293 | 107/18723 | 7.09e-08 | 1.24e-06 | 63 |
| Page: 1 |
| Pathway ID | Tissue | Disease Stage | Description | Gene Ratio | Bg Ratio | pvalue | p.adjust | qvalue | Count |
| Page: 1 |
Top |
Cell-cell communication analysis |
| Identification of potential cell-cell interactions between two cell types and their ligand-receptor pairs for different disease states |
| Ligand | Receptor | LRpair | Pathway | Tissue | Disease Stage |
| COL1A1 | ITGA10_ITGB1 | COL1A1_ITGA10_ITGB1 | COLLAGEN | Liver | Precancer |
| COL1A2 | ITGA10_ITGB1 | COL1A2_ITGA10_ITGB1 | COLLAGEN | Liver | Precancer |
| COL4A1 | ITGA10_ITGB1 | COL4A1_ITGA10_ITGB1 | COLLAGEN | Liver | Precancer |
| COL4A2 | ITGA10_ITGB1 | COL4A2_ITGA10_ITGB1 | COLLAGEN | Liver | Precancer |
| COL4A3 | ITGA10_ITGB1 | COL4A3_ITGA10_ITGB1 | COLLAGEN | Liver | Precancer |
| COL4A4 | ITGA10_ITGB1 | COL4A4_ITGA10_ITGB1 | COLLAGEN | Liver | Precancer |
| COL6A1 | ITGA10_ITGB1 | COL6A1_ITGA10_ITGB1 | COLLAGEN | Liver | Precancer |
| COL6A2 | ITGA10_ITGB1 | COL6A2_ITGA10_ITGB1 | COLLAGEN | Liver | Precancer |
| COL6A3 | ITGA10_ITGB1 | COL6A3_ITGA10_ITGB1 | COLLAGEN | Liver | Precancer |
| COL1A1 | ITGA10_ITGB1 | COL1A1_ITGA10_ITGB1 | COLLAGEN | THCA | ADJ |
| COL1A2 | ITGA10_ITGB1 | COL1A2_ITGA10_ITGB1 | COLLAGEN | THCA | ADJ |
| COL4A1 | ITGA10_ITGB1 | COL4A1_ITGA10_ITGB1 | COLLAGEN | THCA | ADJ |
| COL4A2 | ITGA10_ITGB1 | COL4A2_ITGA10_ITGB1 | COLLAGEN | THCA | ADJ |
| COL4A3 | ITGA10_ITGB1 | COL4A3_ITGA10_ITGB1 | COLLAGEN | THCA | ADJ |
| COL6A1 | ITGA10_ITGB1 | COL6A1_ITGA10_ITGB1 | COLLAGEN | THCA | ADJ |
| COL6A2 | ITGA10_ITGB1 | COL6A2_ITGA10_ITGB1 | COLLAGEN | THCA | ADJ |
| COL6A3 | ITGA10_ITGB1 | COL6A3_ITGA10_ITGB1 | COLLAGEN | THCA | ADJ |
| COL9A2 | ITGA10_ITGB1 | COL9A2_ITGA10_ITGB1 | COLLAGEN | THCA | ADJ |
| Page: 1 |
Top |
Single-cell gene regulatory network inference analysis |
| Find out the significant the regulons (TFs) and the target genes of each regulon across cell types for different disease states |
| TF | Cell Type | Tissue | Disease Stage | Target Gene | RSS | Regulon Activity |
| ∗The dot plots of a searched regulon are shown for all cell subpopulations in each disease state of each tissue based on the regulon specific score inferred using pySCENIC and by calculating the average expression. |
| Page: 1 |
Top |
Somatic mutation of malignant transformation related genes |
| Annotation of somatic variants for genes involved in malignant transformation |
| Hugo Symbol | Variant Class | Variant Classification | dbSNP RS | HGVSc | HGVSp | HGVSp Short | SWISSPROT | BIOTYPE | SIFT | PolyPhen | Tumor Sample Barcode | Tissue | Histology | Sex | Age | Stage | Therapy Types | Drugs | Outcome |
| ITGA10 | SNV | Missense_Mutation | c.2081N>G | p.His694Arg | p.H694R | O75578 | protein_coding | tolerated(0.82) | benign(0) | TCGA-A8-A09Z-01 | Breast | breast invasive carcinoma | Female | >=65 | I/II | Unknown | Unknown | SD | |
| ITGA10 | SNV | Missense_Mutation | novel | c.2014N>A | p.Glu672Lys | p.E672K | O75578 | protein_coding | deleterious(0.03) | possibly_damaging(0.555) | TCGA-AN-A03X-01 | Breast | breast invasive carcinoma | Female | >=65 | I/II | Unknown | Unknown | SD |
| ITGA10 | SNV | Missense_Mutation | novel | c.1045G>A | p.Ala349Thr | p.A349T | O75578 | protein_coding | deleterious(0) | probably_damaging(0.995) | TCGA-AN-A046-01 | Breast | breast invasive carcinoma | Female | >=65 | I/II | Unknown | Unknown | SD |
| ITGA10 | SNV | Missense_Mutation | c.202N>T | p.Asp68Tyr | p.D68Y | O75578 | protein_coding | tolerated(0.21) | benign(0.02) | TCGA-AN-A0XU-01 | Breast | breast invasive carcinoma | Female | <65 | I/II | Unknown | Unknown | SD | |
| ITGA10 | SNV | Missense_Mutation | c.661G>A | p.Asp221Asn | p.D221N | O75578 | protein_coding | deleterious(0.04) | possibly_damaging(0.734) | TCGA-AR-A1AR-01 | Breast | breast invasive carcinoma | Female | <65 | III/IV | Unspecific | Docetaxel | PD | |
| ITGA10 | SNV | Missense_Mutation | c.1331N>T | p.Arg444Leu | p.R444L | O75578 | protein_coding | tolerated(0.29) | benign(0.021) | TCGA-AR-A5QP-01 | Breast | breast invasive carcinoma | Female | <65 | I/II | Hormone Therapy | tamoxiphen | SD | |
| ITGA10 | SNV | Missense_Mutation | novel | c.3206N>G | p.Val1069Gly | p.V1069G | O75578 | protein_coding | deleterious(0) | benign(0.397) | TCGA-B6-A1KF-01 | Breast | breast invasive carcinoma | Female | >=65 | I/II | Unknown | Unknown | SD |
| ITGA10 | SNV | Missense_Mutation | novel | c.3206N>G | p.Val1069Gly | p.V1069G | O75578 | protein_coding | deleterious(0) | benign(0.397) | TCGA-BH-A1FH-01 | Breast | breast invasive carcinoma | Female | <65 | III/IV | Unknown | Unknown | PD |
| ITGA10 | SNV | Missense_Mutation | novel | c.3206N>G | p.Val1069Gly | p.V1069G | O75578 | protein_coding | deleterious(0) | benign(0.397) | TCGA-D8-A1JA-01 | Breast | breast invasive carcinoma | Female | <65 | III/IV | Chemotherapy | adriamycin | PD |
| ITGA10 | SNV | Missense_Mutation | novel | c.3206N>G | p.Val1069Gly | p.V1069G | O75578 | protein_coding | deleterious(0) | benign(0.397) | TCGA-D8-A1X7-01 | Breast | breast invasive carcinoma | Female | <65 | I/II | ChemotherapyHormone Therapy | doxorubicine+cyclophosphamide+tamoxifen | SD |
| Page: 1 2 3 4 5 6 7 8 9 10 11 12 13 14 |
Top |
Related drugs of malignant transformation related genes |
| Identification of chemicals and drugs interact with genes involved in malignant transfromation |
| (DGIdb 4.0) |
| Entrez ID | Symbol | Category | Interaction Types | Drug Claim Name | Drug Name | PMIDs |
| Page: 1 |

Copyright 2023-Present -The University of Texas Health Science Center at Houston |