
|
|||||
|
 | |
| |
| |
| |
| |
| |
|
Gene: IRF3 |
Gene summary for IRF3 |
| Gene information | Species | Human | Gene symbol | IRF3 | Gene ID | 3661 |
| Gene name | interferon regulatory factor 3 | |
| Gene Alias | IIAE7 | |
| Cytomap | 19q13.33 | |
| Gene Type | protein-coding | GO ID | GO:0000122 | UniProtAcc | Q14653 |
Top |
Malignant transformation analysis |
| Identification of the aberrant gene expression in precancerous and cancerous lesions by comparing the gene expression of stem-like cells in diseased tissues with normal stem cells |
| Entrez ID | Symbol | Replicates | Species | Organ | Tissue | Adj P-value | Log2FC | Malignancy |
| 3661 | IRF3 | LZE4T | Human | Esophagus | ESCC | 1.73e-08 | 2.39e-01 | 0.0811 |
| 3661 | IRF3 | LZE5T | Human | Esophagus | ESCC | 7.84e-04 | 4.51e-01 | 0.0514 |
| 3661 | IRF3 | LZE7T | Human | Esophagus | ESCC | 6.34e-11 | 5.18e-01 | 0.0667 |
| 3661 | IRF3 | LZE8T | Human | Esophagus | ESCC | 3.76e-09 | 3.27e-01 | 0.067 |
| 3661 | IRF3 | LZE20T | Human | Esophagus | ESCC | 2.06e-06 | 2.73e-01 | 0.0662 |
| 3661 | IRF3 | LZE22D1 | Human | Esophagus | HGIN | 1.03e-05 | 3.38e-01 | 0.0595 |
| 3661 | IRF3 | LZE22T | Human | Esophagus | ESCC | 3.53e-04 | 4.03e-01 | 0.068 |
| 3661 | IRF3 | LZE24D1 | Human | Esophagus | HGIN | 3.63e-03 | 4.97e-01 | 0.054 |
| 3661 | IRF3 | LZE24T | Human | Esophagus | ESCC | 1.88e-16 | 5.66e-01 | 0.0596 |
| 3661 | IRF3 | LZE6T | Human | Esophagus | ESCC | 1.22e-04 | 2.23e-01 | 0.0845 |
| 3661 | IRF3 | P1T-E | Human | Esophagus | ESCC | 2.05e-16 | 7.87e-01 | 0.0875 |
| 3661 | IRF3 | P2T-E | Human | Esophagus | ESCC | 1.45e-32 | 5.29e-01 | 0.1177 |
| 3661 | IRF3 | P4T-E | Human | Esophagus | ESCC | 6.31e-26 | 5.42e-01 | 0.1323 |
| 3661 | IRF3 | P5T-E | Human | Esophagus | ESCC | 5.55e-09 | 2.41e-01 | 0.1327 |
| 3661 | IRF3 | P8T-E | Human | Esophagus | ESCC | 1.36e-71 | 1.37e+00 | 0.0889 |
| 3661 | IRF3 | P9T-E | Human | Esophagus | ESCC | 9.58e-15 | 3.80e-01 | 0.1131 |
| 3661 | IRF3 | P10T-E | Human | Esophagus | ESCC | 4.92e-35 | 6.68e-01 | 0.116 |
| 3661 | IRF3 | P11T-E | Human | Esophagus | ESCC | 1.46e-12 | 5.31e-01 | 0.1426 |
| 3661 | IRF3 | P12T-E | Human | Esophagus | ESCC | 2.19e-22 | 4.52e-01 | 0.1122 |
| 3661 | IRF3 | P15T-E | Human | Esophagus | ESCC | 3.61e-21 | 5.54e-01 | 0.1149 |
| Page: 1 2 3 4 5 6 7 |
| Tissue | Expression Dynamics | Abbreviation |
| Esophagus |  | ESCC: Esophageal squamous cell carcinoma |
| HGIN: High-grade intraepithelial neoplasias | ||
| LGIN: Low-grade intraepithelial neoplasias | ||
| Liver | 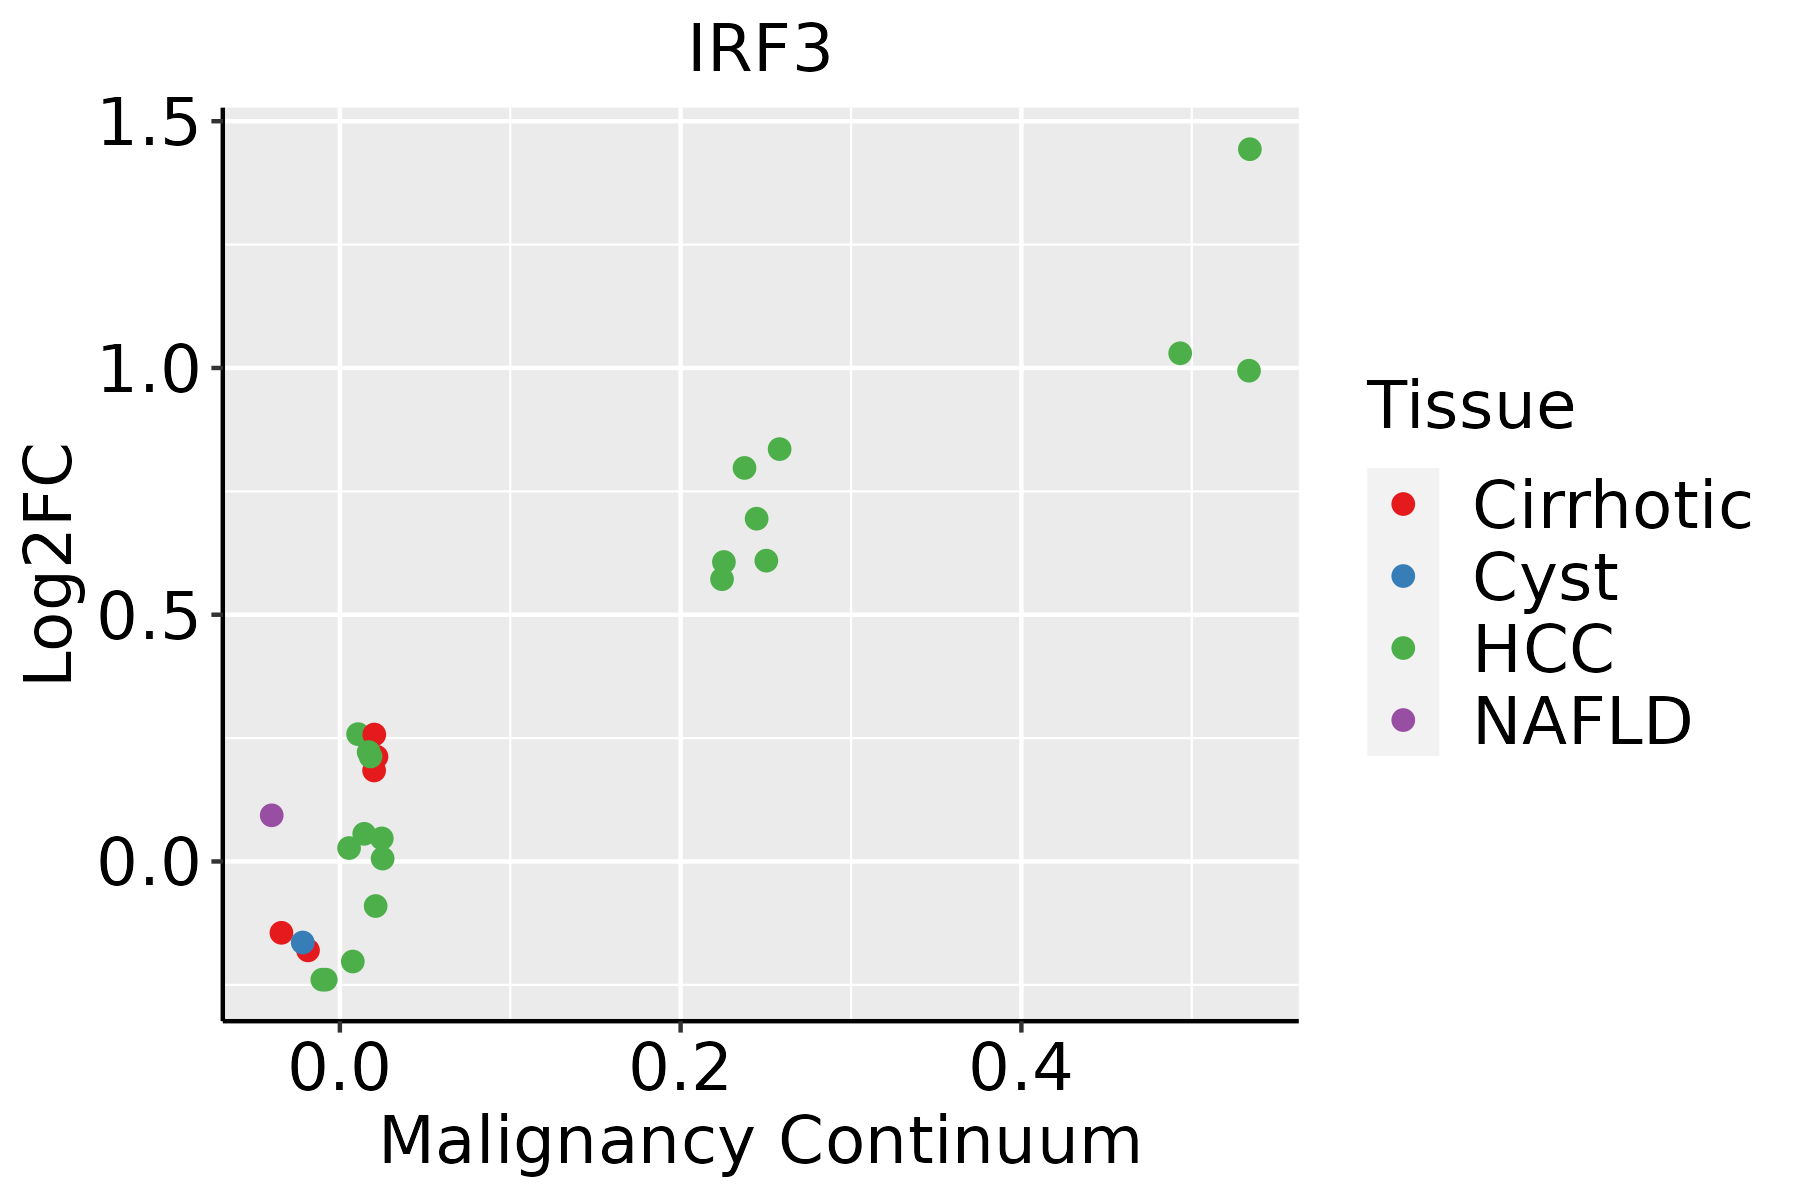 | HCC: Hepatocellular carcinoma |
| NAFLD: Non-alcoholic fatty liver disease | ||
| Oral Cavity | 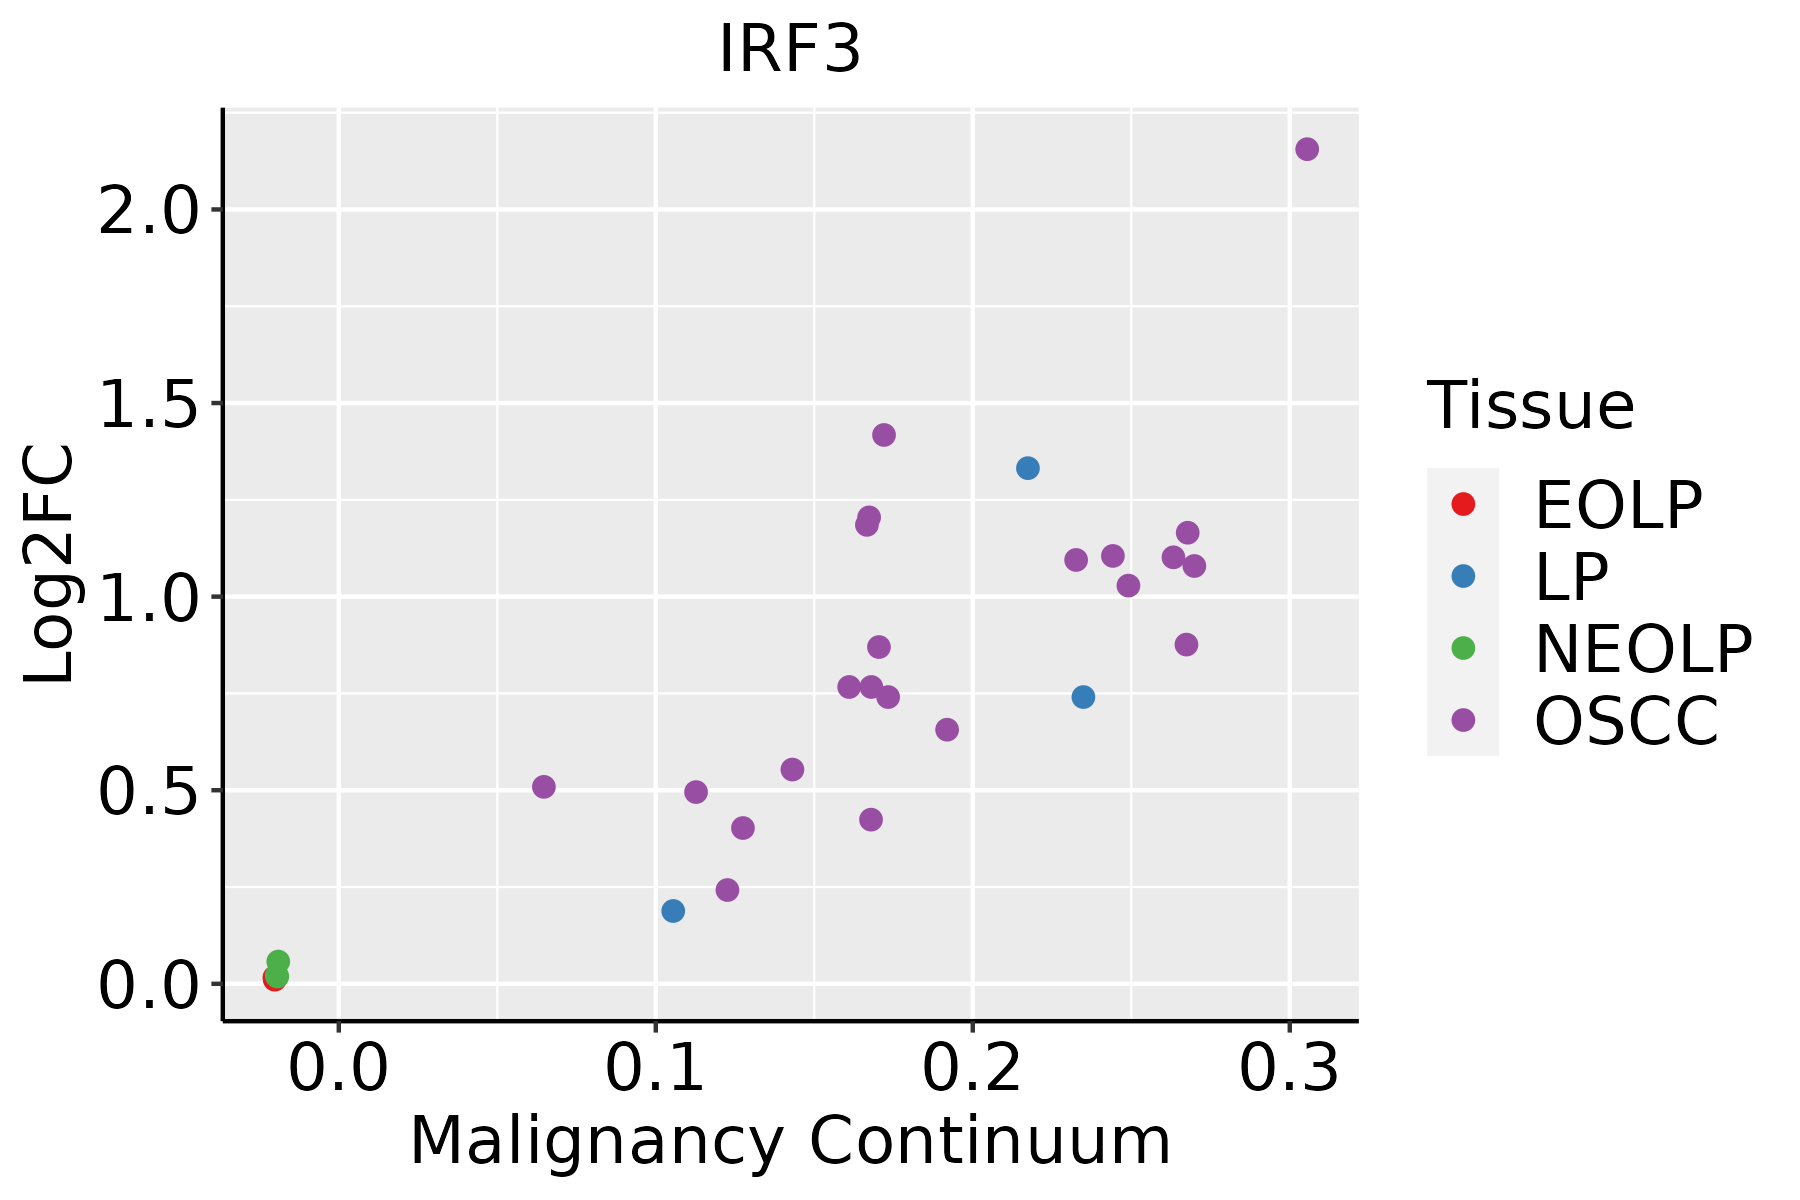 | EOLP: Erosive Oral lichen planus |
| LP: leukoplakia | ||
| NEOLP: Non-erosive oral lichen planus | ||
| OSCC: Oral squamous cell carcinoma | ||
| Skin | 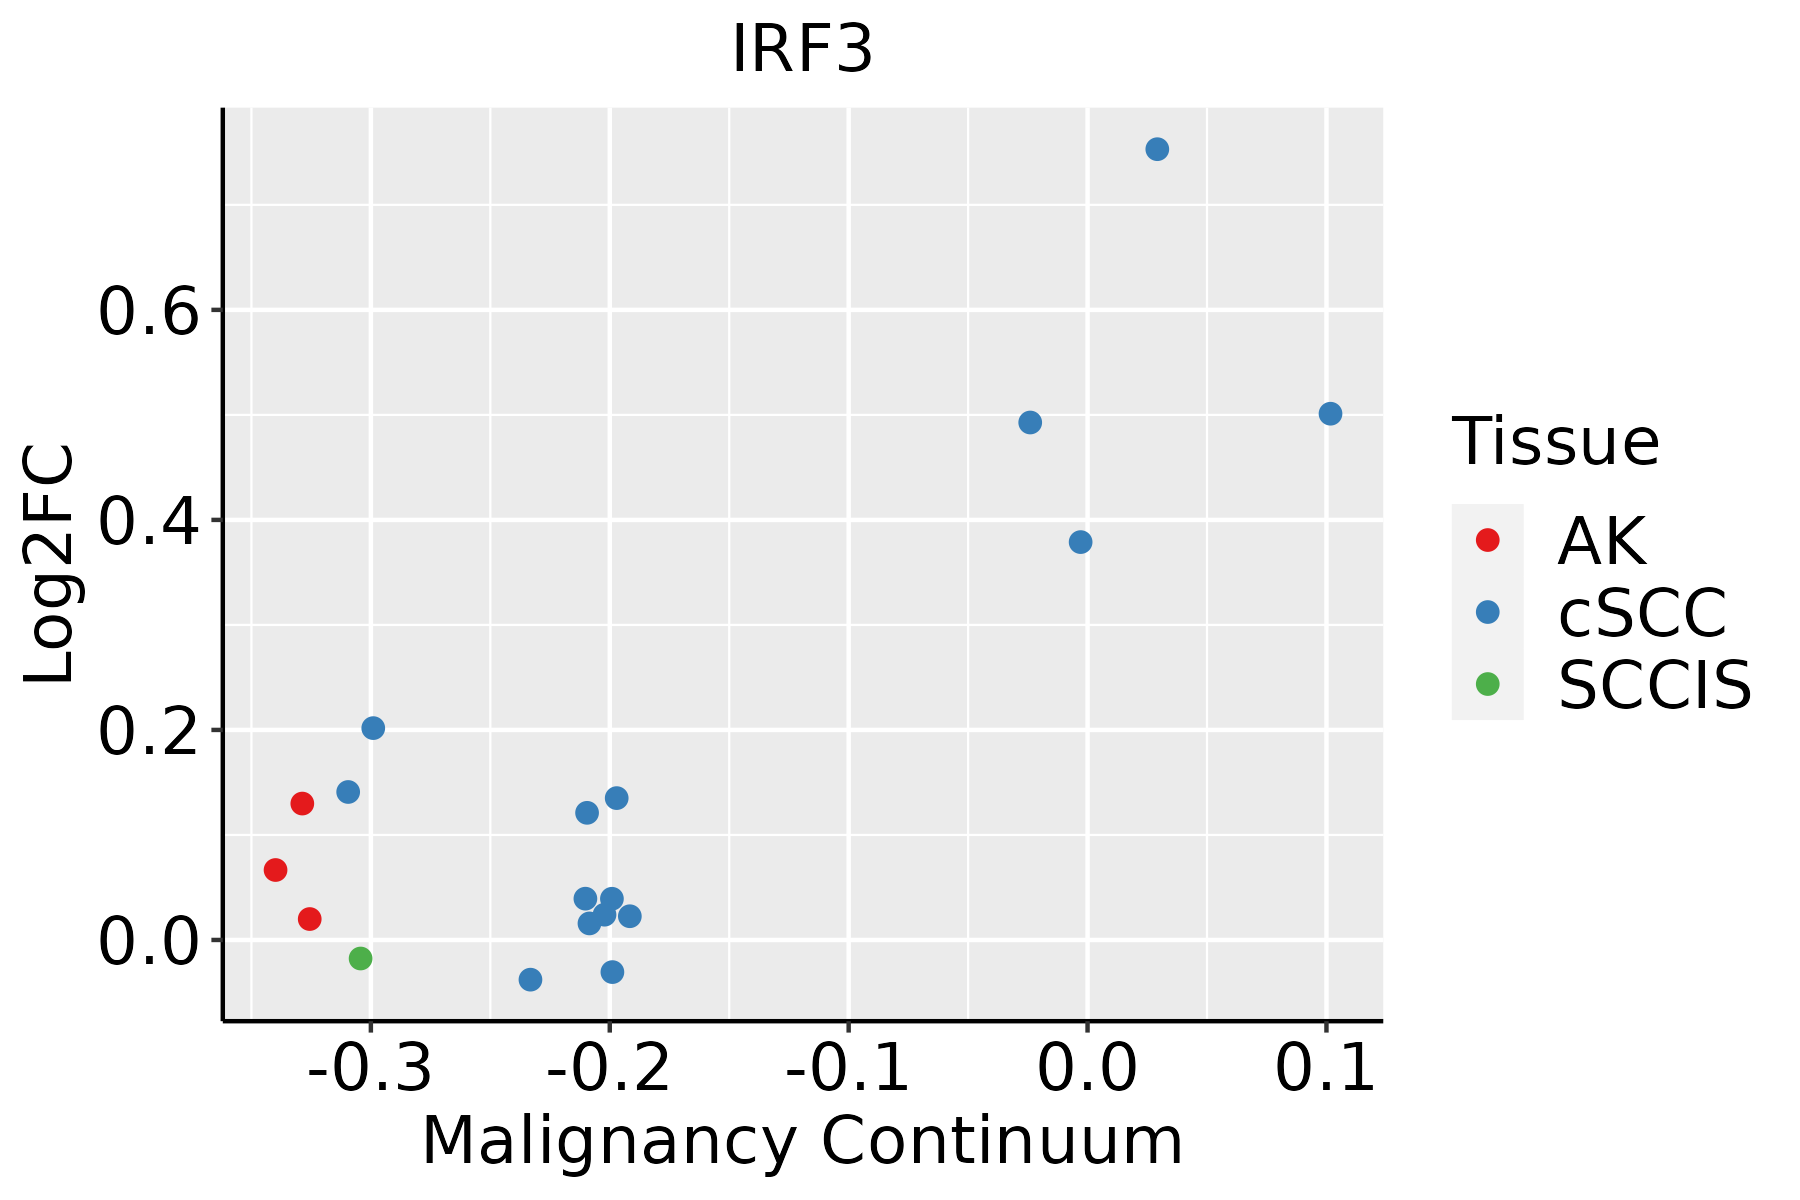 | AK: Actinic keratosis |
| cSCC: Cutaneous squamous cell carcinoma | ||
| SCCIS:squamous cell carcinoma in situ | ||
| Thyroid | 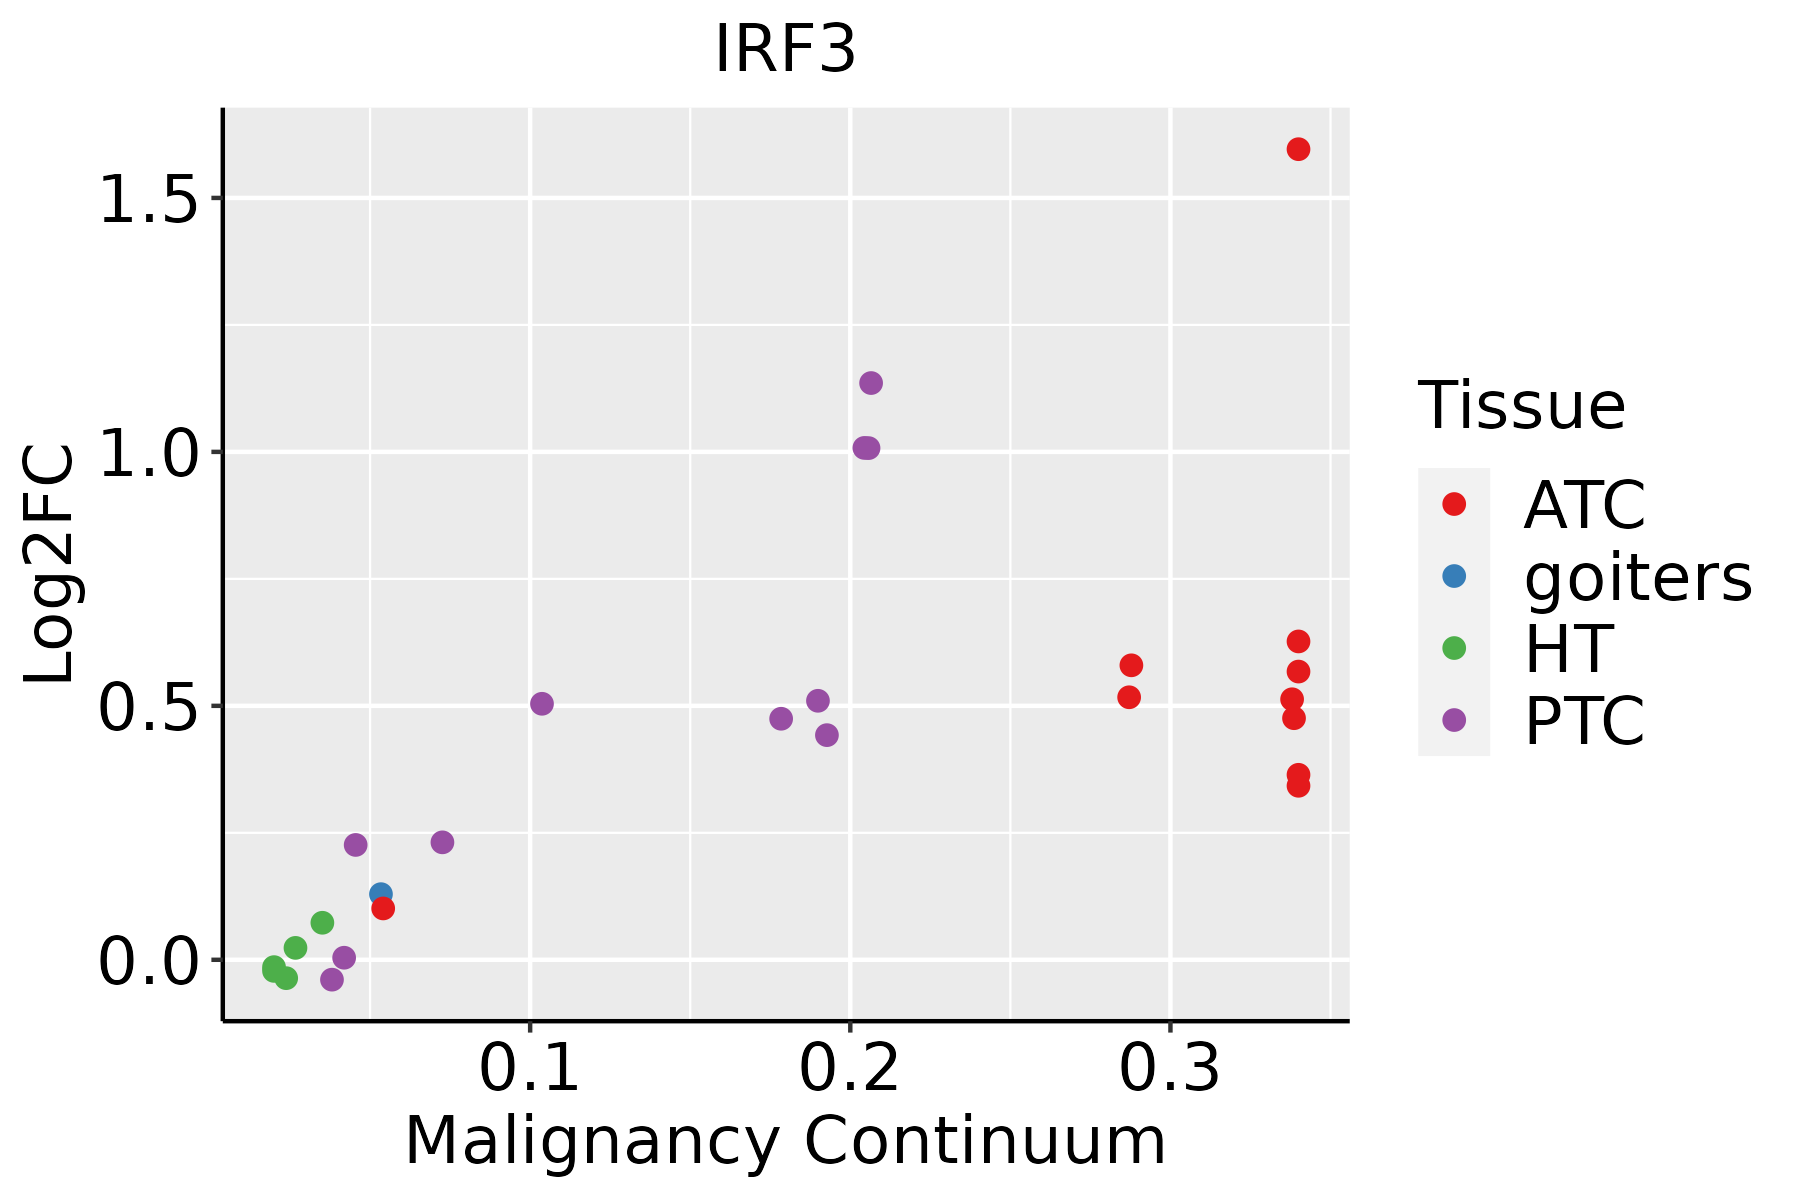 | ATC: Anaplastic thyroid cancer |
| HT: Hashimoto's thyroiditis | ||
| PTC: Papillary thyroid cancer |
| ∗log2FC in expression of this searched gene in stem-like cells from each diseased tissue sample relative to stem-like cells in normal samples in each tissue plotted against the malignancy continuum. Samples are colored based on if they are from different disease stage. |
Top |
Malignant transformation related pathway analysis |
| Find out the enriched GO biological processes and KEGG pathways involved in transition from healthy to precancer to cancer |
| Tissue | Disease Stage | Enriched GO biological Processes |
| Oral cavity | OSCC |  |
| Oral cavity | LP |  |
| Oral cavity | EOLP |  |
| Oral cavity | NEOLP |  |
| Esophagus | HGIN |  |
| ∗Top 15 enriched GO BP terms are showed in the bar plot of each disease state in each tissue. Each row represents a significant GO biological process which is colored according to the -log10(p.adjust). |
| Page: 1 2 3 4 5 6 7 8 9 |
| GO ID | Tissue | Disease Stage | Description | Gene Ratio | Bg Ratio | pvalue | p.adjust | Count |
| GO:004312220 | Esophagus | HGIN | regulation of I-kappaB kinase/NF-kappaB signaling | 63/2587 | 249/18723 | 8.91e-07 | 3.61e-05 | 63 |
| GO:000724918 | Esophagus | HGIN | I-kappaB kinase/NF-kappaB signaling | 67/2587 | 281/18723 | 3.84e-06 | 1.29e-04 | 67 |
| GO:004312317 | Esophagus | HGIN | positive regulation of I-kappaB kinase/NF-kappaB signaling | 49/2587 | 186/18723 | 4.22e-06 | 1.40e-04 | 49 |
| GO:003052220 | Esophagus | HGIN | intracellular receptor signaling pathway | 62/2587 | 265/18723 | 1.63e-05 | 4.50e-04 | 62 |
| GO:00027538 | Esophagus | HGIN | cytoplasmic pattern recognition receptor signaling pathway | 19/2587 | 60/18723 | 3.07e-04 | 5.15e-03 | 19 |
| GO:00395284 | Esophagus | HGIN | cytoplasmic pattern recognition receptor signaling pathway in response to virus | 13/2587 | 34/18723 | 3.51e-04 | 5.65e-03 | 13 |
| GO:00343406 | Esophagus | HGIN | response to type I interferon | 17/2587 | 58/18723 | 1.64e-03 | 1.82e-02 | 17 |
| GO:00324817 | Esophagus | HGIN | positive regulation of type I interferon production | 16/2587 | 58/18723 | 4.35e-03 | 3.84e-02 | 16 |
| GO:00985867 | Esophagus | HGIN | cellular response to virus | 21/2587 | 84/18723 | 4.35e-03 | 3.84e-02 | 21 |
| GO:000961517 | Esophagus | HGIN | response to virus | 69/2587 | 367/18723 | 4.39e-03 | 3.86e-02 | 69 |
| GO:00324794 | Esophagus | HGIN | regulation of type I interferon production | 23/2587 | 95/18723 | 4.51e-03 | 3.93e-02 | 23 |
| GO:00326064 | Esophagus | HGIN | type I interferon production | 23/2587 | 95/18723 | 4.51e-03 | 3.93e-02 | 23 |
| GO:000961518 | Esophagus | ESCC | response to virus | 238/8552 | 367/18723 | 6.65e-14 | 3.32e-12 | 238 |
| GO:004312318 | Esophagus | ESCC | positive regulation of I-kappaB kinase/NF-kappaB signaling | 132/8552 | 186/18723 | 2.07e-12 | 8.58e-11 | 132 |
| GO:0043122110 | Esophagus | ESCC | regulation of I-kappaB kinase/NF-kappaB signaling | 167/8552 | 249/18723 | 6.11e-12 | 2.32e-10 | 167 |
| GO:000724919 | Esophagus | ESCC | I-kappaB kinase/NF-kappaB signaling | 183/8552 | 281/18723 | 3.02e-11 | 1.01e-09 | 183 |
| GO:00516075 | Esophagus | ESCC | defense response to virus | 171/8552 | 265/18723 | 3.91e-10 | 1.05e-08 | 171 |
| GO:01405465 | Esophagus | ESCC | defense response to symbiont | 171/8552 | 265/18723 | 3.91e-10 | 1.05e-08 | 171 |
| GO:0030522110 | Esophagus | ESCC | intracellular receptor signaling pathway | 170/8552 | 265/18723 | 8.58e-10 | 2.09e-08 | 170 |
| GO:003434013 | Esophagus | ESCC | response to type I interferon | 48/8552 | 58/18723 | 6.18e-09 | 1.26e-07 | 48 |
| Page: 1 2 3 4 5 6 7 8 9 10 11 12 13 |
| Pathway ID | Tissue | Disease Stage | Description | Gene Ratio | Bg Ratio | pvalue | p.adjust | qvalue | Count |
| hsa0517139 | Esophagus | HGIN | Coronavirus disease - COVID-19 | 105/1383 | 232/8465 | 7.84e-26 | 5.11e-24 | 4.06e-24 | 105 |
| hsa0513139 | Esophagus | HGIN | Shigellosis | 71/1383 | 247/8465 | 4.89e-07 | 7.98e-06 | 6.34e-06 | 71 |
| hsa0516930 | Esophagus | HGIN | Epstein-Barr virus infection | 55/1383 | 202/8465 | 5.13e-05 | 6.19e-04 | 4.92e-04 | 55 |
| hsa0516730 | Esophagus | HGIN | Kaposi sarcoma-associated herpesvirus infection | 51/1383 | 194/8465 | 2.46e-04 | 2.69e-03 | 2.14e-03 | 51 |
| hsa052039 | Esophagus | HGIN | Viral carcinogenesis | 53/1383 | 204/8465 | 2.58e-04 | 2.71e-03 | 2.15e-03 | 53 |
| hsa0517029 | Esophagus | HGIN | Human immunodeficiency virus 1 infection | 51/1383 | 212/8465 | 2.16e-03 | 1.90e-02 | 1.51e-02 | 51 |
| hsa0541739 | Esophagus | HGIN | Lipid and atherosclerosis | 51/1383 | 215/8465 | 2.95e-03 | 2.41e-02 | 1.91e-02 | 51 |
| hsa046219 | Esophagus | HGIN | NOD-like receptor signaling pathway | 45/1383 | 186/8465 | 3.40e-03 | 2.54e-02 | 2.02e-02 | 45 |
| hsa0516420 | Esophagus | HGIN | Influenza A | 42/1383 | 171/8465 | 3.41e-03 | 2.54e-02 | 2.02e-02 | 42 |
| hsa0516330 | Esophagus | HGIN | Human cytomegalovirus infection | 51/1383 | 225/8465 | 7.67e-03 | 4.63e-02 | 3.68e-02 | 51 |
| hsa05171115 | Esophagus | HGIN | Coronavirus disease - COVID-19 | 105/1383 | 232/8465 | 7.84e-26 | 5.11e-24 | 4.06e-24 | 105 |
| hsa05131114 | Esophagus | HGIN | Shigellosis | 71/1383 | 247/8465 | 4.89e-07 | 7.98e-06 | 6.34e-06 | 71 |
| hsa05169114 | Esophagus | HGIN | Epstein-Barr virus infection | 55/1383 | 202/8465 | 5.13e-05 | 6.19e-04 | 4.92e-04 | 55 |
| hsa05167114 | Esophagus | HGIN | Kaposi sarcoma-associated herpesvirus infection | 51/1383 | 194/8465 | 2.46e-04 | 2.69e-03 | 2.14e-03 | 51 |
| hsa0520315 | Esophagus | HGIN | Viral carcinogenesis | 53/1383 | 204/8465 | 2.58e-04 | 2.71e-03 | 2.15e-03 | 53 |
| hsa05170112 | Esophagus | HGIN | Human immunodeficiency virus 1 infection | 51/1383 | 212/8465 | 2.16e-03 | 1.90e-02 | 1.51e-02 | 51 |
| hsa05417114 | Esophagus | HGIN | Lipid and atherosclerosis | 51/1383 | 215/8465 | 2.95e-03 | 2.41e-02 | 1.91e-02 | 51 |
| hsa0462114 | Esophagus | HGIN | NOD-like receptor signaling pathway | 45/1383 | 186/8465 | 3.40e-03 | 2.54e-02 | 2.02e-02 | 45 |
| hsa05164110 | Esophagus | HGIN | Influenza A | 42/1383 | 171/8465 | 3.41e-03 | 2.54e-02 | 2.02e-02 | 42 |
| hsa05163113 | Esophagus | HGIN | Human cytomegalovirus infection | 51/1383 | 225/8465 | 7.67e-03 | 4.63e-02 | 3.68e-02 | 51 |
| Page: 1 2 3 4 5 6 7 8 9 10 |
Top |
Cell-cell communication analysis |
| Identification of potential cell-cell interactions between two cell types and their ligand-receptor pairs for different disease states |
| Ligand | Receptor | LRpair | Pathway | Tissue | Disease Stage |
| Page: 1 |
Top |
Single-cell gene regulatory network inference analysis |
| Find out the significant the regulons (TFs) and the target genes of each regulon across cell types for different disease states |
| TF | Cell Type | Tissue | Disease Stage | Target Gene | RSS | Regulon Activity |
| IRF3 | STM | Breast | IDC | TUBA3D,SCNN1A,VWA1, etc. | 2.23e-01 |  |
| IRF3 | GDT | Endometrium | Healthy | NCOA5,DHX37,AC104365.1, etc. | 4.39e-01 |  |
| IRF3 | CD8TCM | Lung | ADJ | GIMAP7,CATSPERB,AC093010.2, etc. | 2.72e-01 |  |
| IRF3 | TH1 | Lung | ADJ | GIMAP7,CATSPERB,AC093010.2, etc. | 1.18e-01 | |
| IRF3 | TH1 | Lung | IAC | PTRH2,RAB37,LINC02273, etc. | 1.58e-01 |  |
| IRF3 | PLA | Stomach | CAG | C10orf54,NIPSNAP1,FAM46C, etc. | 4.61e-01 |  |
| IRF3 | PLA | Stomach | SIM | C10orf54,NIPSNAP1,FAM46C, etc. | 5.40e-01 |  |
| IRF3 | PLA | Thyroid | Healthy | PIK3R3,MLF1,EPHA4, etc. | 6.58e-01 |  |
| IRF3 | PLA | Thyroid | HT | PIK3R3,MLF1,EPHA4, etc. | 5.79e-01 |  |
| ∗The dot plots of a searched regulon are shown for all cell subpopulations in each disease state of each tissue based on the regulon specific score inferred using pySCENIC and by calculating the average expression. |
| Page: 1 |
Top |
Somatic mutation of malignant transformation related genes |
| Annotation of somatic variants for genes involved in malignant transformation |
| Hugo Symbol | Variant Class | Variant Classification | dbSNP RS | HGVSc | HGVSp | HGVSp Short | SWISSPROT | BIOTYPE | SIFT | PolyPhen | Tumor Sample Barcode | Tissue | Histology | Sex | Age | Stage | Therapy Types | Drugs | Outcome |
| IRF3 | SNV | Missense_Mutation | novel | c.1330N>A | p.Pro444Thr | p.P444T | Q14653 | protein_coding | deleterious_low_confidence(0) | benign(0.001) | TCGA-A8-A09Z-01 | Breast | breast invasive carcinoma | Female | >=65 | I/II | Unknown | Unknown | SD |
| IRF3 | SNV | Missense_Mutation | c.950N>A | p.Gly317Glu | p.G317E | Q14653 | protein_coding | tolerated(0.18) | probably_damaging(0.996) | TCGA-AC-A23H-01 | Breast | breast invasive carcinoma | Female | >=65 | I/II | Unknown | Unknown | PD | |
| IRF3 | SNV | Missense_Mutation | novel | c.1059N>G | p.Cys353Trp | p.C353W | Q14653 | protein_coding | tolerated(0.05) | benign(0.318) | TCGA-BH-A18G-01 | Breast | breast invasive carcinoma | Female | >=65 | I/II | Unknown | Unknown | SD |
| IRF3 | SNV | Missense_Mutation | rs749460165 | c.991N>A | p.Ala331Thr | p.A331T | Q14653 | protein_coding | deleterious(0.04) | benign(0.001) | TCGA-VS-A8QH-01 | Cervix | cervical & endocervical cancer | Female | >=65 | I/II | Chemotherapy | gemcitabine | PD |
| IRF3 | SNV | Missense_Mutation | c.346N>T | p.Asp116Tyr | p.D116Y | Q14653 | protein_coding | deleterious(0) | benign(0.24) | TCGA-A6-5665-01 | Colorectum | colon adenocarcinoma | Female | >=65 | I/II | Unknown | Unknown | PD | |
| IRF3 | SNV | Missense_Mutation | c.782N>C | p.Val261Ala | p.V261A | Q14653 | protein_coding | tolerated(0.05) | possibly_damaging(0.749) | TCGA-A6-6780-01 | Colorectum | colon adenocarcinoma | Male | >=65 | I/II | Unknown | Unknown | SD | |
| IRF3 | SNV | Missense_Mutation | c.298N>A | p.Pro100Thr | p.P100T | Q14653 | protein_coding | tolerated(0.07) | benign(0.323) | TCGA-AZ-4313-01 | Colorectum | colon adenocarcinoma | Female | <65 | I/II | Unknown | Unknown | SD | |
| IRF3 | SNV | Missense_Mutation | rs377410193 | c.271N>T | p.Arg91Cys | p.R91C | Q14653 | protein_coding | deleterious(0.01) | benign(0.017) | TCGA-AG-A016-01 | Colorectum | rectum adenocarcinoma | Male | <65 | III/IV | Chemotherapy | 5-fluorouracil | SD |
| IRF3 | SNV | Missense_Mutation | c.242N>A | p.Arg81His | p.R81H | Q14653 | protein_coding | deleterious(0.02) | benign(0.406) | TCGA-AG-A02N-01 | Colorectum | rectum adenocarcinoma | Male | >=65 | I/II | Chemotherapy | folinic | CR | |
| IRF3 | SNV | Missense_Mutation | novel | c.733C>A | p.Leu245Met | p.L245M | Q14653 | protein_coding | deleterious(0) | probably_damaging(0.998) | TCGA-A5-A0G1-01 | Endometrium | uterine corpus endometrioid carcinoma | Female | >=65 | I/II | Unknown | Unknown | SD |
| Page: 1 2 3 |
Top |
Related drugs of malignant transformation related genes |
| Identification of chemicals and drugs interact with genes involved in malignant transfromation |
| (DGIdb 4.0) |
| Entrez ID | Symbol | Category | Interaction Types | Drug Claim Name | Drug Name | PMIDs |
| 3661 | IRF3 | KINASE, TRANSCRIPTION FACTOR | IFN | 10692430 |
| Page: 1 |

Copyright 2023-Present -The University of Texas Health Science Center at Houston |