
|
|||||
|
 | |
| |
| |
| |
| |
| |
|
Gene: INE1 |
Gene summary for INE1 |
| Gene information | Species | Human | Gene symbol | INE1 | Gene ID | 8552 |
| Gene name | inactivation escape 1 | |
| Gene Alias | NCRNA00010 | |
| Cytomap | Xp11.3 | |
| Gene Type | ncRNA | GO ID | NA | UniProtAcc | NA |
Top |
Malignant transformation analysis |
| Identification of the aberrant gene expression in precancerous and cancerous lesions by comparing the gene expression of stem-like cells in diseased tissues with normal stem cells |
| Entrez ID | Symbol | Replicates | Species | Organ | Tissue | Adj P-value | Log2FC | Malignancy |
| 8552 | INE1 | HCC1 | Human | Liver | HCC | 2.10e-06 | 1.87e+00 | 0.5336 |
| 8552 | INE1 | HCC2 | Human | Liver | HCC | 2.78e-04 | 7.61e-01 | 0.5341 |
| 8552 | INE1 | HCC5 | Human | Liver | HCC | 2.57e-02 | 4.34e-01 | 0.4932 |
| Page: 1 |
| Tissue | Expression Dynamics | Abbreviation |
| Liver | 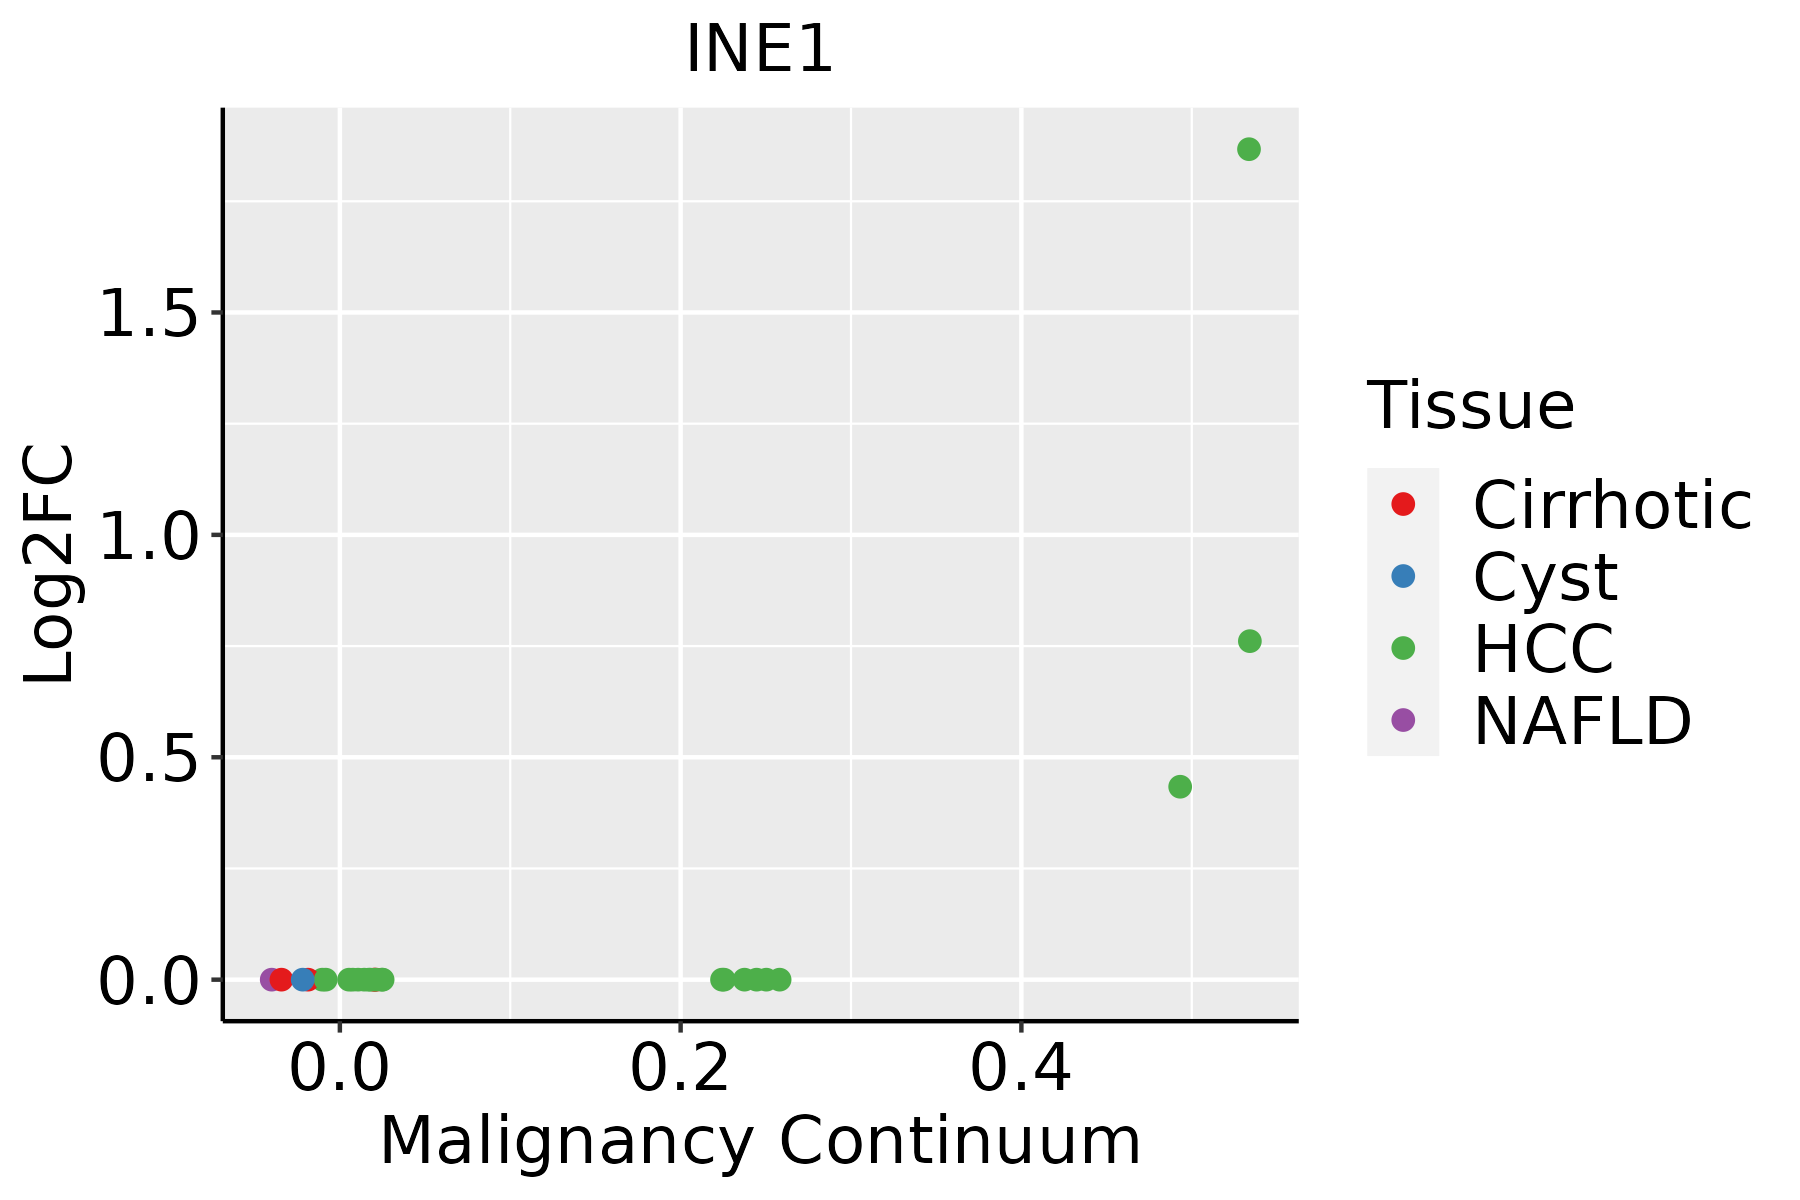 | HCC: Hepatocellular carcinoma |
| NAFLD: Non-alcoholic fatty liver disease |
| ∗log2FC in expression of this searched gene in stem-like cells from each diseased tissue sample relative to stem-like cells in normal samples in each tissue plotted against the malignancy continuum. Samples are colored based on if they are from different disease stage. |
Top |
Malignant transformation related pathway analysis |
| Find out the enriched GO biological processes and KEGG pathways involved in transition from healthy to precancer to cancer |
| Tissue | Disease Stage | Enriched GO biological Processes |
| Oral cavity | OSCC |  |
| Oral cavity | LP |  |
| Oral cavity | EOLP |  |
| Oral cavity | NEOLP |  |
| Esophagus | HGIN |  |
| ∗Top 15 enriched GO BP terms are showed in the bar plot of each disease state in each tissue. Each row represents a significant GO biological process which is colored according to the -log10(p.adjust). |
| Page: 1 2 3 4 5 6 7 8 9 |
| GO ID | Tissue | Disease Stage | Description | Gene Ratio | Bg Ratio | pvalue | p.adjust | Count |
| GO:200123317 | Endometrium | EEC | regulation of apoptotic signaling pathway | 91/2168 | 356/18723 | 1.31e-13 | 3.28e-11 | 91 |
| GO:001081016 | Endometrium | EEC | regulation of cell-substrate adhesion | 63/2168 | 221/18723 | 5.17e-12 | 8.85e-10 | 63 |
| GO:003158915 | Endometrium | EEC | cell-substrate adhesion | 87/2168 | 363/18723 | 1.95e-11 | 3.00e-09 | 87 |
| GO:004206017 | Endometrium | EEC | wound healing | 92/2168 | 422/18723 | 1.12e-09 | 9.58e-08 | 92 |
| GO:000195213 | Endometrium | EEC | regulation of cell-matrix adhesion | 37/2168 | 128/18723 | 8.21e-08 | 4.23e-06 | 37 |
| GO:005254717 | Endometrium | EEC | regulation of peptidase activity | 91/2168 | 461/18723 | 2.00e-07 | 8.93e-06 | 91 |
| GO:200123417 | Endometrium | EEC | negative regulation of apoptotic signaling pathway | 53/2168 | 224/18723 | 2.53e-07 | 1.09e-05 | 53 |
| GO:009719117 | Endometrium | EEC | extrinsic apoptotic signaling pathway | 52/2168 | 219/18723 | 2.91e-07 | 1.20e-05 | 52 |
| GO:200123617 | Endometrium | EEC | regulation of extrinsic apoptotic signaling pathway | 40/2168 | 151/18723 | 3.33e-07 | 1.33e-05 | 40 |
| GO:000716014 | Endometrium | EEC | cell-matrix adhesion | 54/2168 | 233/18723 | 3.98e-07 | 1.56e-05 | 54 |
| GO:004586117 | Endometrium | EEC | negative regulation of proteolysis | 72/2168 | 351/18723 | 8.46e-07 | 2.98e-05 | 72 |
| GO:005254817 | Endometrium | EEC | regulation of endopeptidase activity | 82/2168 | 432/18723 | 3.96e-06 | 1.04e-04 | 82 |
| GO:200014613 | Endometrium | EEC | negative regulation of cell motility | 71/2168 | 359/18723 | 3.98e-06 | 1.04e-04 | 71 |
| GO:005127113 | Endometrium | EEC | negative regulation of cellular component movement | 72/2168 | 367/18723 | 4.59e-06 | 1.15e-04 | 72 |
| GO:003033612 | Endometrium | EEC | negative regulation of cell migration | 67/2168 | 344/18723 | 1.24e-05 | 2.54e-04 | 67 |
| GO:004001312 | Endometrium | EEC | negative regulation of locomotion | 74/2168 | 391/18723 | 1.28e-05 | 2.59e-04 | 74 |
| GO:000756815 | Endometrium | EEC | aging | 66/2168 | 339/18723 | 1.46e-05 | 2.87e-04 | 66 |
| GO:005134615 | Endometrium | EEC | negative regulation of hydrolase activity | 72/2168 | 379/18723 | 1.46e-05 | 2.87e-04 | 72 |
| GO:000689815 | Endometrium | EEC | receptor-mediated endocytosis | 51/2168 | 244/18723 | 1.89e-05 | 3.50e-04 | 51 |
| GO:003010014 | Endometrium | EEC | regulation of endocytosis | 45/2168 | 211/18723 | 3.40e-05 | 5.78e-04 | 45 |
| Page: 1 2 3 4 5 6 7 8 9 10 11 12 13 14 15 16 17 18 19 20 21 22 23 24 25 26 27 28 29 30 31 32 33 |
| Pathway ID | Tissue | Disease Stage | Description | Gene Ratio | Bg Ratio | pvalue | p.adjust | qvalue | Count |
| Page: 1 |
Top |
Cell-cell communication analysis |
| Identification of potential cell-cell interactions between two cell types and their ligand-receptor pairs for different disease states |
| Ligand | Receptor | LRpair | Pathway | Tissue | Disease Stage |
| Page: 1 |
Top |
Single-cell gene regulatory network inference analysis |
| Find out the significant the regulons (TFs) and the target genes of each regulon across cell types for different disease states |
| TF | Cell Type | Tissue | Disease Stage | Target Gene | RSS | Regulon Activity |
| ∗The dot plots of a searched regulon are shown for all cell subpopulations in each disease state of each tissue based on the regulon specific score inferred using pySCENIC and by calculating the average expression. |
| Page: 1 |
Top |
Somatic mutation of malignant transformation related genes |
| Annotation of somatic variants for genes involved in malignant transformation |
| Hugo Symbol | Variant Class | Variant Classification | dbSNP RS | HGVSc | HGVSp | HGVSp Short | SWISSPROT | BIOTYPE | SIFT | PolyPhen | Tumor Sample Barcode | Tissue | Histology | Sex | Age | Stage | Therapy Types | Drugs | Outcome |
| Page: 1 |
Top |
Related drugs of malignant transformation related genes |
| Identification of chemicals and drugs interact with genes involved in malignant transfromation |
| (DGIdb 4.0) |
| Entrez ID | Symbol | Category | Interaction Types | Drug Claim Name | Drug Name | PMIDs |
| Page: 1 |

Copyright 2023-Present -The University of Texas Health Science Center at Houston |