
|
|||||
|
 | |
| |
| |
| |
| |
| |
|
Gene: IMPA2 |
Gene summary for IMPA2 |
| Gene information | Species | Human | Gene symbol | IMPA2 | Gene ID | 3613 |
| Gene name | inositol monophosphatase 2 | |
| Gene Alias | IMPA2 | |
| Cytomap | 18p11.21 | |
| Gene Type | protein-coding | GO ID | GO:0005975 | UniProtAcc | O14732 |
Top |
Malignant transformation analysis |
| Identification of the aberrant gene expression in precancerous and cancerous lesions by comparing the gene expression of stem-like cells in diseased tissues with normal stem cells |
| Entrez ID | Symbol | Replicates | Species | Organ | Tissue | Adj P-value | Log2FC | Malignancy |
| 3613 | IMPA2 | GSM4909281 | Human | Breast | IDC | 1.34e-18 | 5.05e-01 | 0.21 |
| 3613 | IMPA2 | GSM4909282 | Human | Breast | IDC | 8.30e-35 | 7.07e-01 | -0.0288 |
| 3613 | IMPA2 | GSM4909285 | Human | Breast | IDC | 1.47e-04 | 2.35e-01 | 0.21 |
| 3613 | IMPA2 | GSM4909286 | Human | Breast | IDC | 2.44e-19 | 4.63e-01 | 0.1081 |
| 3613 | IMPA2 | GSM4909287 | Human | Breast | IDC | 5.98e-09 | 4.32e-01 | 0.2057 |
| 3613 | IMPA2 | GSM4909290 | Human | Breast | IDC | 9.71e-03 | 2.78e-01 | 0.2096 |
| 3613 | IMPA2 | GSM4909304 | Human | Breast | IDC | 3.85e-07 | 2.63e-01 | 0.1636 |
| 3613 | IMPA2 | GSM4909319 | Human | Breast | IDC | 1.80e-06 | -1.27e-02 | 0.1563 |
| 3613 | IMPA2 | DCIS2 | Human | Breast | DCIS | 1.84e-12 | -3.66e-02 | 0.0085 |
| 3613 | IMPA2 | HTA11_3410_2000001011 | Human | Colorectum | AD | 6.03e-05 | 2.15e-01 | 0.0155 |
| 3613 | IMPA2 | HTA11_2487_2000001011 | Human | Colorectum | SER | 6.53e-05 | 5.49e-01 | -0.1808 |
| 3613 | IMPA2 | HTA11_1938_2000001011 | Human | Colorectum | AD | 2.39e-02 | 3.34e-01 | -0.0811 |
| 3613 | IMPA2 | HTA11_347_2000001011 | Human | Colorectum | AD | 1.63e-28 | 9.46e-01 | -0.1954 |
| 3613 | IMPA2 | HTA11_411_2000001011 | Human | Colorectum | SER | 5.15e-03 | 7.66e-01 | -0.2602 |
| 3613 | IMPA2 | HTA11_3361_2000001011 | Human | Colorectum | AD | 7.51e-05 | 6.04e-01 | -0.1207 |
| 3613 | IMPA2 | HTA11_696_2000001011 | Human | Colorectum | AD | 2.31e-08 | 5.05e-01 | -0.1464 |
| 3613 | IMPA2 | HTA11_866_2000001011 | Human | Colorectum | AD | 1.53e-02 | 3.74e-01 | -0.1001 |
| 3613 | IMPA2 | HTA11_1391_2000001011 | Human | Colorectum | AD | 2.38e-03 | 5.17e-01 | -0.059 |
| 3613 | IMPA2 | HTA11_2992_2000001011 | Human | Colorectum | SER | 5.72e-04 | 6.61e-01 | -0.1706 |
| 3613 | IMPA2 | HTA11_7862_2000001011 | Human | Colorectum | AD | 1.02e-04 | 5.43e-01 | -0.0179 |
| Page: 1 2 3 4 5 6 7 8 |
| Tissue | Expression Dynamics | Abbreviation |
| Breast |  | IDC: Invasive ductal carcinoma |
| DCIS: Ductal carcinoma in situ | ||
| Precancer(BRCA1-mut): Precancerous lesion from BRCA1 mutation carriers | ||
| Colorectum (GSE201348) |  | FAP: Familial adenomatous polyposis |
| CRC: Colorectal cancer | ||
| Colorectum (HTA11) |  | AD: Adenomas |
| SER: Sessile serrated lesions | ||
| MSI-H: Microsatellite-high colorectal cancer | ||
| MSS: Microsatellite stable colorectal cancer | ||
| Esophagus | 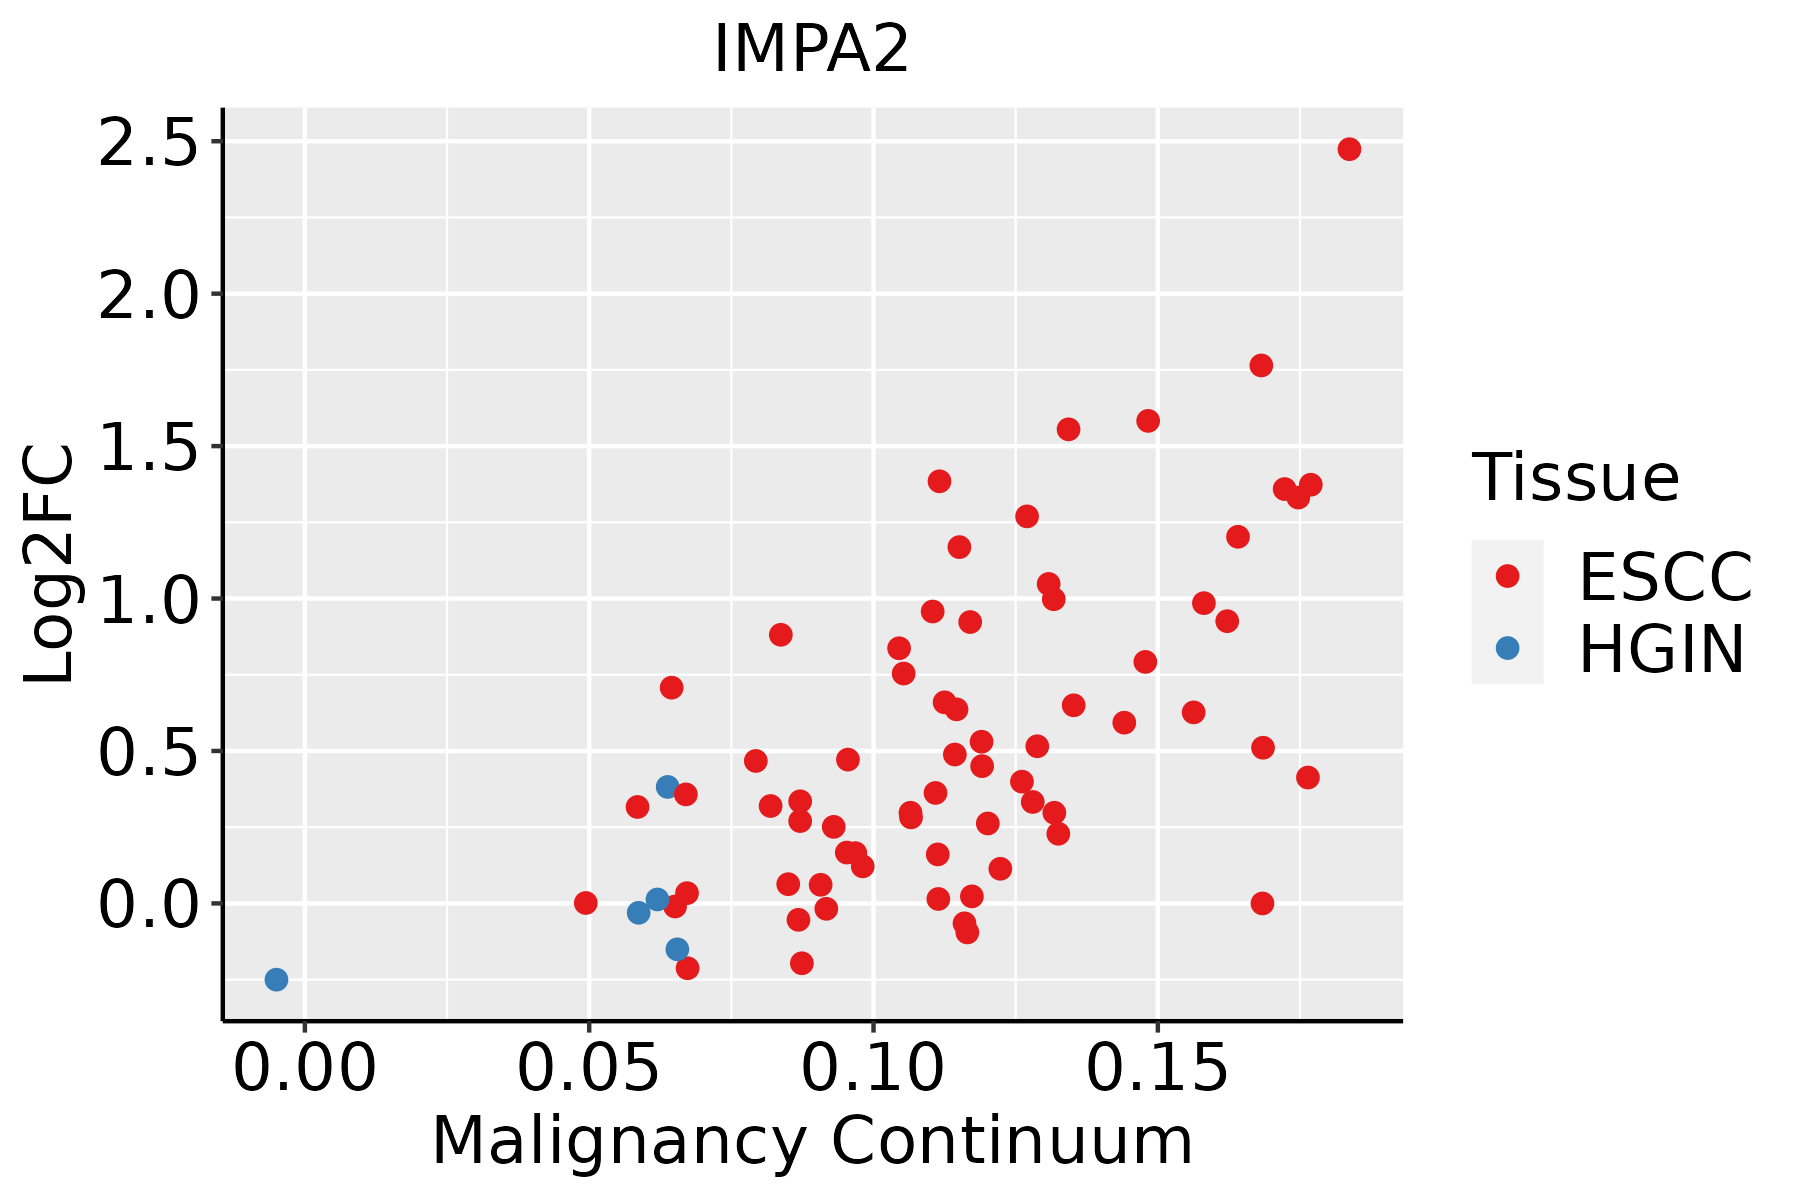 | ESCC: Esophageal squamous cell carcinoma |
| HGIN: High-grade intraepithelial neoplasias | ||
| LGIN: Low-grade intraepithelial neoplasias | ||
| Liver | 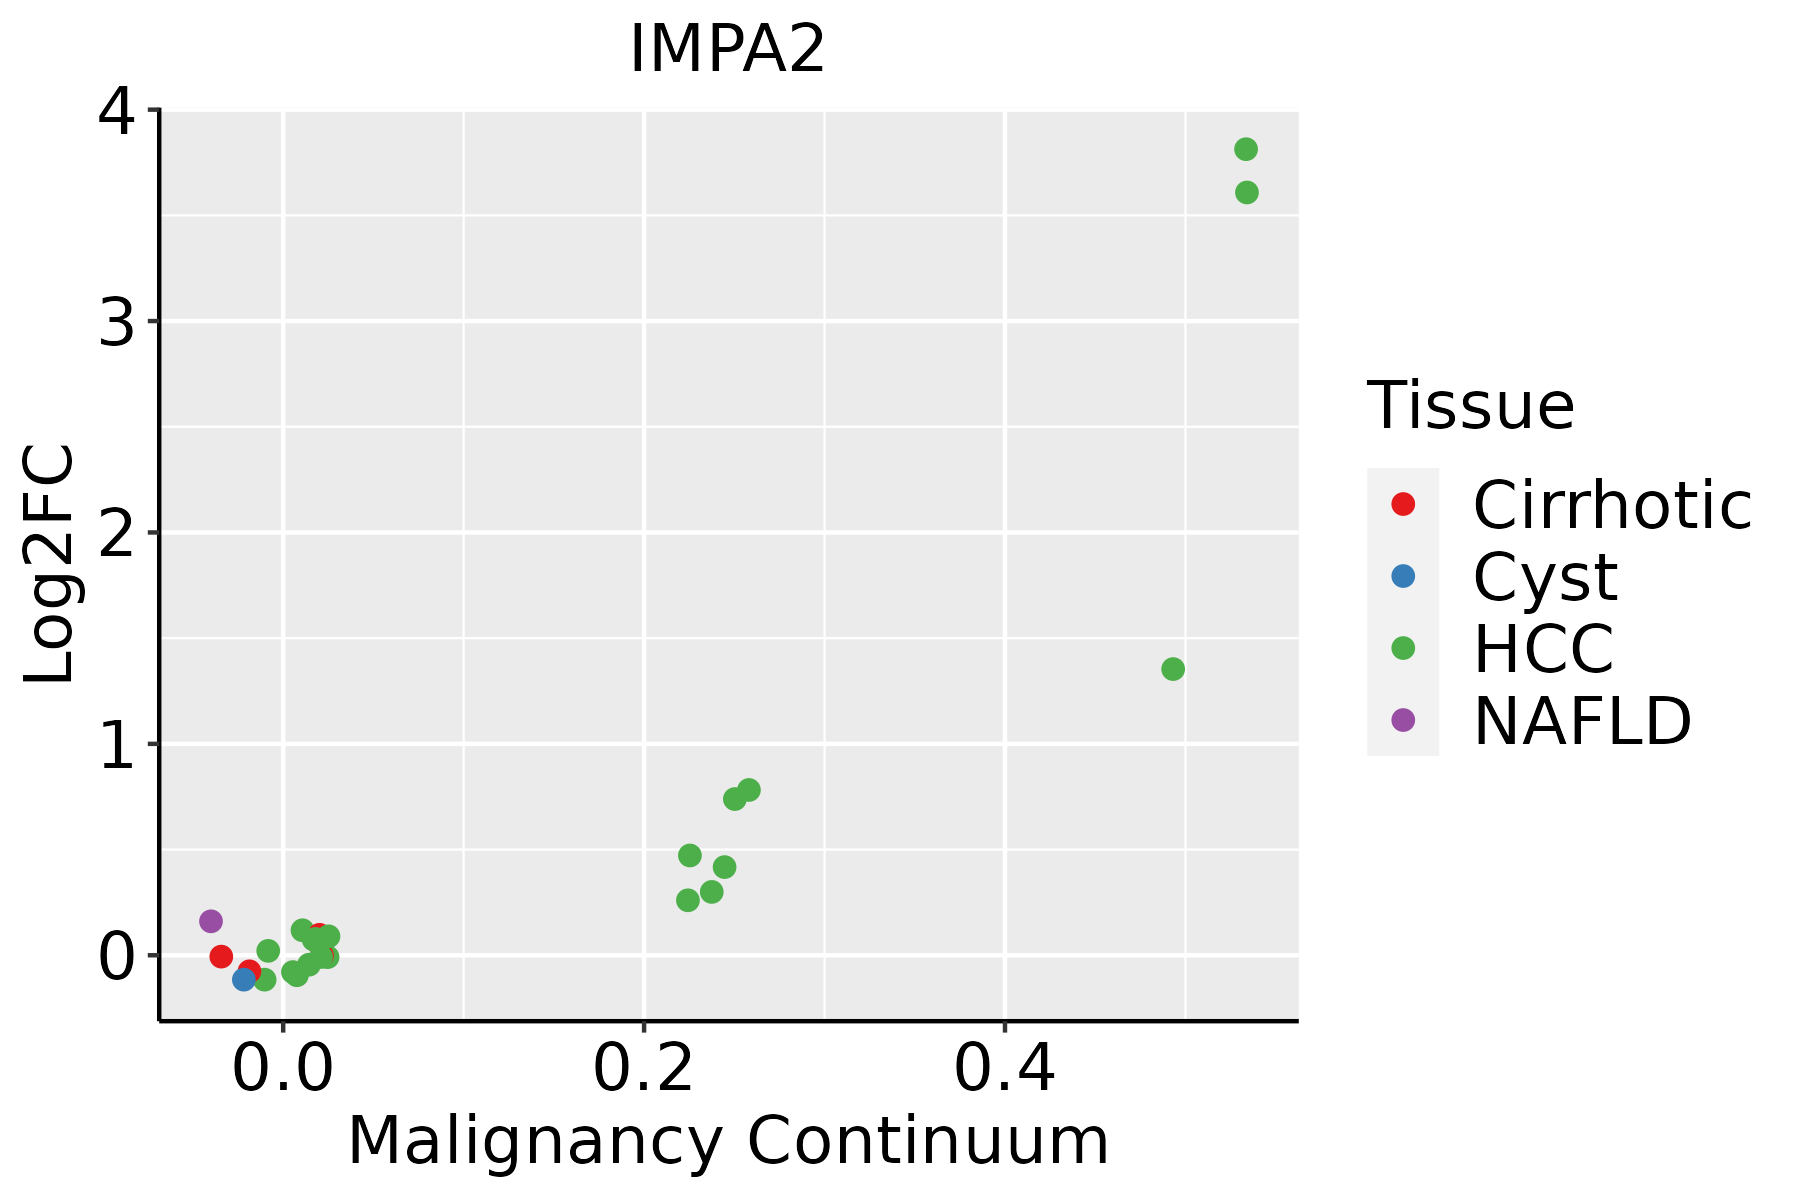 | HCC: Hepatocellular carcinoma |
| NAFLD: Non-alcoholic fatty liver disease | ||
| Oral Cavity | 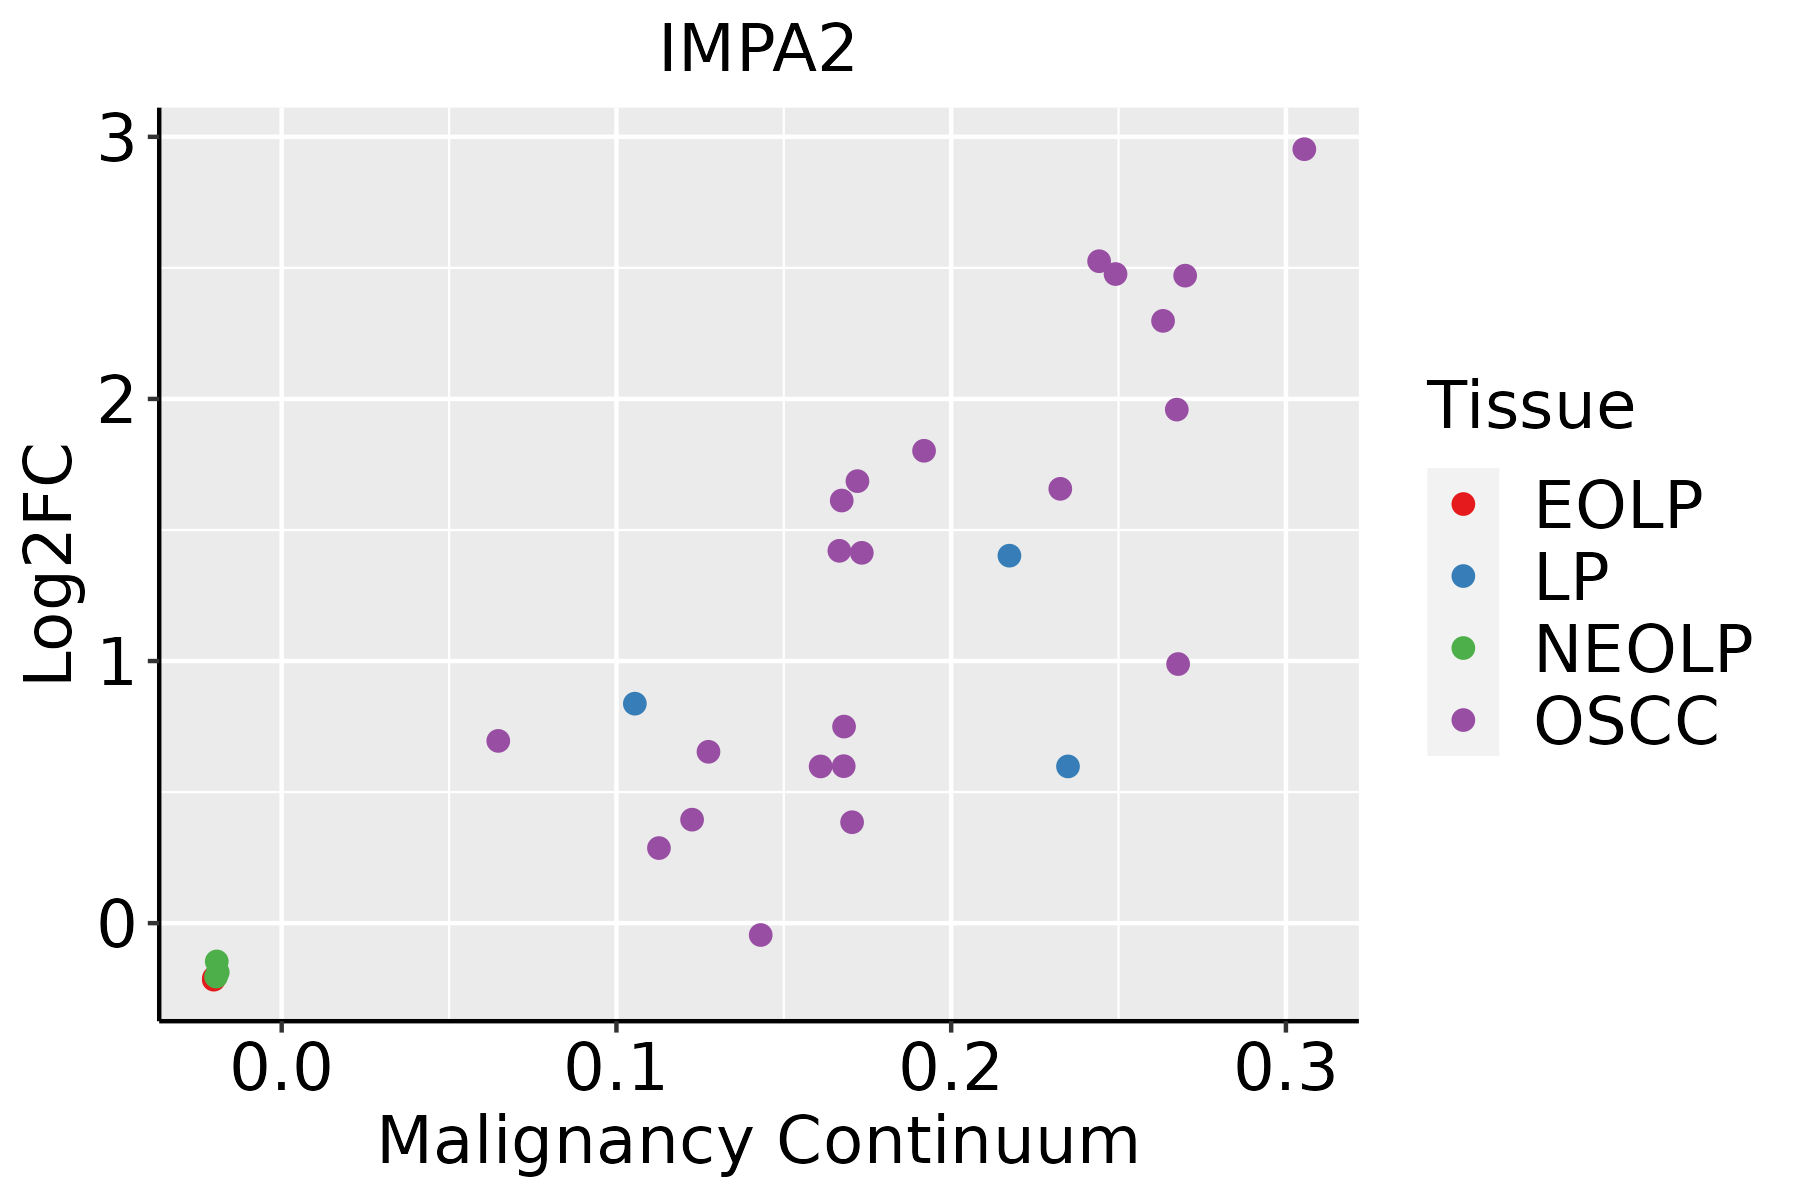 | EOLP: Erosive Oral lichen planus |
| LP: leukoplakia | ||
| NEOLP: Non-erosive oral lichen planus | ||
| OSCC: Oral squamous cell carcinoma | ||
| Skin | 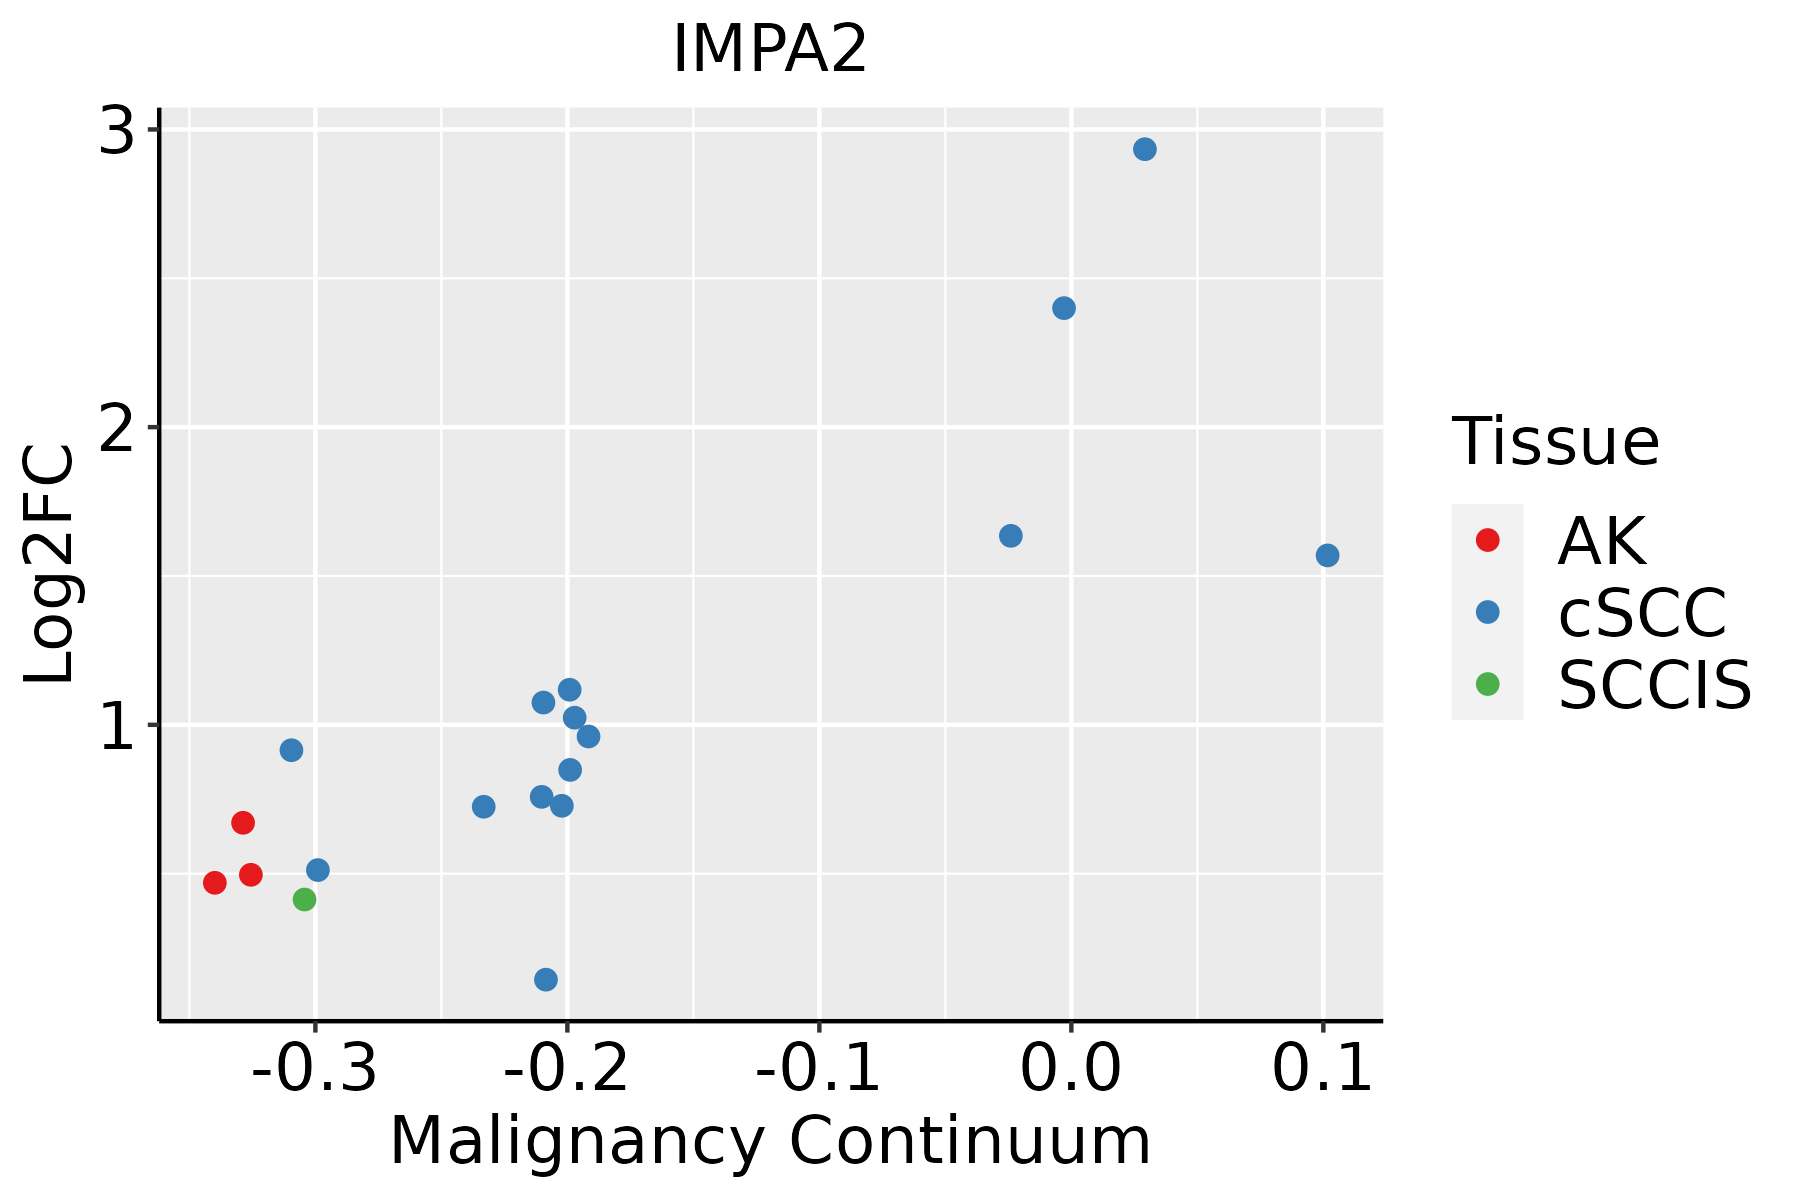 | AK: Actinic keratosis |
| cSCC: Cutaneous squamous cell carcinoma | ||
| SCCIS:squamous cell carcinoma in situ | ||
| Thyroid | 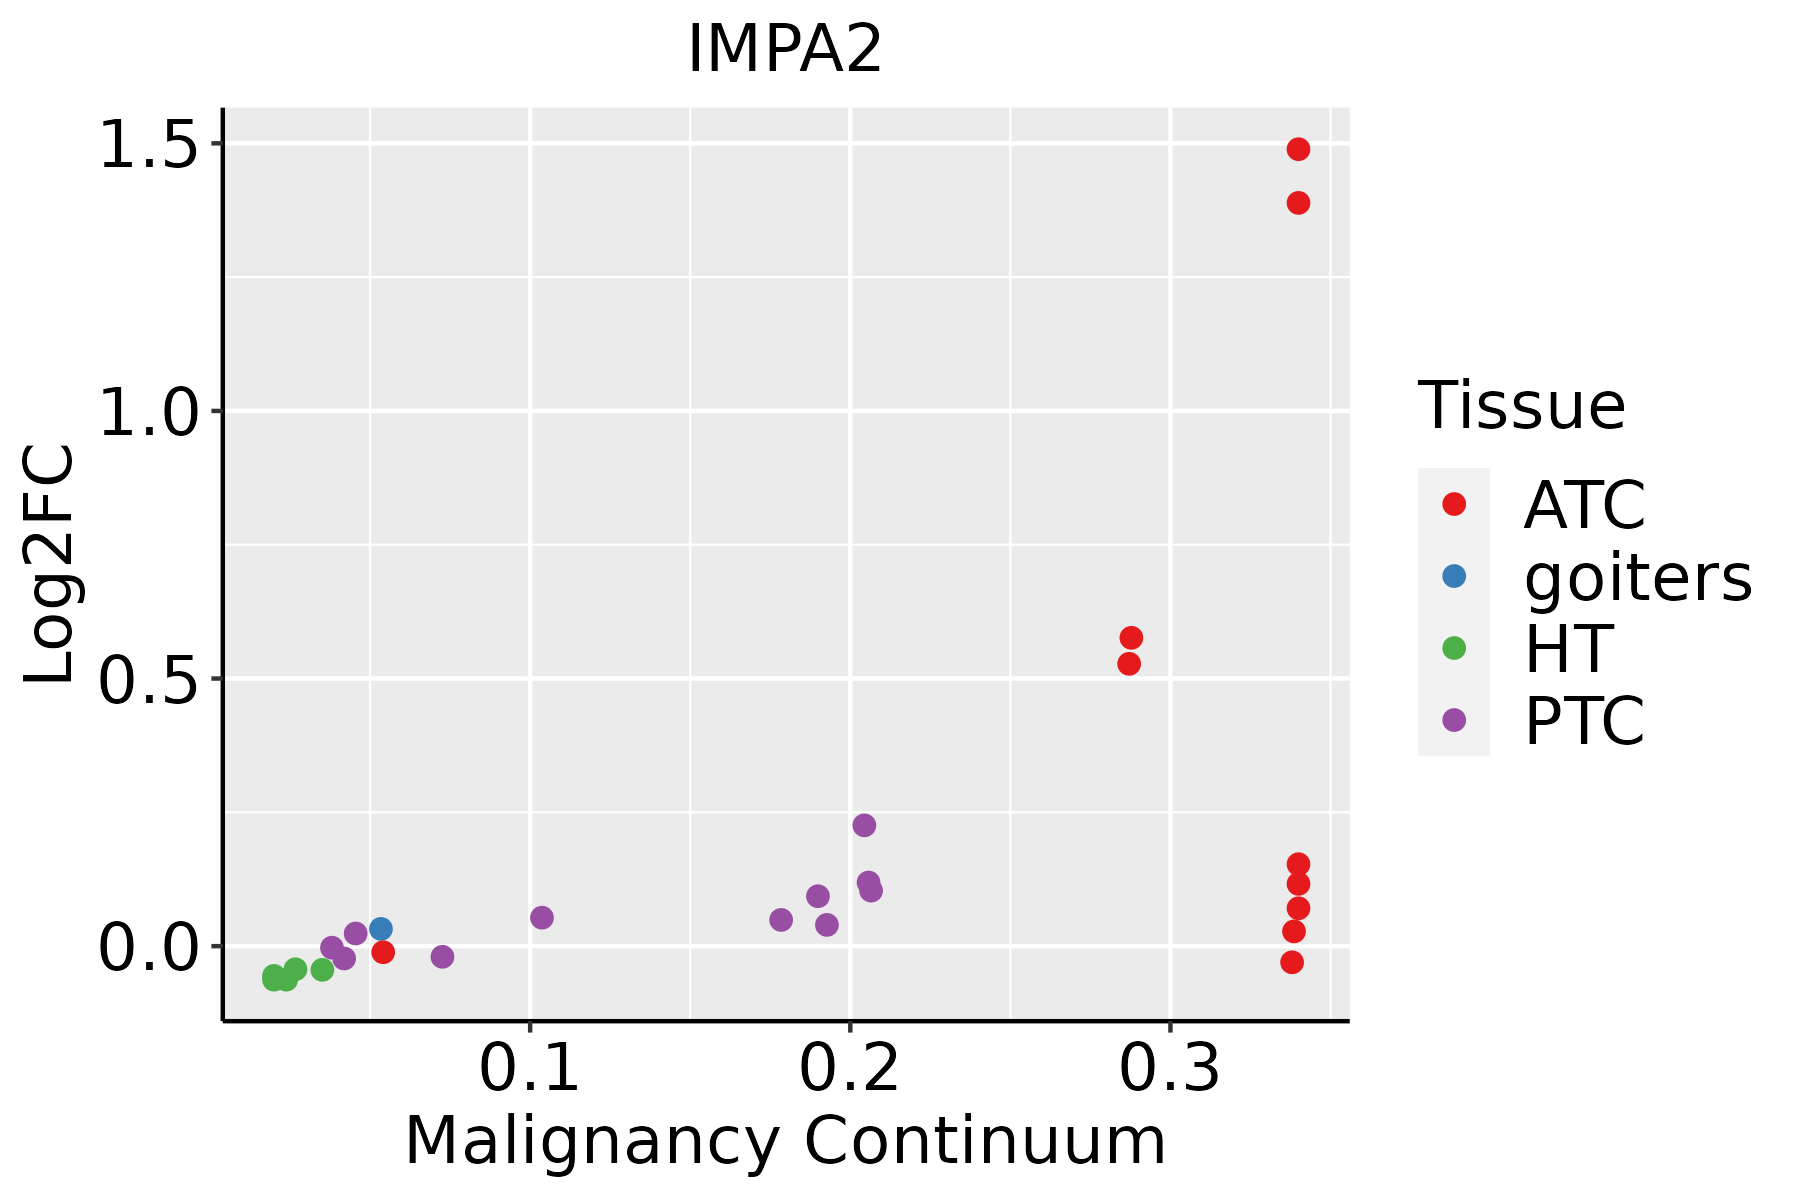 | ATC: Anaplastic thyroid cancer |
| HT: Hashimoto's thyroiditis | ||
| PTC: Papillary thyroid cancer |
| ∗log2FC in expression of this searched gene in stem-like cells from each diseased tissue sample relative to stem-like cells in normal samples in each tissue plotted against the malignancy continuum. Samples are colored based on if they are from different disease stage. |
Top |
Malignant transformation related pathway analysis |
| Find out the enriched GO biological processes and KEGG pathways involved in transition from healthy to precancer to cancer |
| Tissue | Disease Stage | Enriched GO biological Processes |
| Oral cavity | OSCC |  |
| Oral cavity | LP |  |
| Oral cavity | EOLP |  |
| Oral cavity | NEOLP |  |
| Esophagus | HGIN |  |
| ∗Top 15 enriched GO BP terms are showed in the bar plot of each disease state in each tissue. Each row represents a significant GO biological process which is colored according to the -log10(p.adjust). |
| Page: 1 2 3 4 5 6 7 8 9 |
| GO ID | Tissue | Disease Stage | Description | Gene Ratio | Bg Ratio | pvalue | p.adjust | Count |
| GO:0044282 | Colorectum | AD | small molecule catabolic process | 118/3918 | 376/18723 | 1.05e-06 | 3.55e-05 | 118 |
| GO:0016311 | Colorectum | AD | dephosphorylation | 123/3918 | 417/18723 | 1.84e-05 | 3.82e-04 | 123 |
| GO:0006066 | Colorectum | AD | alcohol metabolic process | 106/3918 | 353/18723 | 3.02e-05 | 5.57e-04 | 106 |
| GO:0044262 | Colorectum | AD | cellular carbohydrate metabolic process | 87/3918 | 283/18723 | 6.00e-05 | 1.01e-03 | 87 |
| GO:0006650 | Colorectum | AD | glycerophospholipid metabolic process | 83/3918 | 306/18723 | 5.40e-03 | 3.55e-02 | 83 |
| GO:0006644 | Colorectum | AD | phospholipid metabolic process | 101/3918 | 383/18723 | 5.80e-03 | 3.67e-02 | 101 |
| GO:0046164 | Colorectum | AD | alcohol catabolic process | 20/3918 | 55/18723 | 6.03e-03 | 3.78e-02 | 20 |
| GO:0045017 | Colorectum | AD | glycerolipid biosynthetic process | 69/3918 | 252/18723 | 8.33e-03 | 4.88e-02 | 69 |
| GO:00442821 | Colorectum | SER | small molecule catabolic process | 87/2897 | 376/18723 | 5.31e-05 | 1.27e-03 | 87 |
| GO:00060661 | Colorectum | SER | alcohol metabolic process | 79/2897 | 353/18723 | 3.50e-04 | 5.50e-03 | 79 |
| GO:0046486 | Colorectum | SER | glycerolipid metabolic process | 82/2897 | 392/18723 | 2.26e-03 | 2.17e-02 | 82 |
| GO:00163111 | Colorectum | SER | dephosphorylation | 86/2897 | 417/18723 | 2.73e-03 | 2.46e-02 | 86 |
| GO:00461641 | Colorectum | SER | alcohol catabolic process | 17/2897 | 55/18723 | 3.00e-03 | 2.65e-02 | 17 |
| GO:00066441 | Colorectum | SER | phospholipid metabolic process | 79/2897 | 383/18723 | 3.94e-03 | 3.24e-02 | 79 |
| GO:00450171 | Colorectum | SER | glycerolipid biosynthetic process | 55/2897 | 252/18723 | 4.47e-03 | 3.56e-02 | 55 |
| GO:00066501 | Colorectum | SER | glycerophospholipid metabolic process | 64/2897 | 306/18723 | 6.41e-03 | 4.60e-02 | 64 |
| GO:00060662 | Colorectum | MSS | alcohol metabolic process | 92/3467 | 353/18723 | 2.57e-04 | 3.46e-03 | 92 |
| GO:00442822 | Colorectum | MSS | small molecule catabolic process | 94/3467 | 376/18723 | 9.85e-04 | 9.86e-03 | 94 |
| GO:00163112 | Colorectum | MSS | dephosphorylation | 101/3467 | 417/18723 | 1.98e-03 | 1.70e-02 | 101 |
| GO:00163113 | Colorectum | FAP | dephosphorylation | 95/2622 | 417/18723 | 7.07e-07 | 3.32e-05 | 95 |
| Page: 1 2 3 4 5 |
| Pathway ID | Tissue | Disease Stage | Description | Gene Ratio | Bg Ratio | pvalue | p.adjust | qvalue | Count |
| hsa04070 | Colorectum | CRC | Phosphatidylinositol signaling system | 25/1091 | 97/8465 | 4.27e-04 | 4.60e-03 | 3.12e-03 | 25 |
| hsa00562 | Colorectum | CRC | Inositol phosphate metabolism | 18/1091 | 73/8465 | 4.38e-03 | 2.52e-02 | 1.71e-02 | 18 |
| hsa040701 | Colorectum | CRC | Phosphatidylinositol signaling system | 25/1091 | 97/8465 | 4.27e-04 | 4.60e-03 | 3.12e-03 | 25 |
| hsa005621 | Colorectum | CRC | Inositol phosphate metabolism | 18/1091 | 73/8465 | 4.38e-03 | 2.52e-02 | 1.71e-02 | 18 |
| Page: 1 |
Top |
Cell-cell communication analysis |
| Identification of potential cell-cell interactions between two cell types and their ligand-receptor pairs for different disease states |
| Ligand | Receptor | LRpair | Pathway | Tissue | Disease Stage |
| Page: 1 |
Top |
Single-cell gene regulatory network inference analysis |
| Find out the significant the regulons (TFs) and the target genes of each regulon across cell types for different disease states |
| TF | Cell Type | Tissue | Disease Stage | Target Gene | RSS | Regulon Activity |
| ∗The dot plots of a searched regulon are shown for all cell subpopulations in each disease state of each tissue based on the regulon specific score inferred using pySCENIC and by calculating the average expression. |
| Page: 1 |
Top |
Somatic mutation of malignant transformation related genes |
| Annotation of somatic variants for genes involved in malignant transformation |
| Hugo Symbol | Variant Class | Variant Classification | dbSNP RS | HGVSc | HGVSp | HGVSp Short | SWISSPROT | BIOTYPE | SIFT | PolyPhen | Tumor Sample Barcode | Tissue | Histology | Sex | Age | Stage | Therapy Types | Drugs | Outcome |
| IMPA2 | SNV | Missense_Mutation | novel | c.760N>T | p.Leu254Phe | p.L254F | O14732 | protein_coding | tolerated(1) | benign(0.018) | TCGA-AN-A0FK-01 | Breast | breast invasive carcinoma | Female | >=65 | III/IV | Unknown | Unknown | SD |
| IMPA2 | SNV | Missense_Mutation | c.715N>G | p.Ile239Val | p.I239V | O14732 | protein_coding | tolerated(1) | benign(0.003) | TCGA-BH-A18G-01 | Breast | breast invasive carcinoma | Female | >=65 | I/II | Unknown | Unknown | SD | |
| IMPA2 | SNV | Missense_Mutation | c.825G>T | p.Gln275His | p.Q275H | O14732 | protein_coding | deleterious(0) | benign(0.394) | TCGA-D8-A1XQ-01 | Breast | breast invasive carcinoma | Female | >=65 | I/II | Unknown | Unknown | SD | |
| IMPA2 | SNV | Missense_Mutation | c.341C>A | p.Pro114Gln | p.P114Q | O14732 | protein_coding | deleterious(0) | probably_damaging(0.999) | TCGA-GM-A2DB-01 | Breast | breast invasive carcinoma | Female | <65 | I/II | Chemotherapy | taxol | CR | |
| IMPA2 | insertion | Frame_Shift_Ins | novel | c.557_558insTGCTGGCATTACAGGCACGATCCACTGTG | p.Leu187AlafsTer11 | p.L187Afs*11 | O14732 | protein_coding | TCGA-B6-A0I6-01 | Breast | breast invasive carcinoma | Female | <65 | I/II | Unknown | Unknown | PD | ||
| IMPA2 | SNV | Missense_Mutation | c.224N>T | p.Ser75Leu | p.S75L | O14732 | protein_coding | deleterious(0.02) | benign(0.077) | TCGA-IR-A3LA-01 | Cervix | cervical & endocervical cancer | Female | <65 | I/II | Chemotherapy | cisplatin | CR | |
| IMPA2 | SNV | Missense_Mutation | c.313G>A | p.Gly105Ser | p.G105S | O14732 | protein_coding | deleterious(0) | probably_damaging(1) | TCGA-D5-6928-01 | Colorectum | colon adenocarcinoma | Male | >=65 | I/II | Unknown | Unknown | SD | |
| IMPA2 | SNV | Missense_Mutation | rs754589142 | c.533N>A | p.Arg178His | p.R178H | O14732 | protein_coding | deleterious(0) | probably_damaging(0.976) | TCGA-G4-6304-01 | Colorectum | colon adenocarcinoma | Female | >=65 | I/II | Chemotherapy | fluorouracil | PD |
| IMPA2 | SNV | Missense_Mutation | c.763N>A | p.Asp255Asn | p.D255N | O14732 | protein_coding | deleterious(0.02) | benign(0.445) | TCGA-CI-6621-01 | Colorectum | rectum adenocarcinoma | Male | <65 | III/IV | Unknown | Unknown | SD | |
| IMPA2 | insertion | Frame_Shift_Ins | novel | c.104_105insA | p.Ala37SerfsTer4 | p.A37Sfs*4 | O14732 | protein_coding | TCGA-AA-3672-01 | Colorectum | colon adenocarcinoma | Female | >=65 | III/IV | Unknown | Unknown | SD |
| Page: 1 2 3 4 |
Top |
Related drugs of malignant transformation related genes |
| Identification of chemicals and drugs interact with genes involved in malignant transfromation |
| (DGIdb 4.0) |
| Entrez ID | Symbol | Category | Interaction Types | Drug Claim Name | Drug Name | PMIDs |
| Page: 1 |

Copyright 2023-Present -The University of Texas Health Science Center at Houston |