| Tissue | Expression Dynamics | Abbreviation |
| Breast | 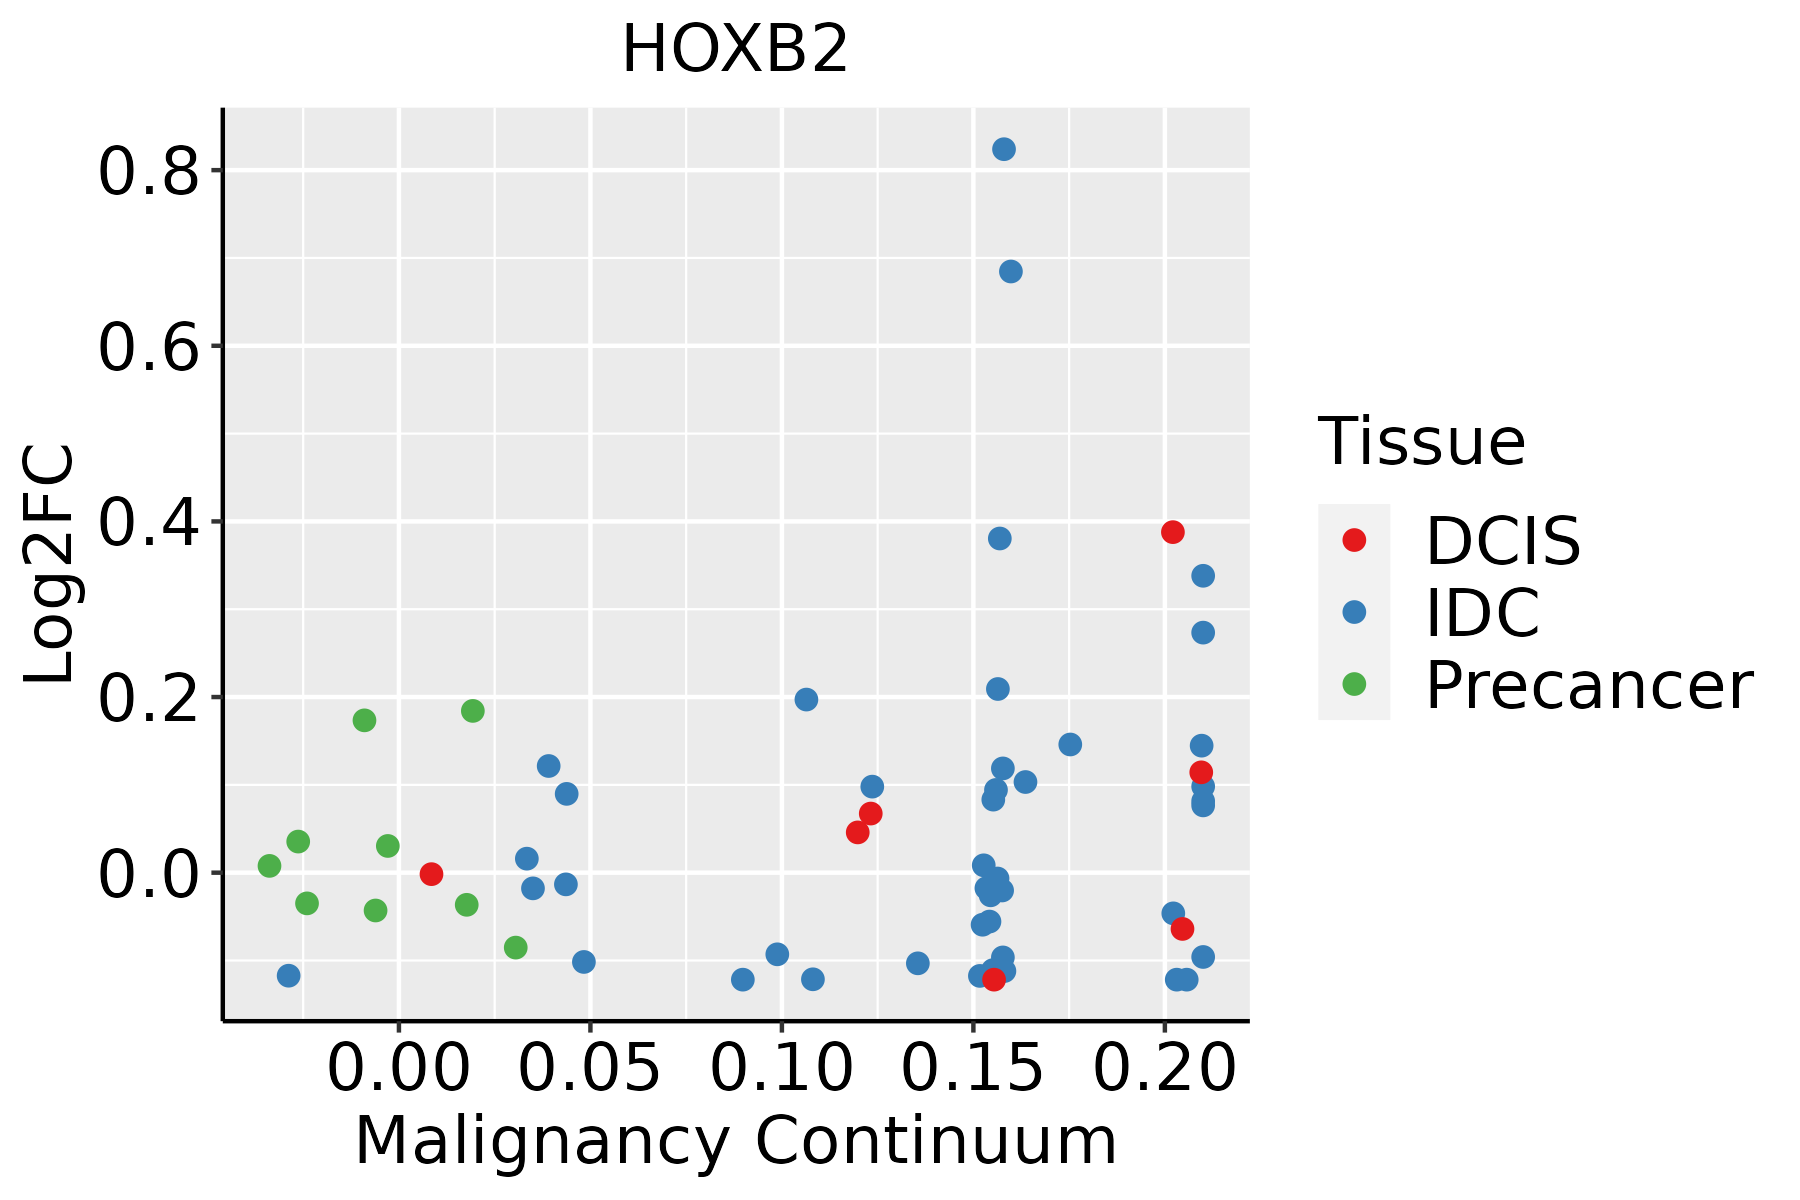 | IDC: Invasive ductal carcinoma |
| DCIS: Ductal carcinoma in situ |
| Precancer(BRCA1-mut): Precancerous lesion from BRCA1 mutation carriers |
| Colorectum (GSE201348) |  | FAP: Familial adenomatous polyposis |
| CRC: Colorectal cancer |
| Colorectum (HTA11) |  | AD: Adenomas |
| SER: Sessile serrated lesions |
| MSI-H: Microsatellite-high colorectal cancer |
| MSS: Microsatellite stable colorectal cancer |
| Esophagus | 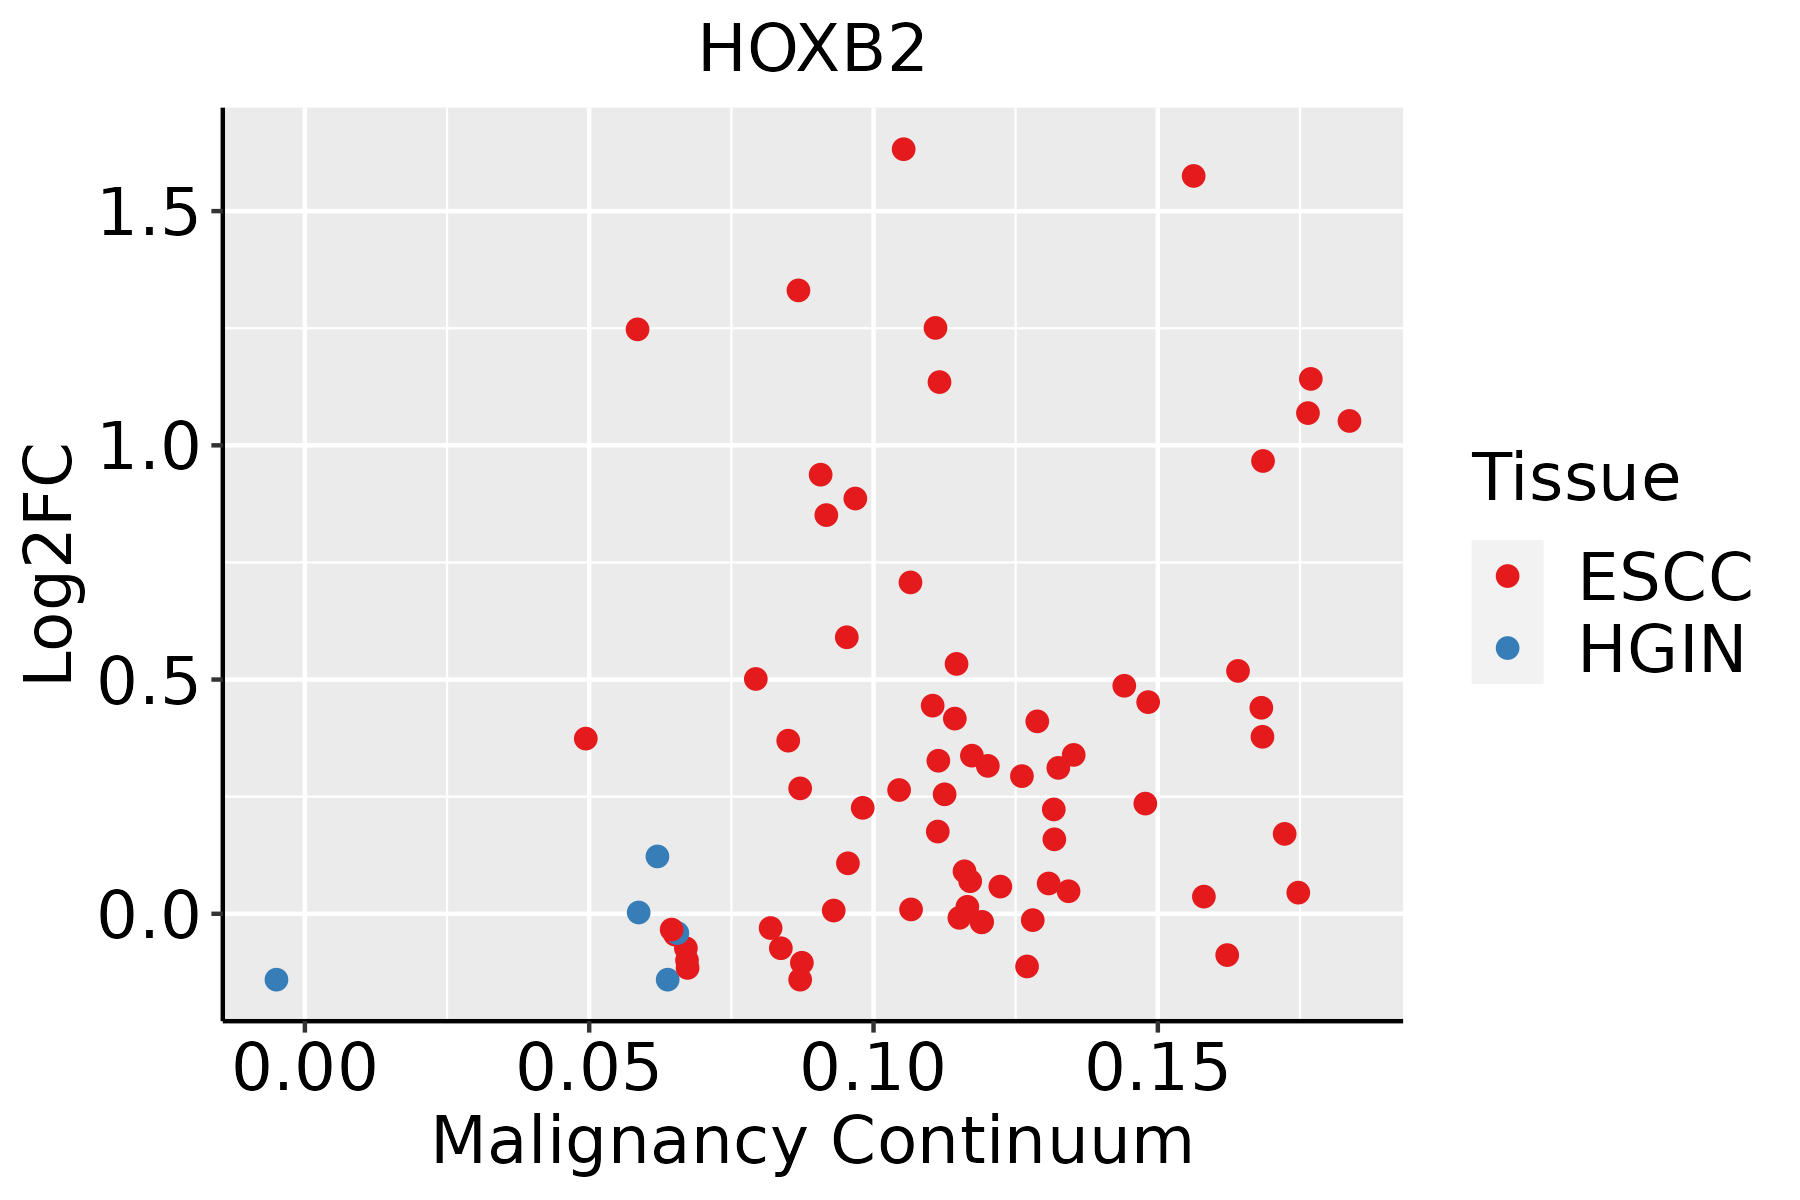 | ESCC: Esophageal squamous cell carcinoma |
| HGIN: High-grade intraepithelial neoplasias |
| LGIN: Low-grade intraepithelial neoplasias |
| Oral Cavity |  | EOLP: Erosive Oral lichen planus |
| LP: leukoplakia |
| NEOLP: Non-erosive oral lichen planus |
| OSCC: Oral squamous cell carcinoma |
| Skin | 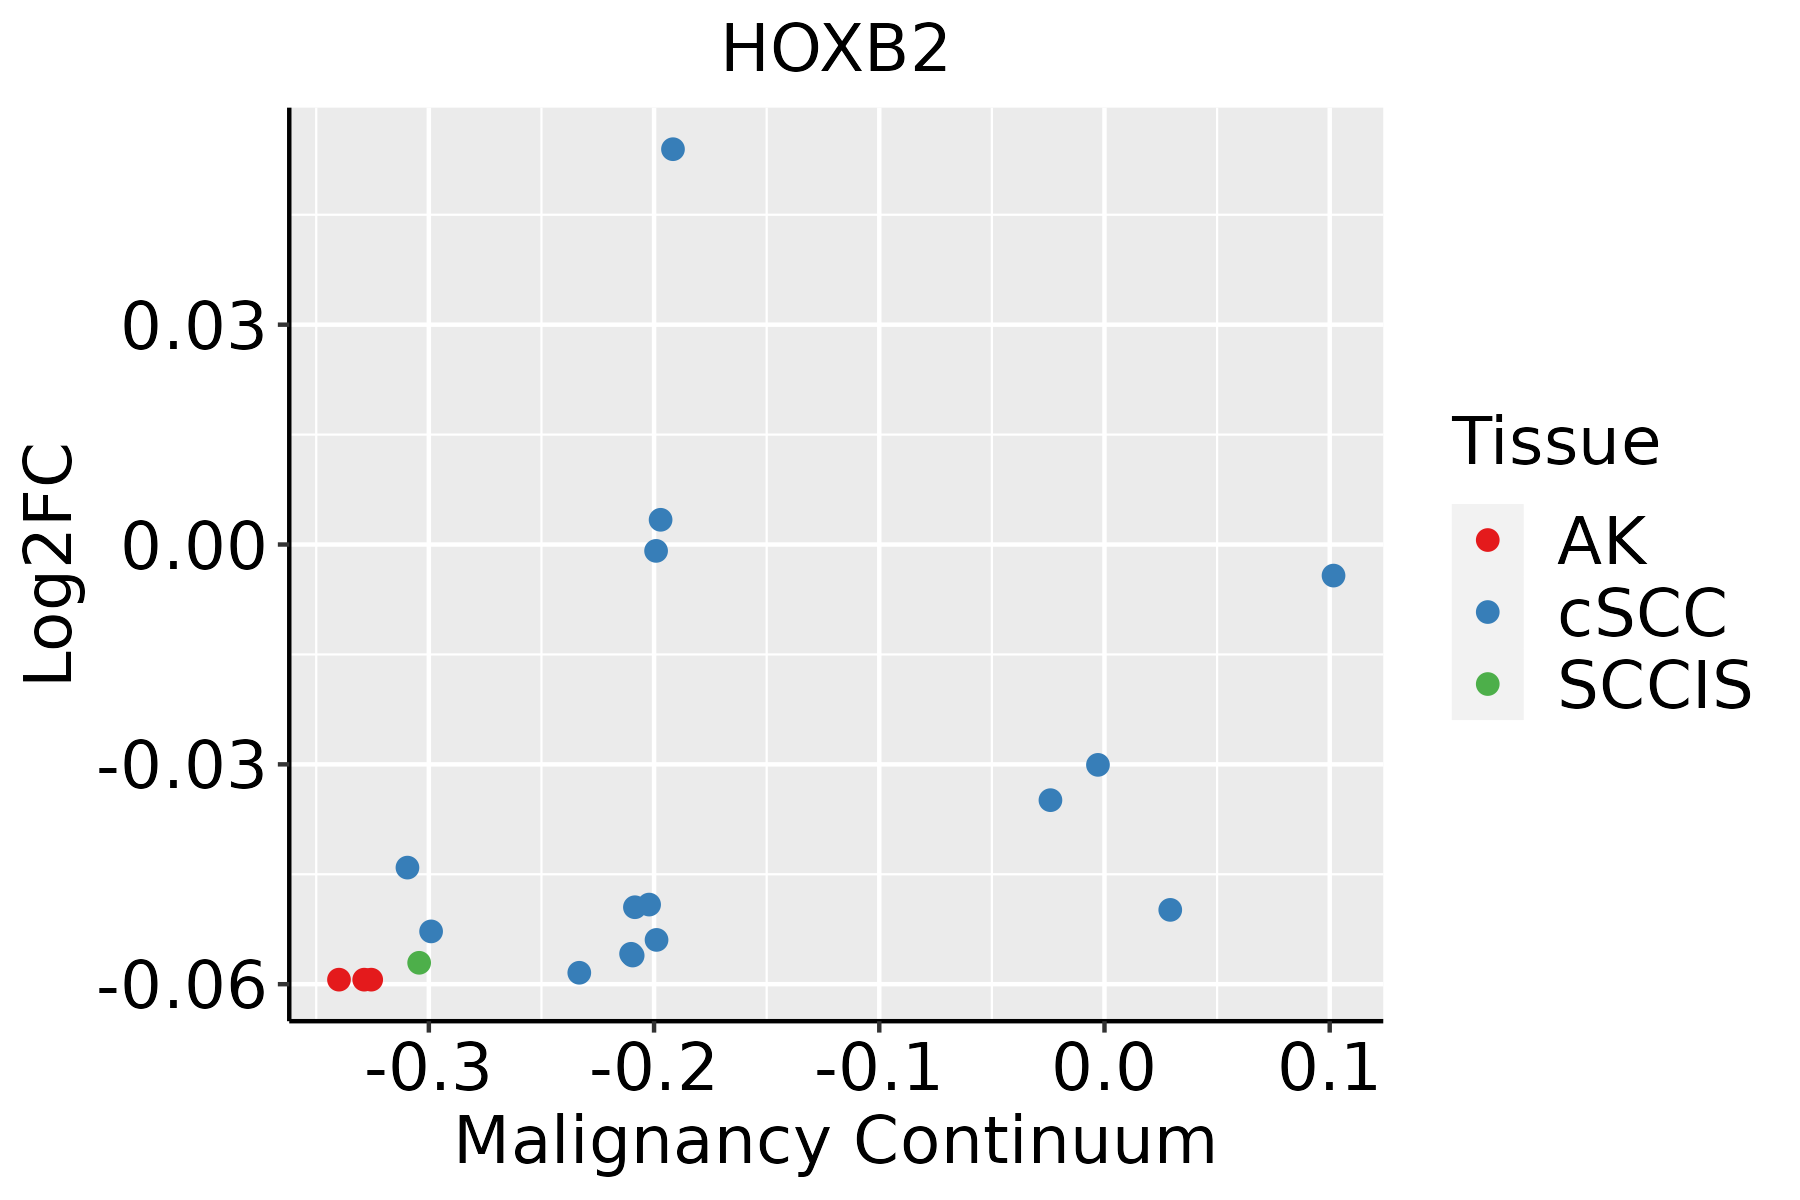 | AK: Actinic keratosis |
| cSCC: Cutaneous squamous cell carcinoma |
| SCCIS:squamous cell carcinoma in situ |
| GO ID | Tissue | Disease Stage | Description | Gene Ratio | Bg Ratio | pvalue | p.adjust | Count |
| GO:004885713 | Breast | IDC | neural nucleus development | 21/1434 | 64/18723 | 5.35e-09 | 4.28e-07 | 21 |
| GO:004885723 | Breast | DCIS | neural nucleus development | 20/1390 | 64/18723 | 1.87e-08 | 1.29e-06 | 20 |
| GO:0048857 | Colorectum | AD | neural nucleus development | 27/3918 | 64/18723 | 9.57e-05 | 1.45e-03 | 27 |
| GO:0048568 | Colorectum | AD | embryonic organ development | 112/3918 | 427/18723 | 4.60e-03 | 3.14e-02 | 112 |
| GO:00488571 | Colorectum | SER | neural nucleus development | 26/2897 | 64/18723 | 1.09e-06 | 5.11e-05 | 26 |
| GO:00488573 | Colorectum | MSI-H | neural nucleus development | 13/1319 | 64/18723 | 4.43e-04 | 9.50e-03 | 13 |
| GO:00020115 | Esophagus | ESCC | morphogenesis of an epithelial sheet | 42/8552 | 57/18723 | 1.62e-05 | 1.45e-04 | 42 |
| GO:004885718 | Esophagus | ESCC | neural nucleus development | 44/8552 | 64/18723 | 1.59e-04 | 1.05e-03 | 44 |
| GO:00485687 | Esophagus | ESCC | embryonic organ development | 228/8552 | 427/18723 | 7.28e-04 | 3.79e-03 | 228 |
| GO:00487052 | Esophagus | ESCC | skeletal system morphogenesis | 120/8552 | 220/18723 | 4.90e-03 | 1.89e-02 | 120 |
| GO:00020114 | Oral cavity | OSCC | morphogenesis of an epithelial sheet | 37/7305 | 57/18723 | 6.66e-05 | 5.38e-04 | 37 |
| TF | Cell Type | Tissue | Disease Stage | Target Gene | RSS | Regulon Activity |
| HOXB2 | MLUM | Breast | Healthy | HOXB-AS1,RASSF6,C12orf73, etc. | 4.00e-01 |  |
| HOXB2 | ABS | Colorectum | MSI-H | TMEM132C,SOD3,SORCS2, etc. | 2.70e-01 |  |
| HOXB2 | IMENT | Colorectum | MSI-H | TMEM132C,SOD3,SORCS2, etc. | 9.51e-02 | |
| HOXB2 | ASC | Colorectum | MSI-H | TMEM132C,SOD3,SORCS2, etc. | 1.31e-01 | |
| HOXB2 | SSC | Colorectum | SER | TMEM132C,SOD3,SORCS2, etc. | 1.95e-02 |  |
| HOXB2 | ICAF | Colorectum | ADJ | YJU2,MRTO4,MIR4435-2HG, etc. | 2.07e-01 |  |
| HOXB2 | SMC | Endometrium | ADJ | SLPI,MT-ND2,CSRP2, etc. | 4.12e-01 |  |
| HOXB2 | SMC | Endometrium | AEH | SLPI,MT-ND2,CSRP2, etc. | 3.13e-01 |  |
| HOXB2 | SMC | Endometrium | EEC | SLPI,MT-ND2,CSRP2, etc. | 2.09e-01 |  |
| HOXB2 | SMC | Endometrium | Healthy | SLPI,MT-ND2,CSRP2, etc. | 3.94e-01 |  |
| Hugo Symbol | Variant Class | Variant Classification | dbSNP RS | HGVSc | HGVSp | HGVSp Short | SWISSPROT | BIOTYPE | SIFT | PolyPhen | Tumor Sample Barcode | Tissue | Histology | Sex | Age | Stage | Therapy Types | Drugs | Outcome |
| HOXB2 | SNV | Missense_Mutation | novel | c.991N>A | p.Asp331Asn | p.D331N | P14652 | protein_coding | deleterious(0.03) | benign(0.01) | TCGA-AC-A23H-01 | Breast | breast invasive carcinoma | Female | >=65 | I/II | Unknown | Unknown | PD |
| HOXB2 | SNV | Missense_Mutation | | c.340N>T | p.Pro114Ser | p.P114S | P14652 | protein_coding | tolerated(0.51) | benign(0.007) | TCGA-AC-A23H-01 | Breast | breast invasive carcinoma | Female | >=65 | I/II | Unknown | Unknown | PD |
| HOXB2 | SNV | Missense_Mutation | | c.107N>T | p.Ser36Leu | p.S36L | P14652 | protein_coding | deleterious(0) | probably_damaging(0.996) | TCGA-AC-A23H-01 | Breast | breast invasive carcinoma | Female | >=65 | I/II | Unknown | Unknown | PD |
| HOXB2 | SNV | Missense_Mutation | | c.215C>T | p.Ala72Val | p.A72V | P14652 | protein_coding | tolerated(0.07) | benign(0.115) | TCGA-AN-A0XU-01 | Breast | breast invasive carcinoma | Female | <65 | I/II | Unknown | Unknown | SD |
| HOXB2 | SNV | Missense_Mutation | | c.597N>T | p.Lys199Asn | p.K199N | P14652 | protein_coding | deleterious(0) | probably_damaging(0.999) | TCGA-E2-A15G-01 | Breast | breast invasive carcinoma | Female | >=65 | I/II | Hormone Therapy | arimidex | SD |
| HOXB2 | SNV | Missense_Mutation | novel | c.614N>T | p.Arg205Leu | p.R205L | P14652 | protein_coding | deleterious(0.01) | benign(0.122) | TCGA-PE-A5DE-01 | Breast | breast invasive carcinoma | Female | <65 | I/II | Chemotherapy | taxotere | CR |
| HOXB2 | insertion | Nonsense_Mutation | novel | c.974_975insGTACTTTGGATATCCTAGGGGTGAGAGGTCTTAGT | p.Ser325ArgfsTer12 | p.S325Rfs*12 | P14652 | protein_coding | | | TCGA-A8-A06X-01 | Breast | breast invasive carcinoma | Female | >=65 | I/II | Unknown | Unknown | SD |
| HOXB2 | insertion | Frame_Shift_Ins | novel | c.27_28insT | p.Gly10TrpfsTer156 | p.G10Wfs*156 | P14652 | protein_coding | | | TCGA-B6-A40C-01 | Breast | breast invasive carcinoma | Female | <65 | I/II | Hormone Therapy | cyclophosphamide | SD |
| HOXB2 | insertion | Nonsense_Mutation | novel | c.797_798insAATGCAGACCCACCAGTCTTGACCAACAACTTCATTTTACGTATCAA | p.Leu267MetfsTer7 | p.L267Mfs*7 | P14652 | protein_coding | | | TCGA-BH-A0BJ-01 | Breast | breast invasive carcinoma | Female | <65 | I/II | Chemotherapy | doxorubicin | SD |
| HOXB2 | SNV | Missense_Mutation | | c.50C>T | p.Ser17Leu | p.S17L | P14652 | protein_coding | deleterious(0) | possibly_damaging(0.662) | TCGA-JX-A3Q0-01 | Cervix | cervical & endocervical cancer | Female | <65 | III/IV | Unknown | Unknown | SD |


