
|
|||||
|
 | |
| |
| |
| |
| |
| |
|
Gene: FLNC |
Gene summary for FLNC |
| Gene information | Species | Human | Gene symbol | FLNC | Gene ID | 2318 |
| Gene name | filamin C | |
| Gene Alias | ABP-280 | |
| Cytomap | 7q32.1 | |
| Gene Type | protein-coding | GO ID | GO:0006996 | UniProtAcc | Q14315 |
Top |
Malignant transformation analysis |
| Identification of the aberrant gene expression in precancerous and cancerous lesions by comparing the gene expression of stem-like cells in diseased tissues with normal stem cells |
| Entrez ID | Symbol | Replicates | Species | Organ | Tissue | Adj P-value | Log2FC | Malignancy |
| 2318 | FLNC | HCC1_Meng | Human | Liver | HCC | 2.19e-44 | 2.51e-01 | 0.0246 |
| 2318 | FLNC | HCC2 | Human | Liver | HCC | 9.56e-45 | 5.24e+00 | 0.5341 |
| 2318 | FLNC | Pt13.b | Human | Liver | HCC | 6.02e-08 | 1.62e-01 | 0.0251 |
| 2318 | FLNC | S014 | Human | Liver | HCC | 3.64e-16 | 6.36e-01 | 0.2254 |
| 2318 | FLNC | S015 | Human | Liver | HCC | 1.83e-15 | 7.18e-01 | 0.2375 |
| 2318 | FLNC | S016 | Human | Liver | HCC | 2.97e-13 | 4.28e-01 | 0.2243 |
| 2318 | FLNC | ATC09 | Human | Thyroid | ATC | 2.66e-04 | 2.53e-01 | 0.2871 |
| 2318 | FLNC | ATC11 | Human | Thyroid | ATC | 5.90e-10 | 6.87e-01 | 0.3386 |
| 2318 | FLNC | ATC12 | Human | Thyroid | ATC | 1.15e-03 | 1.27e-01 | 0.34 |
| 2318 | FLNC | ATC13 | Human | Thyroid | ATC | 1.12e-33 | 6.27e-01 | 0.34 |
| 2318 | FLNC | ATC1 | Human | Thyroid | ATC | 4.95e-05 | 2.79e-01 | 0.2878 |
| 2318 | FLNC | ATC2 | Human | Thyroid | ATC | 1.60e-07 | 9.26e-01 | 0.34 |
| 2318 | FLNC | ATC3 | Human | Thyroid | ATC | 3.69e-12 | 5.60e-01 | 0.338 |
| 2318 | FLNC | ATC4 | Human | Thyroid | ATC | 2.34e-04 | 1.52e-01 | 0.34 |
| 2318 | FLNC | ATC5 | Human | Thyroid | ATC | 8.04e-38 | 6.72e-01 | 0.34 |
| Page: 1 |
| Tissue | Expression Dynamics | Abbreviation |
| Liver | 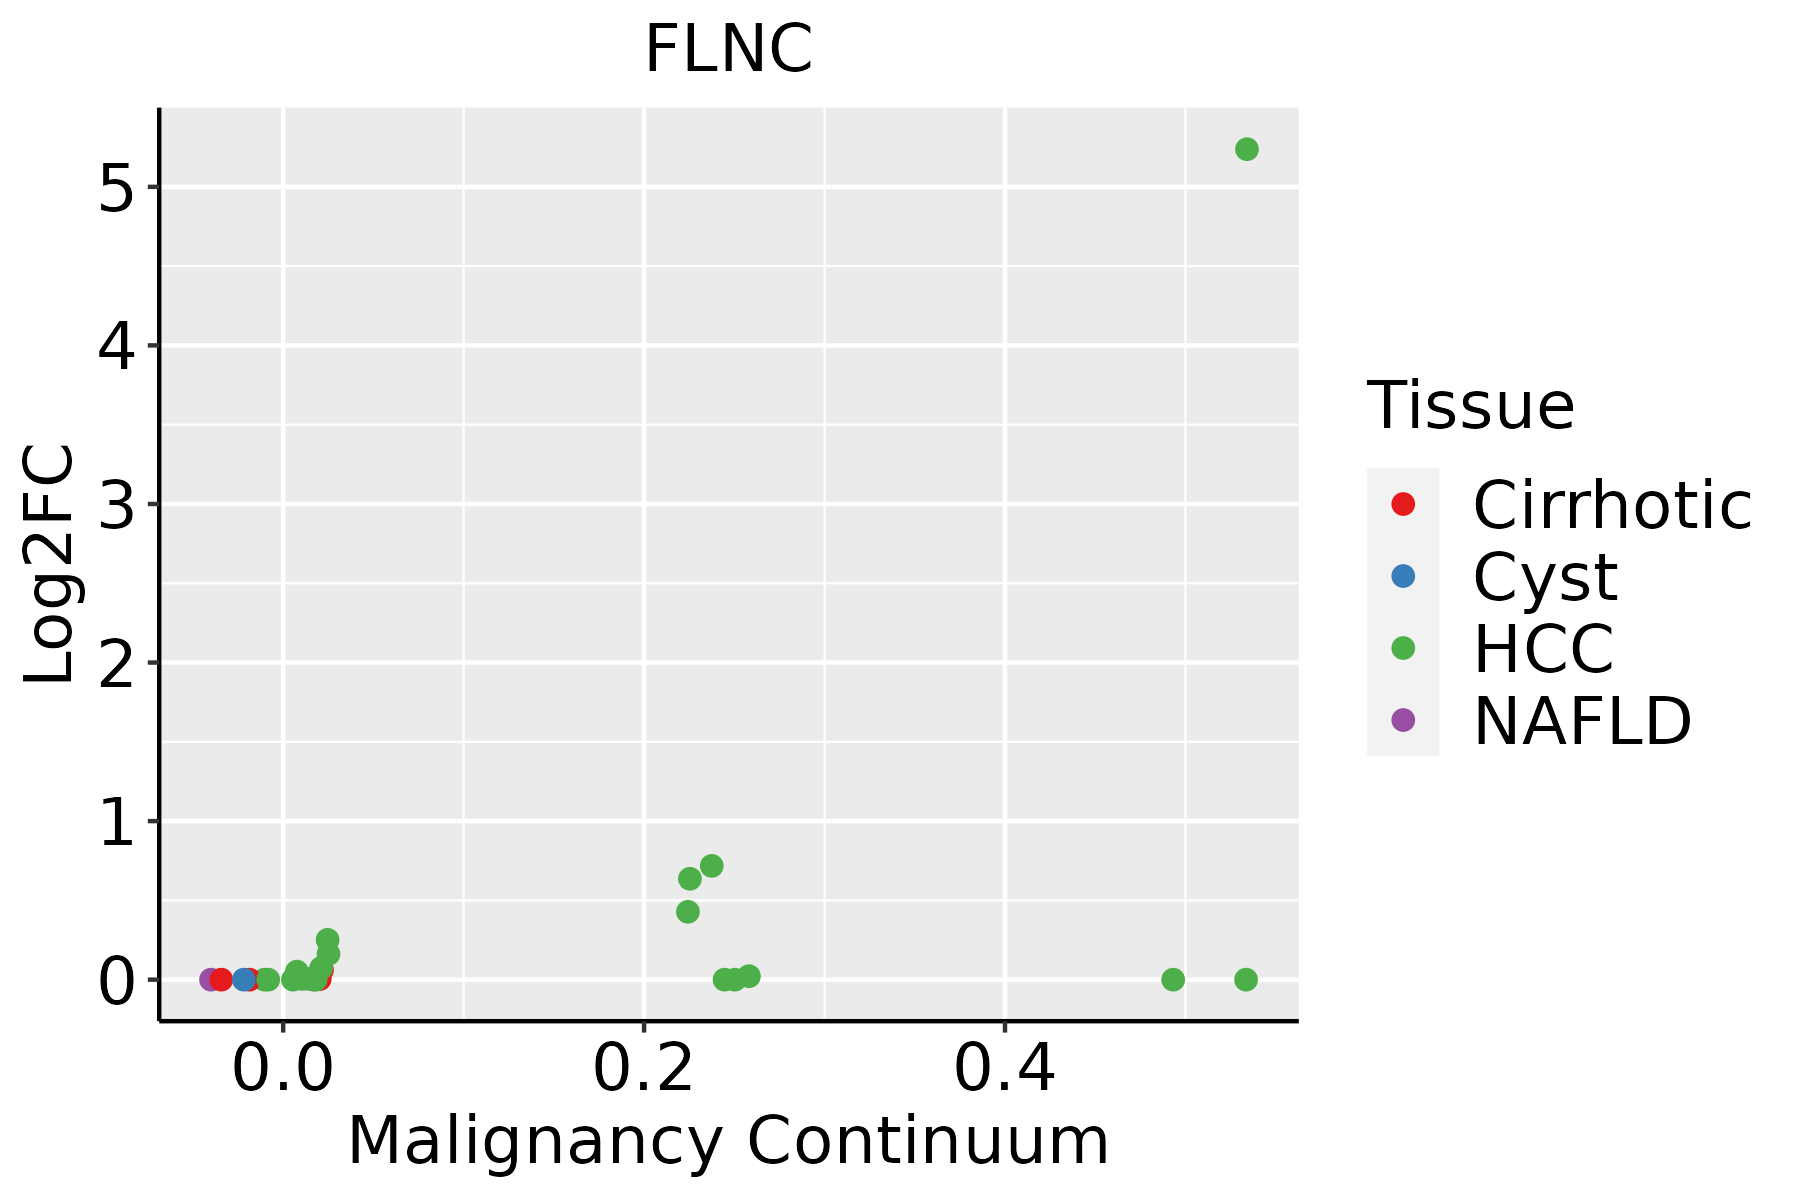 | HCC: Hepatocellular carcinoma |
| NAFLD: Non-alcoholic fatty liver disease | ||
| Thyroid | 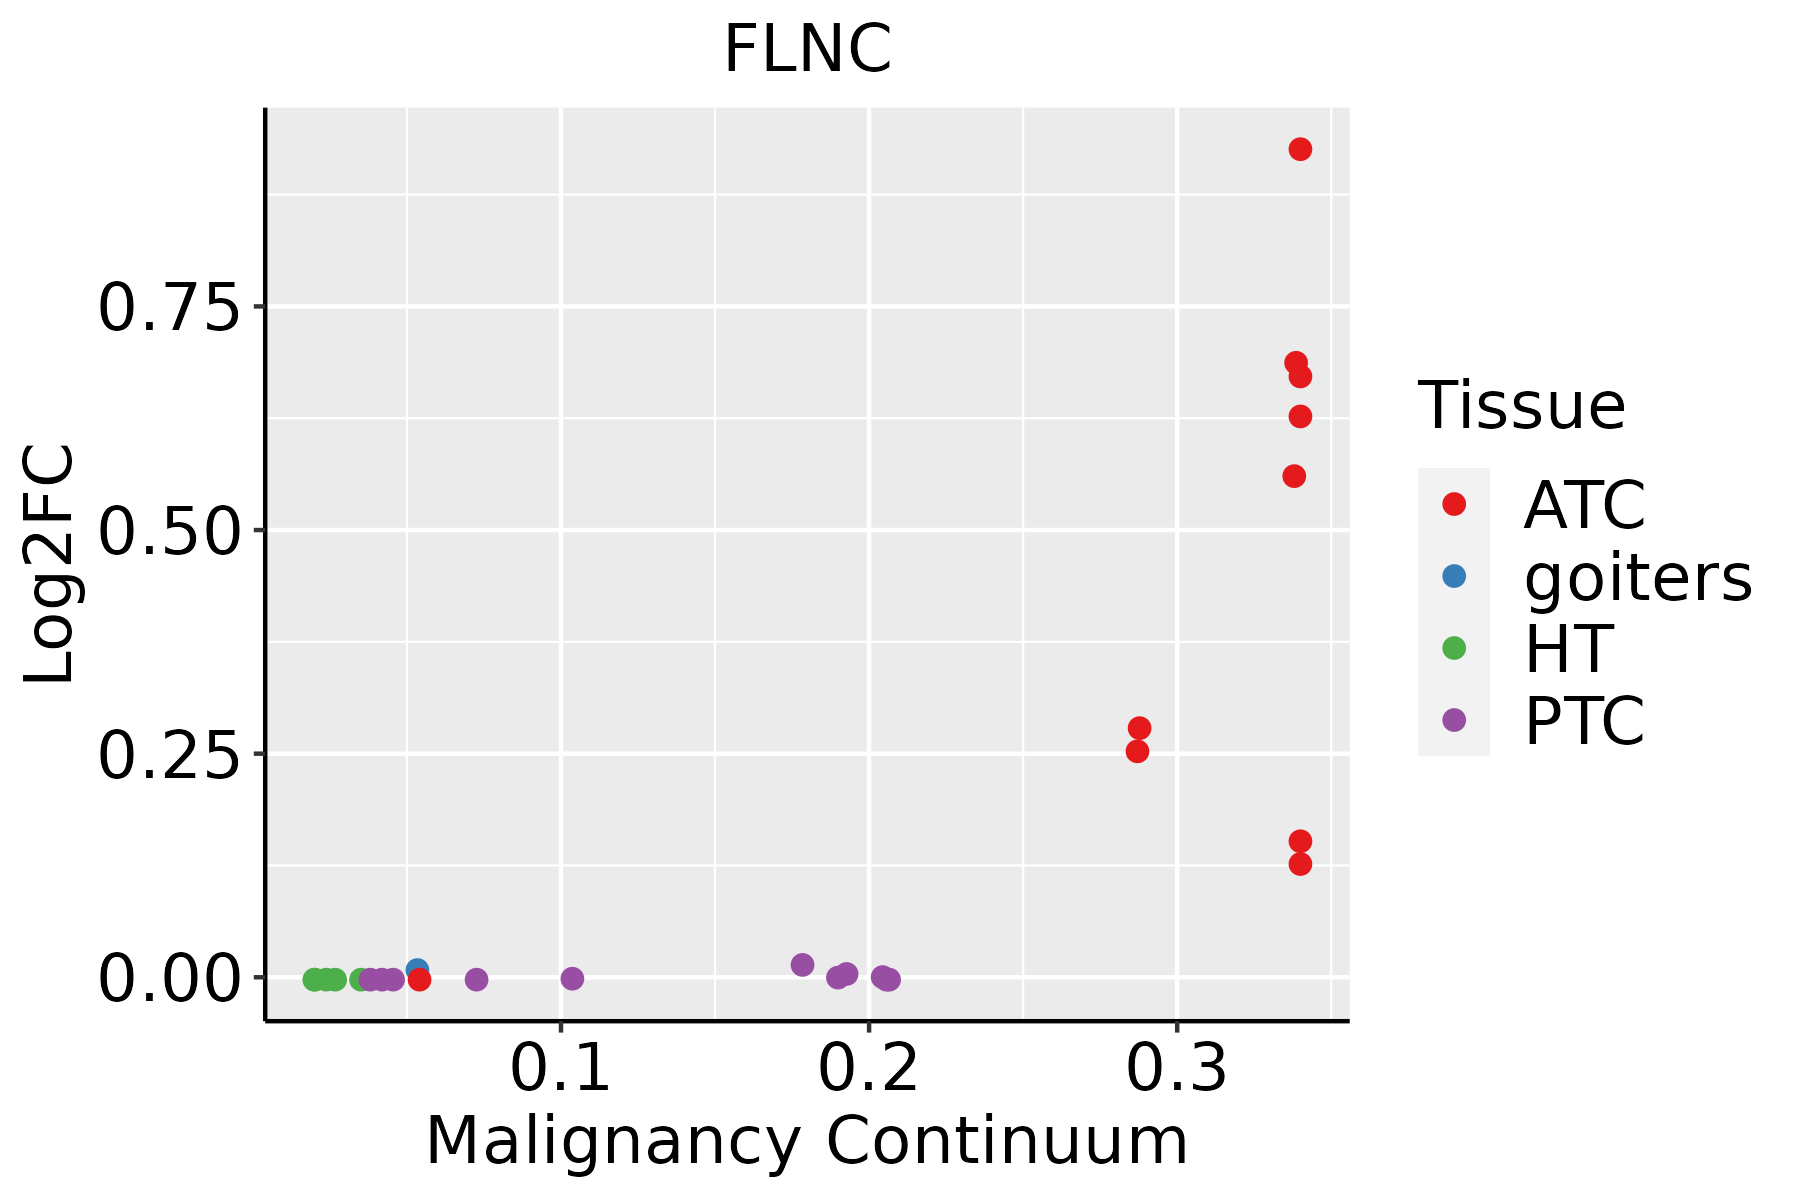 | ATC: Anaplastic thyroid cancer |
| HT: Hashimoto's thyroiditis | ||
| PTC: Papillary thyroid cancer |
| ∗log2FC in expression of this searched gene in stem-like cells from each diseased tissue sample relative to stem-like cells in normal samples in each tissue plotted against the malignancy continuum. Samples are colored based on if they are from different disease stage. |
Top |
Malignant transformation related pathway analysis |
| Find out the enriched GO biological processes and KEGG pathways involved in transition from healthy to precancer to cancer |
| Tissue | Disease Stage | Enriched GO biological Processes |
| Oral cavity | OSCC |  |
| Oral cavity | LP |  |
| Oral cavity | EOLP |  |
| Oral cavity | NEOLP |  |
| Esophagus | HGIN |  |
| ∗Top 15 enriched GO BP terms are showed in the bar plot of each disease state in each tissue. Each row represents a significant GO biological process which is colored according to the -log10(p.adjust). |
| Page: 1 2 3 4 5 6 7 8 9 |
| GO ID | Tissue | Disease Stage | Description | Gene Ratio | Bg Ratio | pvalue | p.adjust | Count |
| GO:004269216 | Thyroid | ATC | muscle cell differentiation | 165/6293 | 384/18723 | 7.17e-05 | 5.46e-04 | 165 |
| GO:005500112 | Thyroid | ATC | muscle cell development | 81/6293 | 184/18723 | 2.02e-03 | 9.60e-03 | 81 |
| Page: 1 |
| Pathway ID | Tissue | Disease Stage | Description | Gene Ratio | Bg Ratio | pvalue | p.adjust | qvalue | Count |
| hsa0513242 | Liver | HCC | Salmonella infection | 178/4020 | 249/8465 | 5.90e-15 | 1.98e-13 | 1.10e-13 | 178 |
| hsa0451041 | Liver | HCC | Focal adhesion | 125/4020 | 203/8465 | 3.12e-05 | 1.88e-04 | 1.04e-04 | 125 |
| hsa0520521 | Liver | HCC | Proteoglycans in cancer | 121/4020 | 205/8465 | 5.22e-04 | 2.18e-03 | 1.21e-03 | 121 |
| hsa0513252 | Liver | HCC | Salmonella infection | 178/4020 | 249/8465 | 5.90e-15 | 1.98e-13 | 1.10e-13 | 178 |
| hsa0451051 | Liver | HCC | Focal adhesion | 125/4020 | 203/8465 | 3.12e-05 | 1.88e-04 | 1.04e-04 | 125 |
| hsa0520531 | Liver | HCC | Proteoglycans in cancer | 121/4020 | 205/8465 | 5.22e-04 | 2.18e-03 | 1.21e-03 | 121 |
| Page: 1 |
Top |
Cell-cell communication analysis |
| Identification of potential cell-cell interactions between two cell types and their ligand-receptor pairs for different disease states |
| Ligand | Receptor | LRpair | Pathway | Tissue | Disease Stage |
| Page: 1 |
Top |
Single-cell gene regulatory network inference analysis |
| Find out the significant the regulons (TFs) and the target genes of each regulon across cell types for different disease states |
| TF | Cell Type | Tissue | Disease Stage | Target Gene | RSS | Regulon Activity |
| ∗The dot plots of a searched regulon are shown for all cell subpopulations in each disease state of each tissue based on the regulon specific score inferred using pySCENIC and by calculating the average expression. |
| Page: 1 |
Top |
Somatic mutation of malignant transformation related genes |
| Annotation of somatic variants for genes involved in malignant transformation |
| Hugo Symbol | Variant Class | Variant Classification | dbSNP RS | HGVSc | HGVSp | HGVSp Short | SWISSPROT | BIOTYPE | SIFT | PolyPhen | Tumor Sample Barcode | Tissue | Histology | Sex | Age | Stage | Therapy Types | Drugs | Outcome |
| FLNC | SNV | Missense_Mutation | rs778500387 | c.7343C>T | p.Ser2448Leu | p.S2448L | Q14315 | protein_coding | deleterious(0.03) | possibly_damaging(0.7) | TCGA-3C-AALI-01 | Breast | breast invasive carcinoma | Female | <65 | I/II | Unspecific | Poly E | Complete Response |
| FLNC | SNV | Missense_Mutation | rs374925943 | c.7483C>T | p.Arg2495Cys | p.R2495C | Q14315 | protein_coding | deleterious(0) | probably_damaging(0.932) | TCGA-A2-A0CO-01 | Breast | breast invasive carcinoma | Female | >=65 | I/II | Hormone Therapy | tamoxiphen | CR |
| FLNC | SNV | Missense_Mutation | c.7766A>T | p.Lys2589Met | p.K2589M | Q14315 | protein_coding | deleterious(0.01) | probably_damaging(0.989) | TCGA-A8-A08L-01 | Breast | breast invasive carcinoma | Female | >=65 | III/IV | Unknown | Unknown | SD | |
| FLNC | SNV | Missense_Mutation | rs748008658 | c.4133C>T | p.Ala1378Val | p.A1378V | Q14315 | protein_coding | deleterious(0) | probably_damaging(1) | TCGA-AC-A5XU-01 | Breast | breast invasive carcinoma | Female | >=65 | I/II | Hormone Therapy | letrozole | SD |
| FLNC | SNV | Missense_Mutation | rs764876916 | c.2239N>A | p.Val747Ile | p.V747I | Q14315 | protein_coding | tolerated(0.07) | benign(0.19) | TCGA-AN-A0AK-01 | Breast | breast invasive carcinoma | Female | >=65 | I/II | Unknown | Unknown | SD |
| FLNC | SNV | Missense_Mutation | c.5838C>G | p.Ile1946Met | p.I1946M | Q14315 | protein_coding | deleterious(0) | probably_damaging(0.937) | TCGA-AN-A0XW-01 | Breast | breast invasive carcinoma | Female | <65 | III/IV | Unknown | Unknown | SD | |
| FLNC | SNV | Missense_Mutation | rs370539335 | c.2163C>A | p.Asn721Lys | p.N721K | Q14315 | protein_coding | tolerated(0.68) | benign(0.025) | TCGA-B6-A0I8-01 | Breast | breast invasive carcinoma | Female | <65 | I/II | Unknown | Unknown | PD |
| FLNC | SNV | Missense_Mutation | rs200295337 | c.7486N>A | p.Val2496Ile | p.V2496I | Q14315 | protein_coding | tolerated(0.14) | possibly_damaging(0.657) | TCGA-B6-A40B-01 | Breast | breast invasive carcinoma | Female | >=65 | I/II | Unknown | Unknown | SD |
| FLNC | SNV | Missense_Mutation | c.5234C>A | p.Ser1745Tyr | p.S1745Y | Q14315 | protein_coding | deleterious(0.04) | benign(0) | TCGA-BH-A18F-01 | Breast | breast invasive carcinoma | Female | <65 | I/II | Chemotherapy | taxotere | CR | |
| FLNC | SNV | Missense_Mutation | rs201006462 | c.2596N>A | p.Asp866Asn | p.D866N | Q14315 | protein_coding | tolerated(0.1) | possibly_damaging(0.868) | TCGA-BH-A18G-01 | Breast | breast invasive carcinoma | Female | >=65 | I/II | Unknown | Unknown | SD |
| Page: 1 2 3 4 5 6 7 8 9 10 11 12 13 14 15 16 17 18 19 20 21 22 23 24 25 26 27 28 29 30 31 32 33 34 35 36 37 38 |
Top |
Related drugs of malignant transformation related genes |
| Identification of chemicals and drugs interact with genes involved in malignant transfromation |
| (DGIdb 4.0) |
| Entrez ID | Symbol | Category | Interaction Types | Drug Claim Name | Drug Name | PMIDs |
| Page: 1 |

Copyright 2023-Present -The University of Texas Health Science Center at Houston |