
|
|||||
|
 | |
| |
| |
| |
| |
| |
|
Gene: DNM1 |
Gene summary for DNM1 |
| Gene information | Species | Human | Gene symbol | DNM1 | Gene ID | 1759 |
| Gene name | dynamin 1 | |
| Gene Alias | DEE31 | |
| Cytomap | 9q34.11 | |
| Gene Type | protein-coding | GO ID | GO:0002029 | UniProtAcc | Q05193 |
Top |
Malignant transformation analysis |
| Identification of the aberrant gene expression in precancerous and cancerous lesions by comparing the gene expression of stem-like cells in diseased tissues with normal stem cells |
| Entrez ID | Symbol | Replicates | Species | Organ | Tissue | Adj P-value | Log2FC | Malignancy |
| 1759 | DNM1 | HCC1_Meng | Human | Liver | HCC | 1.94e-03 | -3.73e-03 | 0.0246 |
| 1759 | DNM1 | HCC1 | Human | Liver | HCC | 2.52e-02 | 1.43e+00 | 0.5336 |
| 1759 | DNM1 | S014 | Human | Liver | HCC | 5.82e-33 | 1.01e+00 | 0.2254 |
| 1759 | DNM1 | S015 | Human | Liver | HCC | 5.65e-28 | 8.58e-01 | 0.2375 |
| 1759 | DNM1 | S016 | Human | Liver | HCC | 2.09e-37 | 1.01e+00 | 0.2243 |
| 1759 | DNM1 | S027 | Human | Liver | HCC | 4.78e-09 | 5.42e-01 | 0.2446 |
| 1759 | DNM1 | S028 | Human | Liver | HCC | 3.43e-18 | 5.17e-01 | 0.2503 |
| 1759 | DNM1 | S029 | Human | Liver | HCC | 7.71e-11 | 4.00e-01 | 0.2581 |
| 1759 | DNM1 | ATC09 | Human | Thyroid | ATC | 1.12e-05 | 2.16e-01 | 0.2871 |
| 1759 | DNM1 | ATC12 | Human | Thyroid | ATC | 5.13e-22 | 4.26e-01 | 0.34 |
| 1759 | DNM1 | ATC13 | Human | Thyroid | ATC | 1.51e-53 | 1.06e+00 | 0.34 |
| 1759 | DNM1 | ATC1 | Human | Thyroid | ATC | 8.73e-06 | 2.51e-01 | 0.2878 |
| 1759 | DNM1 | ATC4 | Human | Thyroid | ATC | 3.45e-27 | 5.05e-01 | 0.34 |
| 1759 | DNM1 | ATC5 | Human | Thyroid | ATC | 1.60e-62 | 1.12e+00 | 0.34 |
| Page: 1 |
| Tissue | Expression Dynamics | Abbreviation |
| Liver | 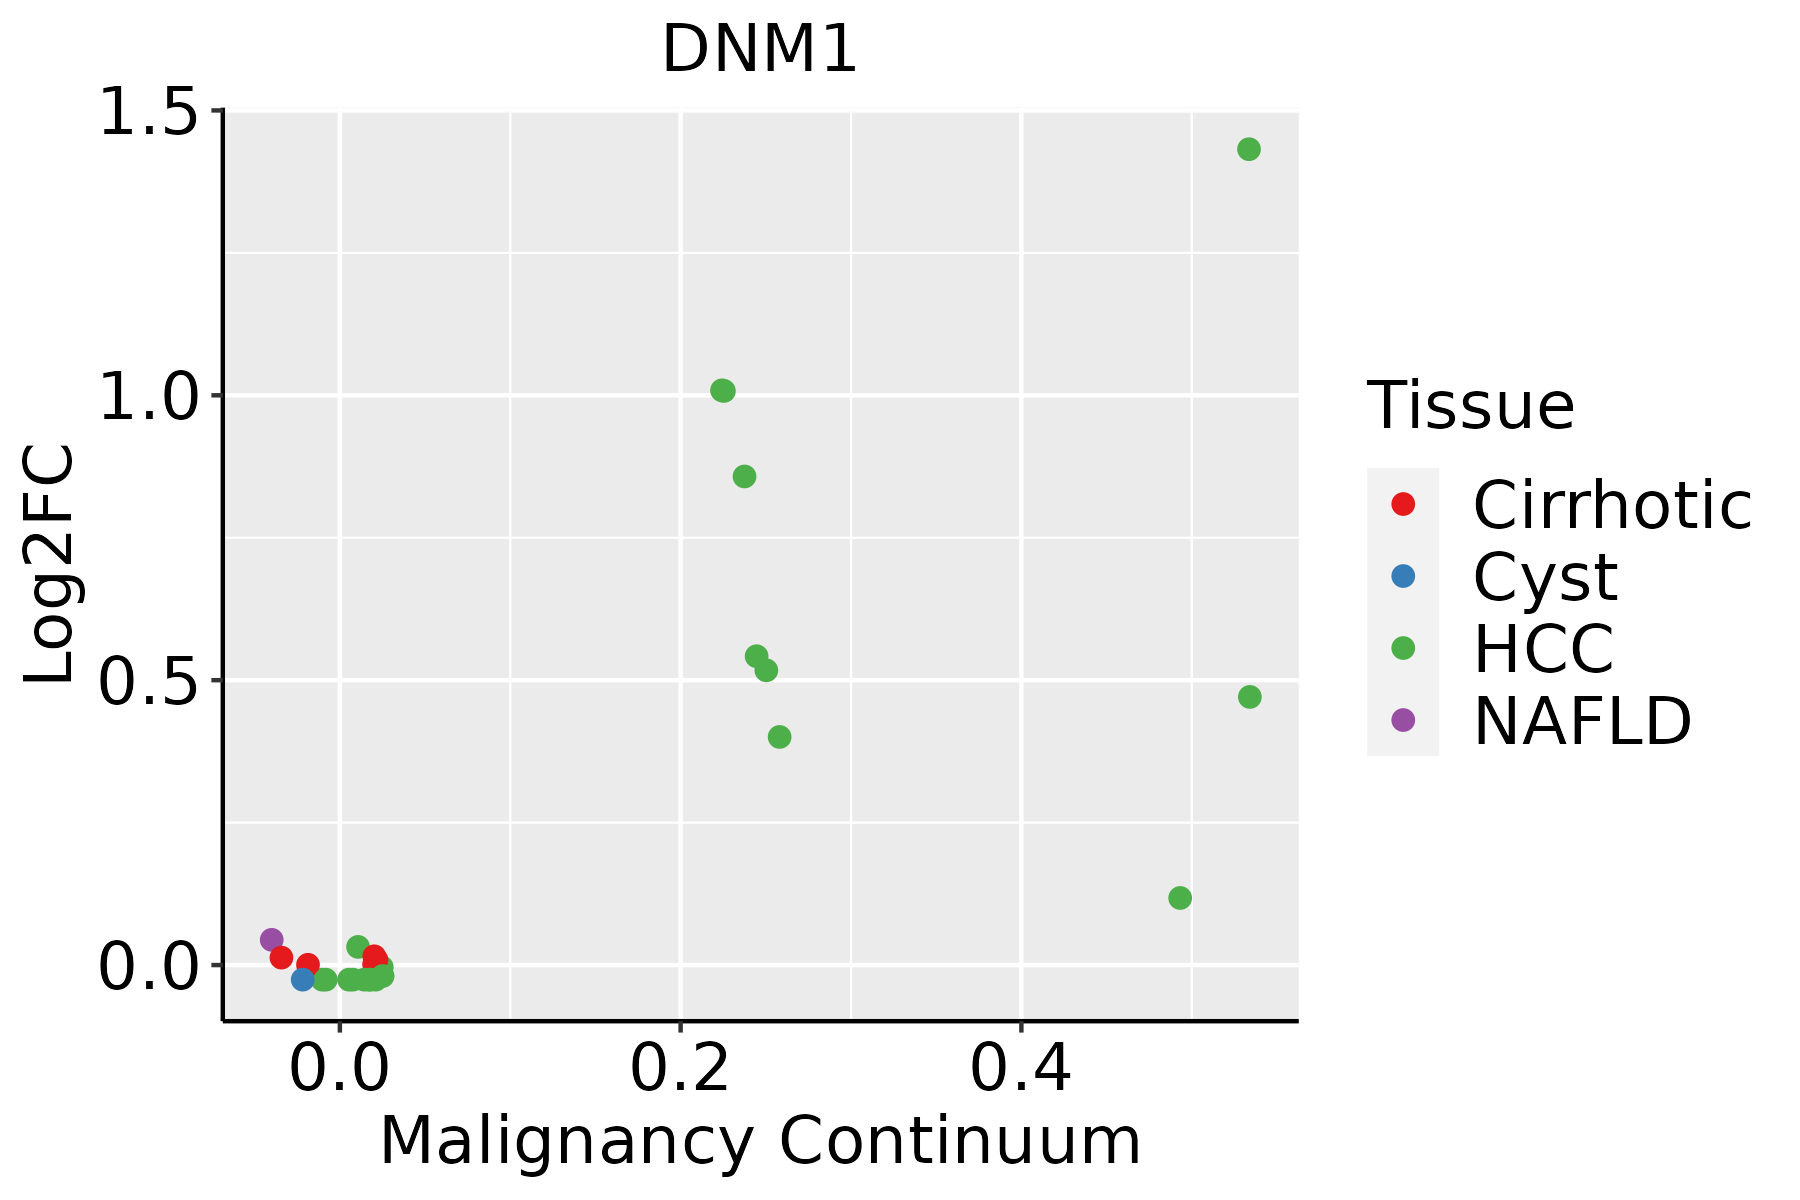 | HCC: Hepatocellular carcinoma |
| NAFLD: Non-alcoholic fatty liver disease | ||
| Thyroid |  | ATC: Anaplastic thyroid cancer |
| HT: Hashimoto's thyroiditis | ||
| PTC: Papillary thyroid cancer |
| ∗log2FC in expression of this searched gene in stem-like cells from each diseased tissue sample relative to stem-like cells in normal samples in each tissue plotted against the malignancy continuum. Samples are colored based on if they are from different disease stage. |
Top |
Malignant transformation related pathway analysis |
| Find out the enriched GO biological processes and KEGG pathways involved in transition from healthy to precancer to cancer |
| Tissue | Disease Stage | Enriched GO biological Processes |
| Oral cavity | OSCC |  |
| Oral cavity | LP |  |
| Oral cavity | EOLP |  |
| Oral cavity | NEOLP |  |
| Esophagus | HGIN |  |
| ∗Top 15 enriched GO BP terms are showed in the bar plot of each disease state in each tissue. Each row represents a significant GO biological process which is colored according to the -log10(p.adjust). |
| Page: 1 2 3 4 5 6 7 8 9 |
| GO ID | Tissue | Disease Stage | Description | Gene Ratio | Bg Ratio | pvalue | p.adjust | Count |
| GO:004603410 | Cervix | CC | ATP metabolic process | 90/2311 | 277/18723 | 7.90e-19 | 2.36e-15 | 90 |
| GO:009719310 | Cervix | CC | intrinsic apoptotic signaling pathway | 85/2311 | 288/18723 | 4.56e-15 | 6.46e-12 | 85 |
| GO:200123310 | Cervix | CC | regulation of apoptotic signaling pathway | 96/2311 | 356/18723 | 4.08e-14 | 3.05e-11 | 96 |
| GO:002260410 | Cervix | CC | regulation of cell morphogenesis | 84/2311 | 309/18723 | 1.00e-12 | 4.29e-10 | 84 |
| GO:200124210 | Cervix | CC | regulation of intrinsic apoptotic signaling pathway | 52/2311 | 164/18723 | 5.06e-11 | 1.01e-08 | 52 |
| GO:007149610 | Cervix | CC | cellular response to external stimulus | 78/2311 | 320/18723 | 1.82e-09 | 1.98e-07 | 78 |
| GO:00321035 | Cervix | CC | positive regulation of response to external stimulus | 95/2311 | 427/18723 | 5.44e-09 | 5.03e-07 | 95 |
| GO:005122210 | Cervix | CC | positive regulation of protein transport | 72/2311 | 303/18723 | 2.36e-08 | 1.70e-06 | 72 |
| GO:00603267 | Cervix | CC | cell chemotaxis | 73/2311 | 310/18723 | 2.82e-08 | 1.96e-06 | 73 |
| GO:005125810 | Cervix | CC | protein polymerization | 70/2311 | 297/18723 | 5.20e-08 | 3.11e-06 | 70 |
| GO:00975298 | Cervix | CC | myeloid leukocyte migration | 56/2311 | 220/18723 | 7.21e-08 | 4.15e-06 | 56 |
| GO:190495110 | Cervix | CC | positive regulation of establishment of protein localization | 73/2311 | 319/18723 | 9.69e-08 | 5.25e-06 | 73 |
| GO:00305957 | Cervix | CC | leukocyte chemotaxis | 57/2311 | 230/18723 | 1.48e-07 | 7.07e-06 | 57 |
| GO:00716218 | Cervix | CC | granulocyte chemotaxis | 37/2311 | 125/18723 | 2.16e-07 | 9.56e-06 | 37 |
| GO:00107699 | Cervix | CC | regulation of cell morphogenesis involved in differentiation | 31/2311 | 96/18723 | 2.43e-07 | 1.05e-05 | 31 |
| GO:20012357 | Cervix | CC | positive regulation of apoptotic signaling pathway | 37/2311 | 126/18723 | 2.70e-07 | 1.12e-05 | 37 |
| GO:00316689 | Cervix | CC | cellular response to extracellular stimulus | 59/2311 | 246/18723 | 3.03e-07 | 1.24e-05 | 59 |
| GO:00163587 | Cervix | CC | dendrite development | 58/2311 | 243/18723 | 4.52e-07 | 1.76e-05 | 58 |
| GO:00509007 | Cervix | CC | leukocyte migration | 78/2311 | 369/18723 | 1.09e-06 | 3.80e-05 | 78 |
| GO:00975308 | Cervix | CC | granulocyte migration | 39/2311 | 148/18723 | 2.67e-06 | 7.87e-05 | 39 |
| Page: 1 2 3 4 5 6 7 8 9 10 11 12 13 14 15 16 17 18 19 20 21 22 23 24 25 26 27 28 29 30 31 32 33 34 35 36 37 38 39 40 41 |
| Pathway ID | Tissue | Disease Stage | Description | Gene Ratio | Bg Ratio | pvalue | p.adjust | qvalue | Count |
| hsa0414422 | Liver | HCC | Endocytosis | 178/4020 | 251/8465 | 2.03e-14 | 5.22e-13 | 2.91e-13 | 178 |
| hsa0510022 | Liver | HCC | Bacterial invasion of epithelial cells | 51/4020 | 77/8465 | 6.67e-04 | 2.72e-03 | 1.52e-03 | 51 |
| hsa0414432 | Liver | HCC | Endocytosis | 178/4020 | 251/8465 | 2.03e-14 | 5.22e-13 | 2.91e-13 | 178 |
| hsa0510032 | Liver | HCC | Bacterial invasion of epithelial cells | 51/4020 | 77/8465 | 6.67e-04 | 2.72e-03 | 1.52e-03 | 51 |
| Page: 1 |
Top |
Cell-cell communication analysis |
| Identification of potential cell-cell interactions between two cell types and their ligand-receptor pairs for different disease states |
| Ligand | Receptor | LRpair | Pathway | Tissue | Disease Stage |
| Page: 1 |
Top |
Single-cell gene regulatory network inference analysis |
| Find out the significant the regulons (TFs) and the target genes of each regulon across cell types for different disease states |
| TF | Cell Type | Tissue | Disease Stage | Target Gene | RSS | Regulon Activity |
| ∗The dot plots of a searched regulon are shown for all cell subpopulations in each disease state of each tissue based on the regulon specific score inferred using pySCENIC and by calculating the average expression. |
| Page: 1 |
Top |
Somatic mutation of malignant transformation related genes |
| Annotation of somatic variants for genes involved in malignant transformation |
| Hugo Symbol | Variant Class | Variant Classification | dbSNP RS | HGVSc | HGVSp | HGVSp Short | SWISSPROT | BIOTYPE | SIFT | PolyPhen | Tumor Sample Barcode | Tissue | Histology | Sex | Age | Stage | Therapy Types | Drugs | Outcome |
| DNM1 | SNV | Missense_Mutation | novel | c.370G>T | p.Val124Phe | p.V124F | Q05193 | protein_coding | deleterious(0) | probably_damaging(1) | TCGA-A2-A04T-01 | Breast | breast invasive carcinoma | Female | <65 | I/II | Chemotherapy | cyclophosphamide | SD |
| DNM1 | SNV | Missense_Mutation | rs755327329 | c.1319N>A | p.Arg440Lys | p.R440K | Q05193 | protein_coding | tolerated(0.19) | benign(0.09) | TCGA-A2-A0CX-01 | Breast | breast invasive carcinoma | Female | <65 | I/II | Chemotherapy | adriamycin | SD |
| DNM1 | SNV | Missense_Mutation | novel | c.536C>T | p.Ser179Phe | p.S179F | Q05193 | protein_coding | deleterious(0) | probably_damaging(0.998) | TCGA-AC-A5XS-01 | Breast | breast invasive carcinoma | Female | >=65 | I/II | Hormone Therapy | femara | SD |
| DNM1 | SNV | Missense_Mutation | c.767G>T | p.Arg256Leu | p.R256L | Q05193 | protein_coding | deleterious(0.01) | probably_damaging(0.992) | TCGA-AO-A0J9-01 | Breast | breast invasive carcinoma | Female | <65 | III/IV | Chemotherapy | cyclophosphamide | PD | |
| DNM1 | SNV | Missense_Mutation | c.1978G>C | p.Glu660Gln | p.E660Q | Q05193 | protein_coding | deleterious(0.02) | probably_damaging(0.988) | TCGA-B6-A1KF-01 | Breast | breast invasive carcinoma | Female | >=65 | I/II | Unknown | Unknown | SD | |
| DNM1 | SNV | Missense_Mutation | rs773857861 | c.1394N>A | p.Arg465Gln | p.R465Q | Q05193 | protein_coding | deleterious(0.03) | possibly_damaging(0.788) | TCGA-C8-A1HG-01 | Breast | breast invasive carcinoma | Female | <65 | I/II | Unknown | Unknown | SD |
| DNM1 | SNV | Missense_Mutation | novel | c.623N>G | p.Asp208Gly | p.D208G | Q05193 | protein_coding | deleterious(0) | probably_damaging(0.988) | TCGA-D8-A1XK-01 | Breast | breast invasive carcinoma | Female | <65 | I/II | Chemotherapy | doxorubicine+cyclophosphamide | SD |
| DNM1 | SNV | Missense_Mutation | c.1564N>T | p.Arg522Cys | p.R522C | Q05193 | protein_coding | deleterious(0.05) | probably_damaging(0.954) | TCGA-E2-A1LA-01 | Breast | breast invasive carcinoma | Female | <65 | I/II | Hormone Therapy | arimidex | SD | |
| DNM1 | SNV | Missense_Mutation | c.2001N>A | p.Asp667Glu | p.D667E | Q05193 | protein_coding | tolerated(0.1) | probably_damaging(0.989) | TCGA-E2-A1LS-01 | Breast | breast invasive carcinoma | Female | <65 | I/II | Unspecific | Cyclophosphamide | SD | |
| DNM1 | SNV | Missense_Mutation | novel | c.634G>A | p.Glu212Lys | p.E212K | Q05193 | protein_coding | deleterious(0.04) | probably_damaging(0.97) | TCGA-E9-A2JT-01 | Breast | breast invasive carcinoma | Female | <65 | I/II | Hormone Therapy | tamoxiphen | SD |
| Page: 1 2 3 4 5 6 7 8 9 |
Top |
Related drugs of malignant transformation related genes |
| Identification of chemicals and drugs interact with genes involved in malignant transfromation |
| (DGIdb 4.0) |
| Entrez ID | Symbol | Category | Interaction Types | Drug Claim Name | Drug Name | PMIDs |
| Page: 1 |

Copyright 2023-Present -The University of Texas Health Science Center at Houston |