
|
|||||
|
 | |
| |
| |
| |
| |
| |
|
Gene: DNASE2 |
Gene summary for DNASE2 |
| Gene information | Species | Human | Gene symbol | DNASE2 | Gene ID | 1777 |
| Gene name | deoxyribonuclease 2, lysosomal | |
| Gene Alias | DNASE2A | |
| Cytomap | 19p13.13 | |
| Gene Type | protein-coding | GO ID | GO:0000737 | UniProtAcc | A0A024R7F4 |
Top |
Malignant transformation analysis |
| Identification of the aberrant gene expression in precancerous and cancerous lesions by comparing the gene expression of stem-like cells in diseased tissues with normal stem cells |
| Entrez ID | Symbol | Replicates | Species | Organ | Tissue | Adj P-value | Log2FC | Malignancy |
| 1777 | DNASE2 | GSM4909281 | Human | Breast | IDC | 7.74e-04 | 2.30e-01 | 0.21 |
| 1777 | DNASE2 | GSM4909282 | Human | Breast | IDC | 1.61e-09 | 3.71e-01 | -0.0288 |
| 1777 | DNASE2 | GSM4909285 | Human | Breast | IDC | 1.06e-22 | 5.60e-01 | 0.21 |
| 1777 | DNASE2 | GSM4909311 | Human | Breast | IDC | 7.92e-06 | -2.43e-02 | 0.1534 |
| 1777 | DNASE2 | GSM4909319 | Human | Breast | IDC | 1.88e-07 | -1.26e-02 | 0.1563 |
| 1777 | DNASE2 | brca2 | Human | Breast | Precancer | 2.23e-02 | 1.61e-01 | -0.024 |
| 1777 | DNASE2 | P1 | Human | Breast | IDC | 8.56e-03 | 1.56e-01 | 0.1527 |
| 1777 | DNASE2 | DCIS2 | Human | Breast | DCIS | 3.00e-34 | 8.21e-02 | 0.0085 |
| 1777 | DNASE2 | LZE4T | Human | Esophagus | ESCC | 1.16e-10 | 3.75e-01 | 0.0811 |
| 1777 | DNASE2 | LZE7T | Human | Esophagus | ESCC | 3.77e-08 | 5.63e-01 | 0.0667 |
| 1777 | DNASE2 | LZE8T | Human | Esophagus | ESCC | 3.00e-06 | 1.63e-01 | 0.067 |
| 1777 | DNASE2 | LZE22T | Human | Esophagus | ESCC | 1.32e-07 | 3.67e-01 | 0.068 |
| 1777 | DNASE2 | LZE24T | Human | Esophagus | ESCC | 4.89e-26 | 7.66e-01 | 0.0596 |
| 1777 | DNASE2 | LZE21T | Human | Esophagus | ESCC | 2.47e-02 | 5.52e-01 | 0.0655 |
| 1777 | DNASE2 | LZE6T | Human | Esophagus | ESCC | 3.69e-04 | 4.31e-01 | 0.0845 |
| 1777 | DNASE2 | P1T-E | Human | Esophagus | ESCC | 7.86e-15 | 8.33e-01 | 0.0875 |
| 1777 | DNASE2 | P2T-E | Human | Esophagus | ESCC | 3.70e-28 | 5.02e-01 | 0.1177 |
| 1777 | DNASE2 | P4T-E | Human | Esophagus | ESCC | 3.98e-28 | 8.19e-01 | 0.1323 |
| 1777 | DNASE2 | P5T-E | Human | Esophagus | ESCC | 4.79e-14 | 4.02e-01 | 0.1327 |
| 1777 | DNASE2 | P8T-E | Human | Esophagus | ESCC | 1.18e-39 | 7.98e-01 | 0.0889 |
| Page: 1 2 3 4 5 6 7 |
| Tissue | Expression Dynamics | Abbreviation |
| Breast | 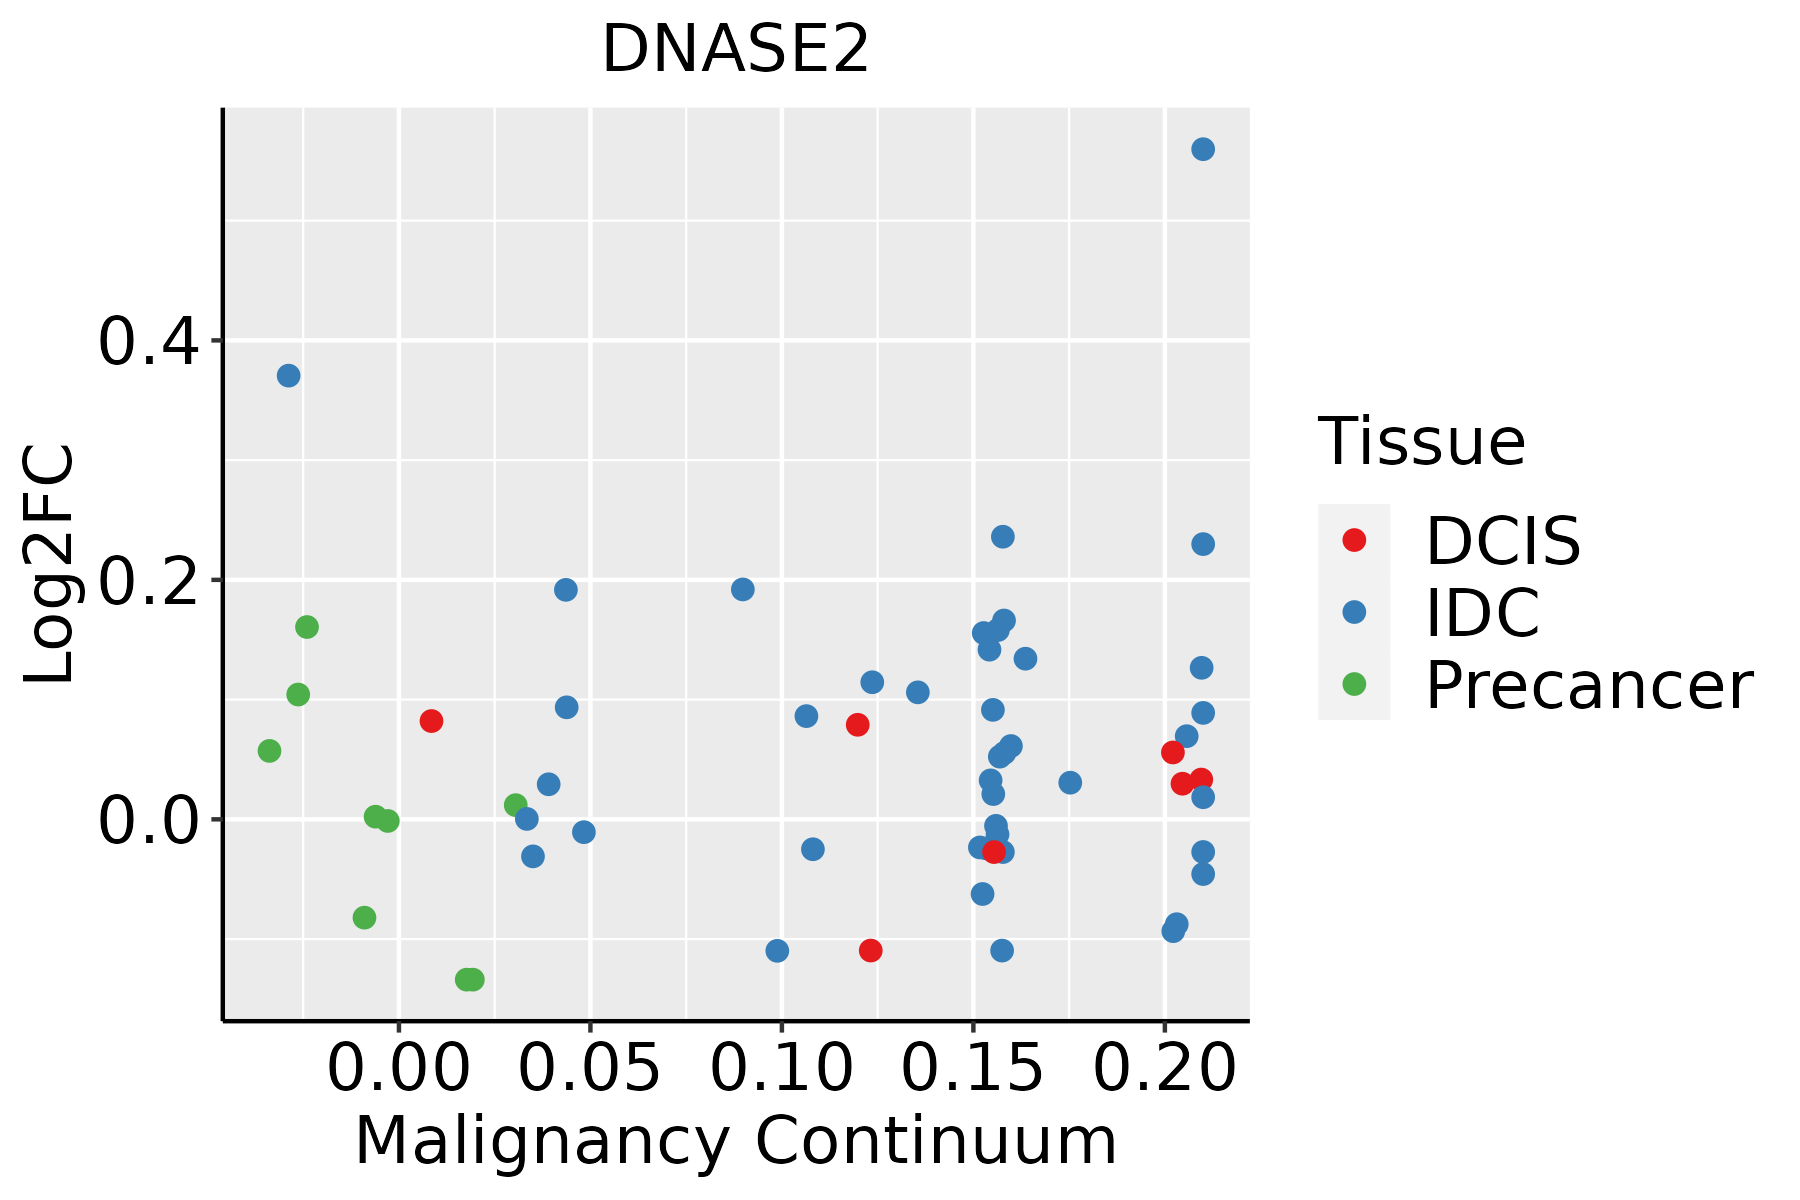 | IDC: Invasive ductal carcinoma |
| DCIS: Ductal carcinoma in situ | ||
| Precancer(BRCA1-mut): Precancerous lesion from BRCA1 mutation carriers | ||
| Esophagus |  | ESCC: Esophageal squamous cell carcinoma |
| HGIN: High-grade intraepithelial neoplasias | ||
| LGIN: Low-grade intraepithelial neoplasias | ||
| Liver | 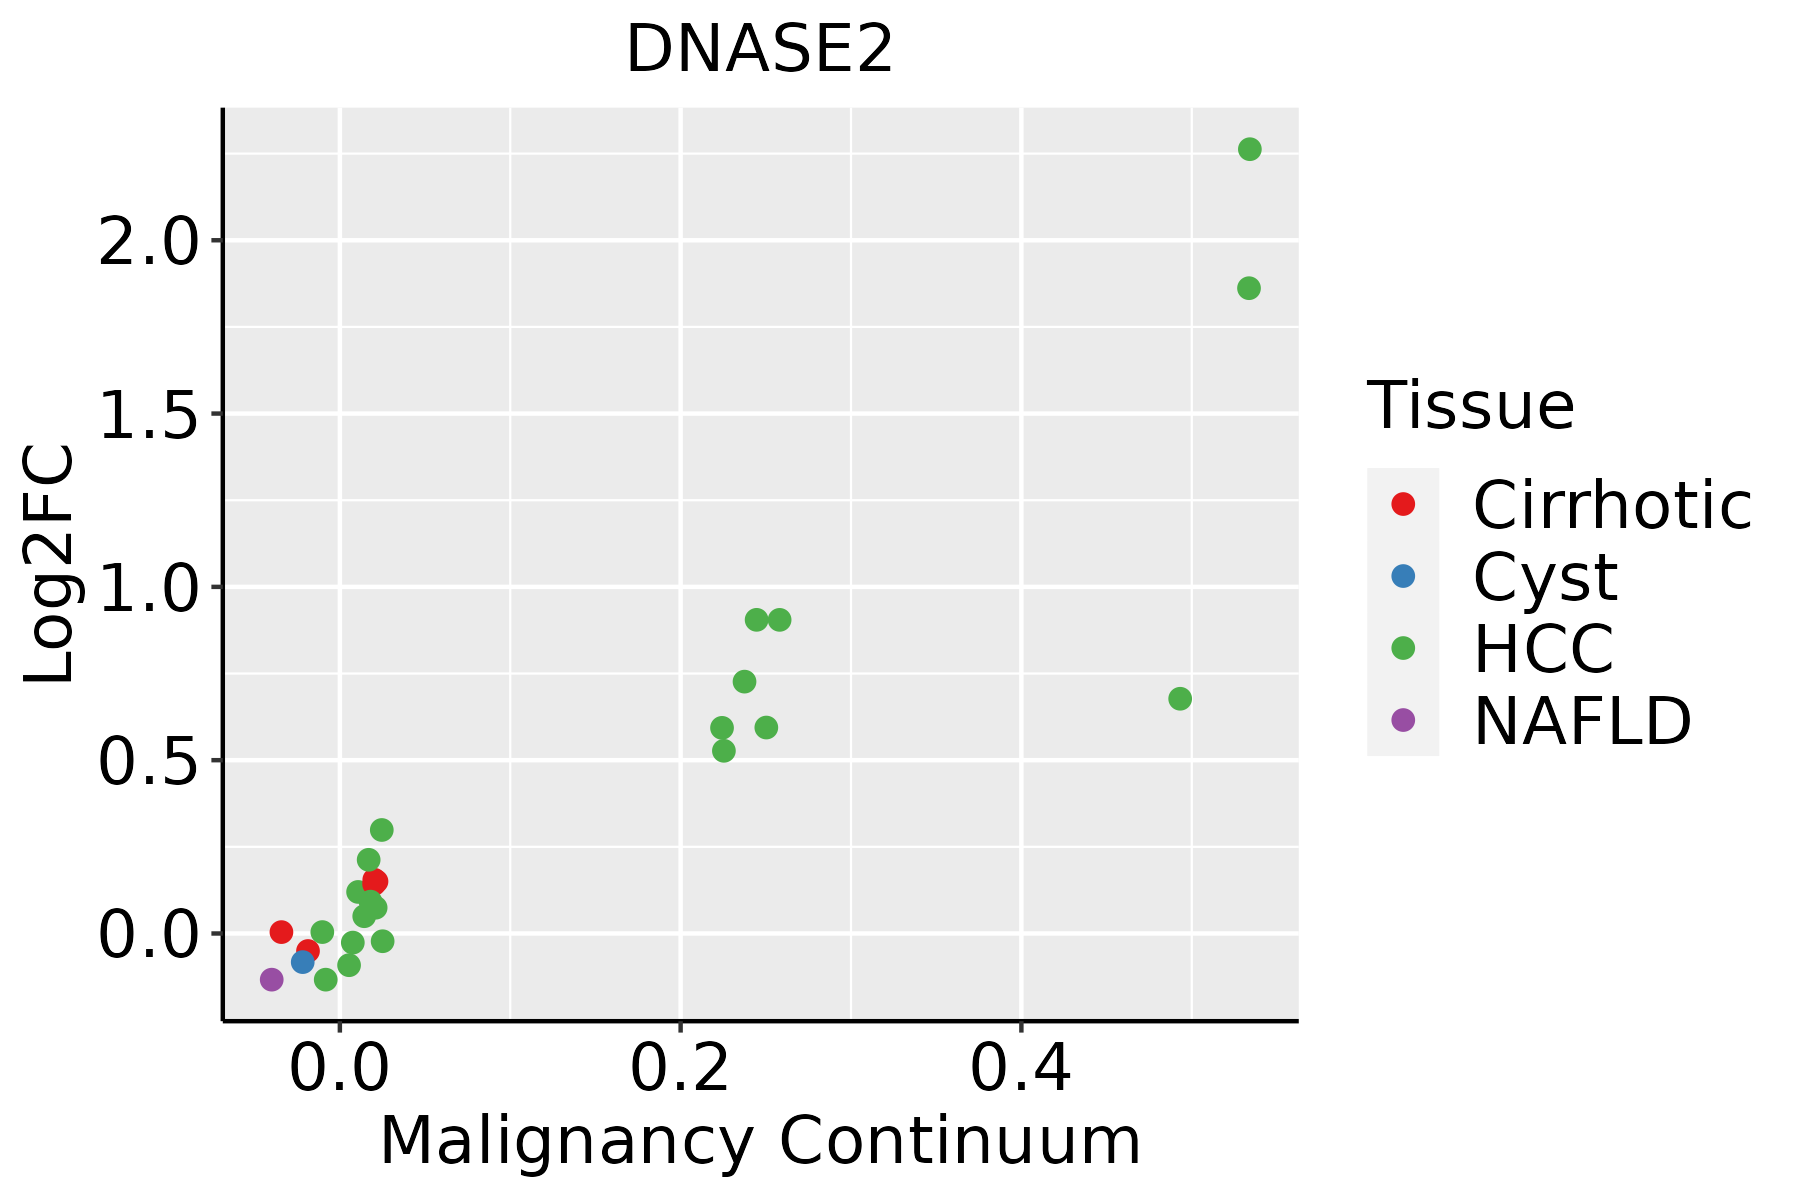 | HCC: Hepatocellular carcinoma |
| NAFLD: Non-alcoholic fatty liver disease | ||
| Oral Cavity | 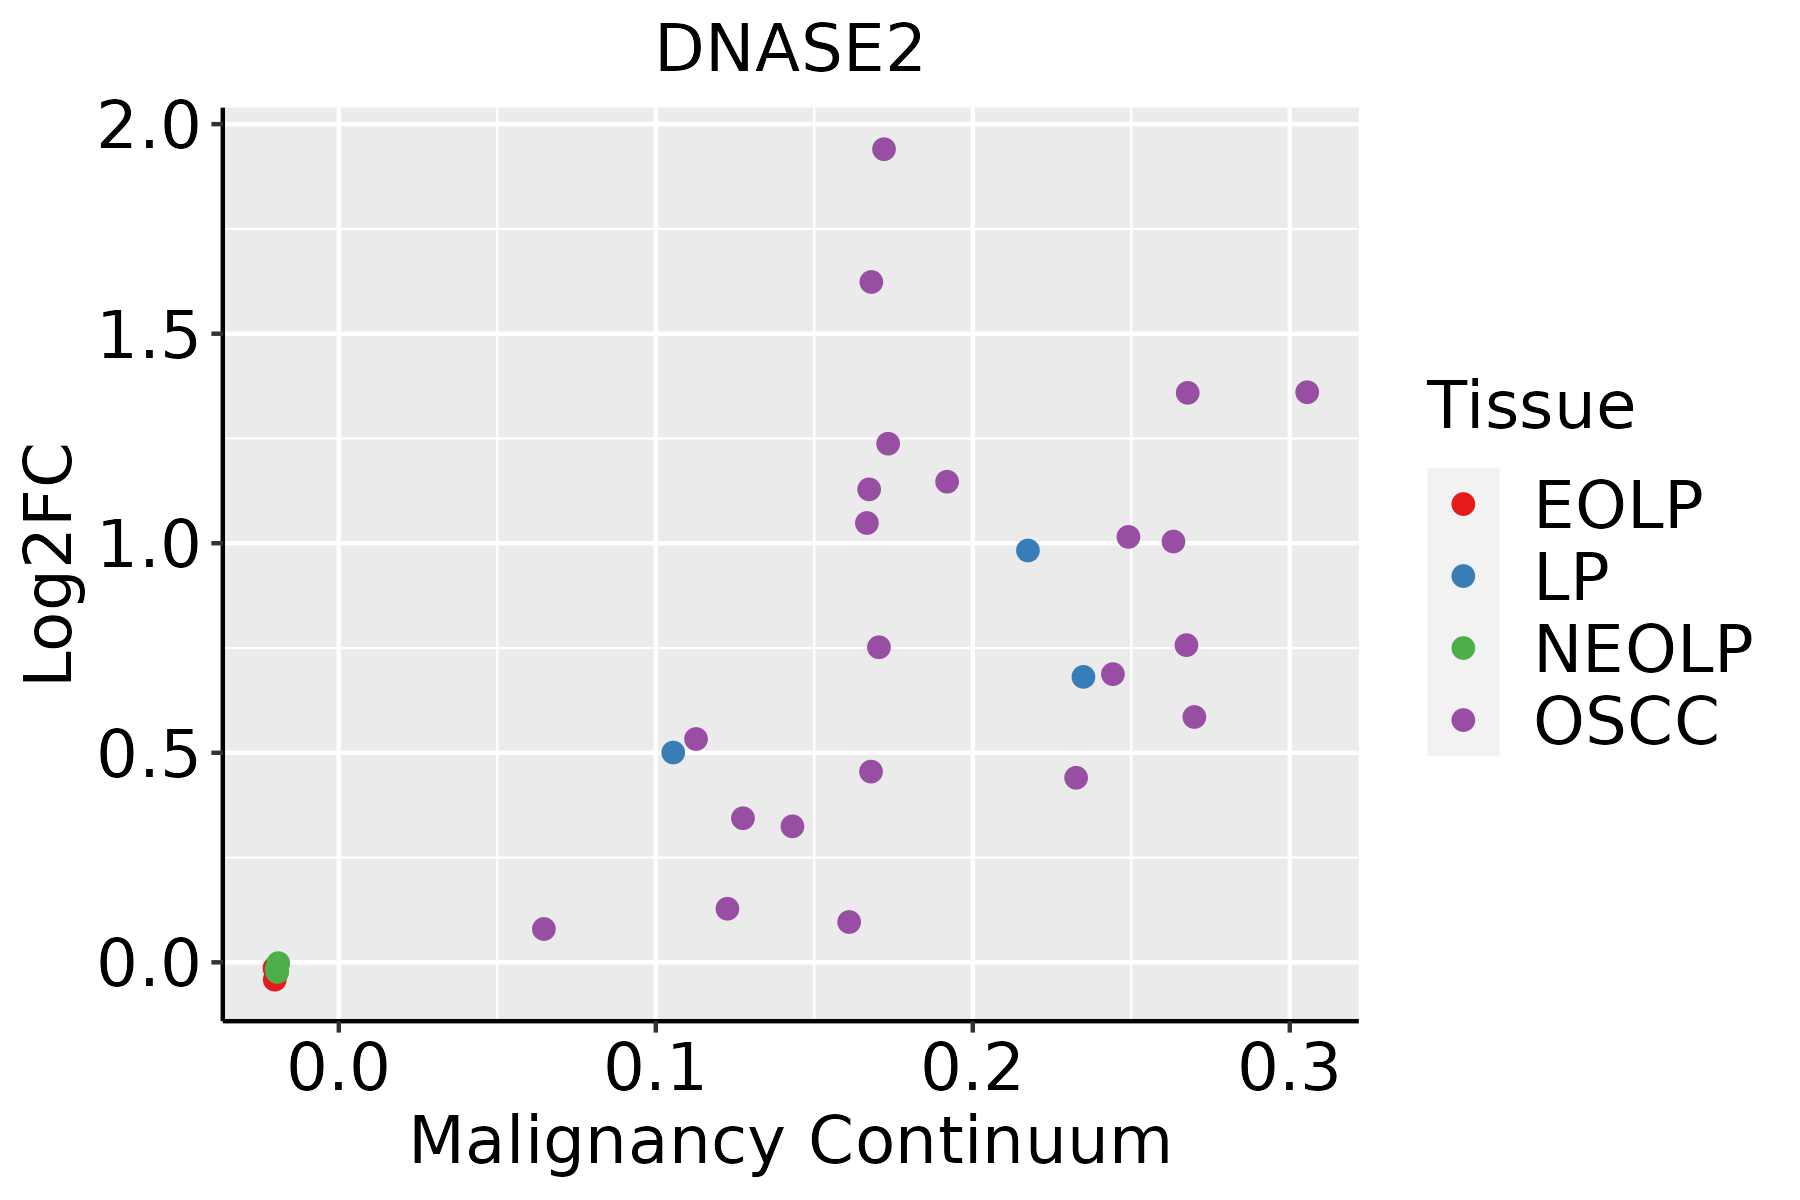 | EOLP: Erosive Oral lichen planus |
| LP: leukoplakia | ||
| NEOLP: Non-erosive oral lichen planus | ||
| OSCC: Oral squamous cell carcinoma | ||
| Skin | 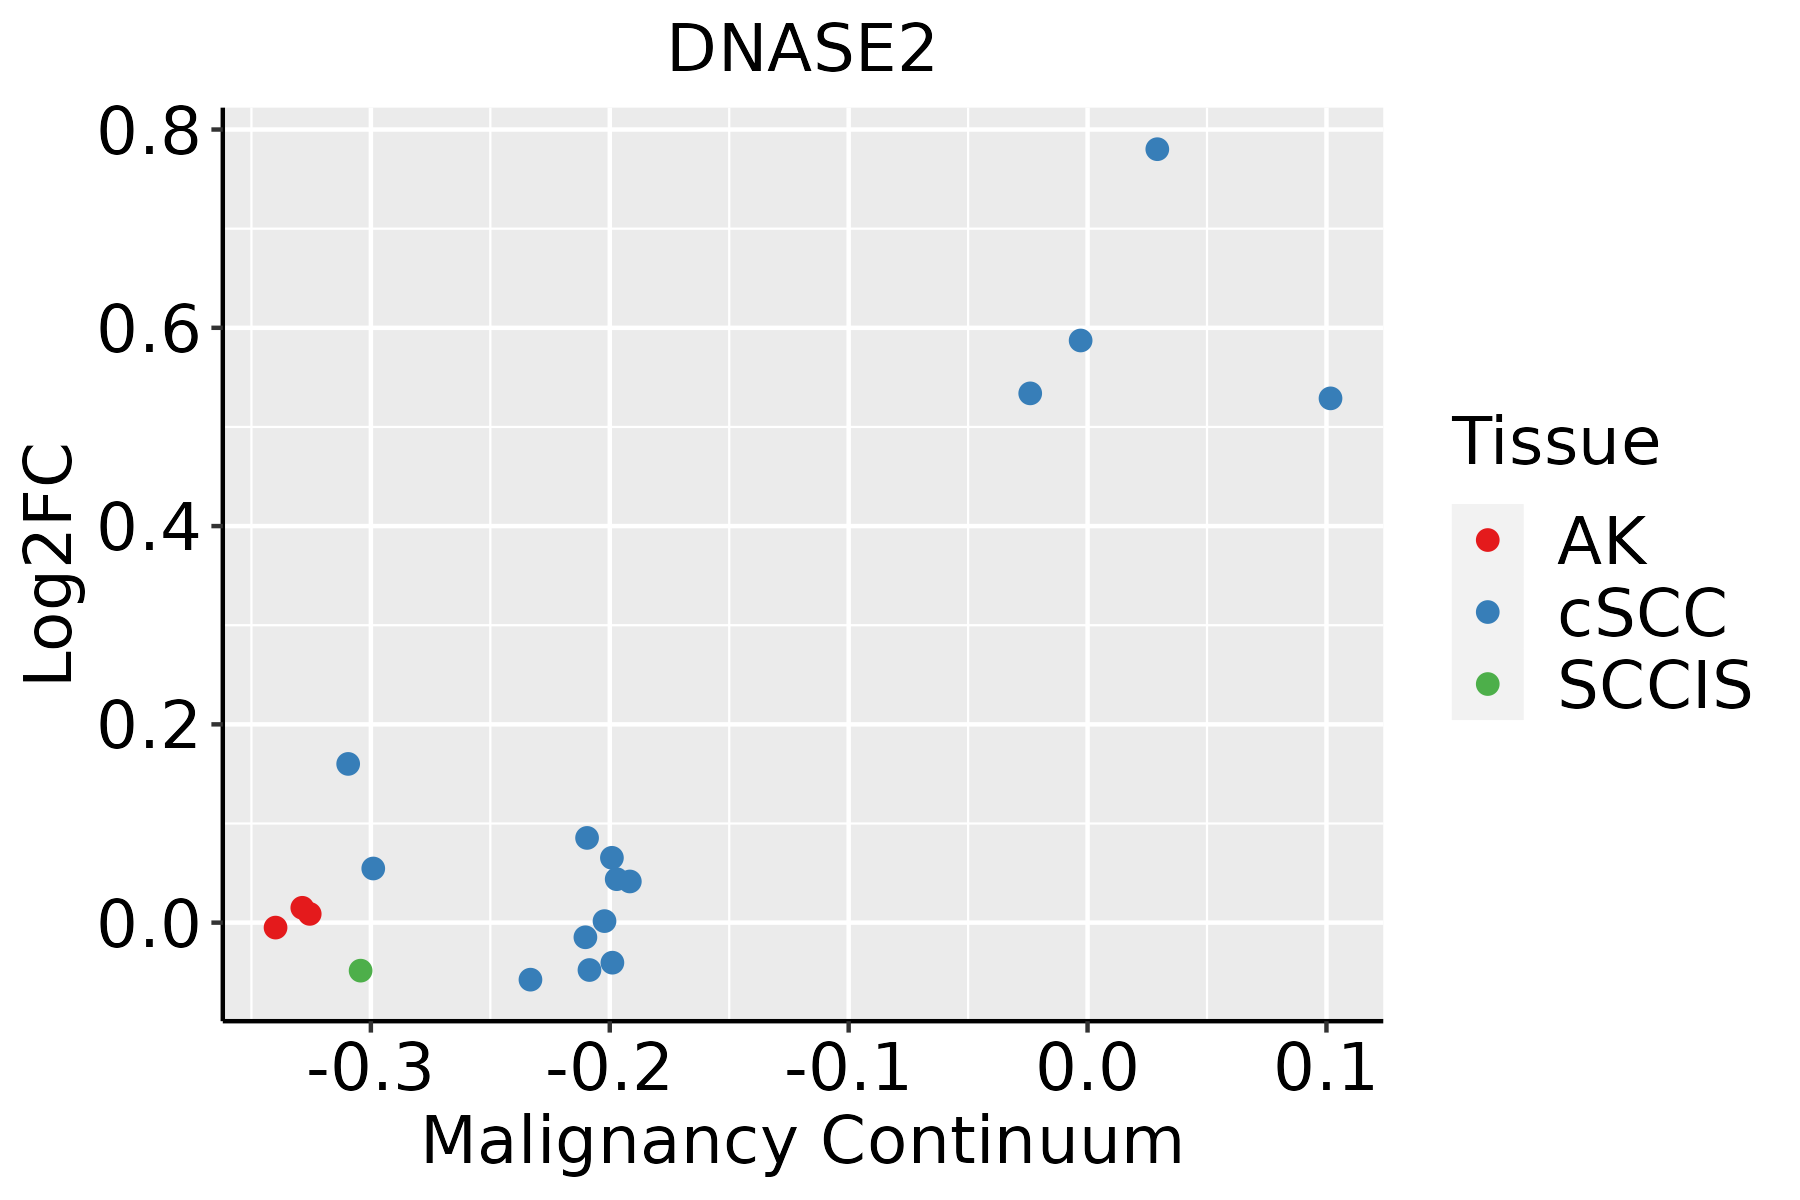 | AK: Actinic keratosis |
| cSCC: Cutaneous squamous cell carcinoma | ||
| SCCIS:squamous cell carcinoma in situ | ||
| Thyroid |  | ATC: Anaplastic thyroid cancer |
| HT: Hashimoto's thyroiditis | ||
| PTC: Papillary thyroid cancer |
| ∗log2FC in expression of this searched gene in stem-like cells from each diseased tissue sample relative to stem-like cells in normal samples in each tissue plotted against the malignancy continuum. Samples are colored based on if they are from different disease stage. |
Top |
Malignant transformation related pathway analysis |
| Find out the enriched GO biological processes and KEGG pathways involved in transition from healthy to precancer to cancer |
| Tissue | Disease Stage | Enriched GO biological Processes |
| Oral cavity | OSCC |  |
| Oral cavity | LP |  |
| Oral cavity | EOLP |  |
| Oral cavity | NEOLP |  |
| Esophagus | HGIN |  |
| ∗Top 15 enriched GO BP terms are showed in the bar plot of each disease state in each tissue. Each row represents a significant GO biological process which is colored according to the -log10(p.adjust). |
| Page: 1 2 3 4 5 6 7 8 9 |
| GO ID | Tissue | Disease Stage | Description | Gene Ratio | Bg Ratio | pvalue | p.adjust | Count |
| GO:00022629 | Breast | Precancer | myeloid cell homeostasis | 27/1080 | 157/18723 | 3.10e-07 | 1.49e-05 | 27 |
| GO:00341019 | Breast | Precancer | erythrocyte homeostasis | 23/1080 | 129/18723 | 1.20e-06 | 4.60e-05 | 23 |
| GO:00300999 | Breast | Precancer | myeloid cell differentiation | 45/1080 | 381/18723 | 4.00e-06 | 1.25e-04 | 45 |
| GO:00488729 | Breast | Precancer | homeostasis of number of cells | 32/1080 | 272/18723 | 1.03e-04 | 1.89e-03 | 32 |
| GO:00302189 | Breast | Precancer | erythrocyte differentiation | 18/1080 | 120/18723 | 1.76e-04 | 2.87e-03 | 18 |
| GO:00346558 | Breast | Precancer | nucleobase-containing compound catabolic process | 42/1080 | 407/18723 | 1.91e-04 | 3.06e-03 | 42 |
| GO:00224119 | Breast | Precancer | cellular component disassembly | 44/1080 | 443/18723 | 3.17e-04 | 4.51e-03 | 44 |
| GO:00467007 | Breast | Precancer | heterocycle catabolic process | 44/1080 | 445/18723 | 3.49e-04 | 4.88e-03 | 44 |
| GO:00442708 | Breast | Precancer | cellular nitrogen compound catabolic process | 44/1080 | 451/18723 | 4.64e-04 | 6.12e-03 | 44 |
| GO:00194397 | Breast | Precancer | aromatic compound catabolic process | 44/1080 | 467/18723 | 9.55e-04 | 1.07e-02 | 44 |
| GO:19013617 | Breast | Precancer | organic cyclic compound catabolic process | 45/1080 | 495/18723 | 1.73e-03 | 1.74e-02 | 45 |
| GO:003410114 | Breast | IDC | erythrocyte homeostasis | 27/1434 | 129/18723 | 1.34e-06 | 5.75e-05 | 27 |
| GO:000226214 | Breast | IDC | myeloid cell homeostasis | 30/1434 | 157/18723 | 2.64e-06 | 1.01e-04 | 30 |
| GO:003009914 | Breast | IDC | myeloid cell differentiation | 54/1434 | 381/18723 | 8.07e-06 | 2.39e-04 | 54 |
| GO:003021814 | Breast | IDC | erythrocyte differentiation | 22/1434 | 120/18723 | 1.04e-04 | 1.97e-03 | 22 |
| GO:004887214 | Breast | IDC | homeostasis of number of cells | 36/1434 | 272/18723 | 9.10e-04 | 1.04e-02 | 36 |
| GO:190136112 | Breast | IDC | organic cyclic compound catabolic process | 56/1434 | 495/18723 | 2.12e-03 | 1.99e-02 | 56 |
| GO:004670012 | Breast | IDC | heterocycle catabolic process | 51/1434 | 445/18723 | 2.51e-03 | 2.25e-02 | 51 |
| GO:003465513 | Breast | IDC | nucleobase-containing compound catabolic process | 47/1434 | 407/18723 | 3.12e-03 | 2.63e-02 | 47 |
| GO:004427012 | Breast | IDC | cellular nitrogen compound catabolic process | 50/1434 | 451/18723 | 5.29e-03 | 3.93e-02 | 50 |
| Page: 1 2 3 4 5 6 7 |
| Pathway ID | Tissue | Disease Stage | Description | Gene Ratio | Bg Ratio | pvalue | p.adjust | qvalue | Count |
| hsa0414222 | Esophagus | ESCC | Lysosome | 102/4205 | 132/8465 | 5.11e-11 | 7.13e-10 | 3.65e-10 | 102 |
| hsa046234 | Esophagus | ESCC | Cytosolic DNA-sensing pathway | 49/4205 | 75/8465 | 4.35e-03 | 1.12e-02 | 5.74e-03 | 49 |
| hsa0414232 | Esophagus | ESCC | Lysosome | 102/4205 | 132/8465 | 5.11e-11 | 7.13e-10 | 3.65e-10 | 102 |
| hsa0462311 | Esophagus | ESCC | Cytosolic DNA-sensing pathway | 49/4205 | 75/8465 | 4.35e-03 | 1.12e-02 | 5.74e-03 | 49 |
| hsa041424 | Liver | Cirrhotic | Lysosome | 68/2530 | 132/8465 | 1.34e-07 | 1.97e-06 | 1.21e-06 | 68 |
| hsa0414211 | Liver | Cirrhotic | Lysosome | 68/2530 | 132/8465 | 1.34e-07 | 1.97e-06 | 1.21e-06 | 68 |
| hsa041422 | Liver | HCC | Lysosome | 100/4020 | 132/8465 | 2.32e-11 | 4.31e-10 | 2.40e-10 | 100 |
| hsa041423 | Liver | HCC | Lysosome | 100/4020 | 132/8465 | 2.32e-11 | 4.31e-10 | 2.40e-10 | 100 |
| hsa041425 | Oral cavity | OSCC | Lysosome | 87/3704 | 132/8465 | 1.97e-07 | 1.35e-06 | 6.86e-07 | 87 |
| hsa04623 | Oral cavity | OSCC | Cytosolic DNA-sensing pathway | 44/3704 | 75/8465 | 6.44e-03 | 1.51e-02 | 7.68e-03 | 44 |
| hsa0414212 | Oral cavity | OSCC | Lysosome | 87/3704 | 132/8465 | 1.97e-07 | 1.35e-06 | 6.86e-07 | 87 |
| hsa046231 | Oral cavity | OSCC | Cytosolic DNA-sensing pathway | 44/3704 | 75/8465 | 6.44e-03 | 1.51e-02 | 7.68e-03 | 44 |
| hsa0414221 | Oral cavity | LP | Lysosome | 67/2418 | 132/8465 | 5.13e-08 | 7.77e-07 | 5.01e-07 | 67 |
| hsa046232 | Oral cavity | LP | Cytosolic DNA-sensing pathway | 31/2418 | 75/8465 | 1.17e-02 | 3.91e-02 | 2.52e-02 | 31 |
| hsa0414231 | Oral cavity | LP | Lysosome | 67/2418 | 132/8465 | 5.13e-08 | 7.77e-07 | 5.01e-07 | 67 |
| hsa046233 | Oral cavity | LP | Cytosolic DNA-sensing pathway | 31/2418 | 75/8465 | 1.17e-02 | 3.91e-02 | 2.52e-02 | 31 |
| Page: 1 |
Top |
Cell-cell communication analysis |
| Identification of potential cell-cell interactions between two cell types and their ligand-receptor pairs for different disease states |
| Ligand | Receptor | LRpair | Pathway | Tissue | Disease Stage |
| Page: 1 |
Top |
Single-cell gene regulatory network inference analysis |
| Find out the significant the regulons (TFs) and the target genes of each regulon across cell types for different disease states |
| TF | Cell Type | Tissue | Disease Stage | Target Gene | RSS | Regulon Activity |
| ∗The dot plots of a searched regulon are shown for all cell subpopulations in each disease state of each tissue based on the regulon specific score inferred using pySCENIC and by calculating the average expression. |
| Page: 1 |
Top |
Somatic mutation of malignant transformation related genes |
| Annotation of somatic variants for genes involved in malignant transformation |
| Hugo Symbol | Variant Class | Variant Classification | dbSNP RS | HGVSc | HGVSp | HGVSp Short | SWISSPROT | BIOTYPE | SIFT | PolyPhen | Tumor Sample Barcode | Tissue | Histology | Sex | Age | Stage | Therapy Types | Drugs | Outcome |
| DNASE2 | SNV | Missense_Mutation | novel | c.719C>G | p.Ser240Cys | p.S240C | O00115 | protein_coding | deleterious(0.05) | possibly_damaging(0.895) | TCGA-A7-A4SA-01 | Breast | breast invasive carcinoma | Female | <65 | I/II | Chemotherapy | doxorubicin | CR |
| DNASE2 | SNV | Missense_Mutation | c.124G>C | p.Gly42Arg | p.G42R | O00115 | protein_coding | tolerated(0.23) | benign(0.035) | TCGA-AN-A0FK-01 | Breast | breast invasive carcinoma | Female | >=65 | III/IV | Unknown | Unknown | SD | |
| DNASE2 | SNV | Missense_Mutation | rs766377327 | c.721N>A | p.Gly241Ser | p.G241S | O00115 | protein_coding | tolerated(0.21) | benign(0.274) | TCGA-BH-A0HF-01 | Breast | breast invasive carcinoma | Female | >=65 | I/II | Hormone Therapy | arimidex | SD |
| DNASE2 | insertion | Frame_Shift_Ins | novel | c.296_297insCCCTTGGAGAGAGACTAAAGAAGGACCTGTGCTGATTTGTTTTAGA | p.Gln101TrpfsTer36 | p.Q101Wfs*36 | O00115 | protein_coding | TCGA-A2-A0CP-01 | Breast | breast invasive carcinoma | Female | <65 | I/II | Chemotherapy | cytoxan | SD | ||
| DNASE2 | deletion | Frame_Shift_Del | c.415delG | p.Ala139ProfsTer36 | p.A139Pfs*36 | O00115 | protein_coding | TCGA-B6-A0I9-01 | Breast | breast invasive carcinoma | Female | <65 | III/IV | Unknown | Unknown | PD | |||
| DNASE2 | insertion | Frame_Shift_Ins | novel | c.200_201insGGTATTAAAG | p.Ile68ValfsTer33 | p.I68Vfs*33 | O00115 | protein_coding | TCGA-BH-A0DS-01 | Breast | breast invasive carcinoma | Female | >=65 | III/IV | Chemotherapy | cyclophosphamide | SD | ||
| DNASE2 | insertion | Nonsense_Mutation | novel | c.198_199insATTCTCCTGTCTCAGCCTCCCAAGTAG | p.Ala66_Leu67insIleLeuLeuSerGlnProProLysTer | p.A66_L67insILLSQPPK* | O00115 | protein_coding | TCGA-BH-A0DS-01 | Breast | breast invasive carcinoma | Female | >=65 | III/IV | Chemotherapy | cyclophosphamide | SD | ||
| DNASE2 | insertion | Frame_Shift_Ins | novel | c.87-1_87insTGATCTACCCGCCTTGGCCTCCCAAAGTGCTGGGATTACAGGA | p.Trp29CysfsTer25 | p.W29Cfs*25 | O00115 | protein_coding | TCGA-BH-A0GY-01 | Breast | breast invasive carcinoma | Female | >=65 | I/II | Chemotherapy | cyotxan | SD | ||
| DNASE2 | insertion | Nonsense_Mutation | novel | c.797_798insAAATTAGCCAGACATGGTGGCACGCGTCTGTGGTCCTAGCTC | p.Asn266delinsLysAsnTerProAspMetValAlaArgValCysGlyProSerSer | p.N266delinsKN*PDMVARVCGPSS | O00115 | protein_coding | TCGA-BH-A0GZ-01 | Breast | breast invasive carcinoma | Female | <65 | I/II | Hormone Therapy | arimidex | SD | ||
| DNASE2 | SNV | Missense_Mutation | c.263N>A | p.Ser88Asn | p.S88N | O00115 | protein_coding | tolerated(0.14) | benign(0.241) | TCGA-A6-2686-01 | Colorectum | colon adenocarcinoma | Female | >=65 | I/II | Unknown | Unknown | SD |
| Page: 1 2 3 4 |
Top |
Related drugs of malignant transformation related genes |
| Identification of chemicals and drugs interact with genes involved in malignant transfromation |
| (DGIdb 4.0) |
| Entrez ID | Symbol | Category | Interaction Types | Drug Claim Name | Drug Name | PMIDs |
| Page: 1 |

Copyright 2023-Present -The University of Texas Health Science Center at Houston |