
|
|||||
|
 | |
| |
| |
| |
| |
| |
|
Gene: CD2AP |
Gene summary for CD2AP |
| Gene information | Species | Human | Gene symbol | CD2AP | Gene ID | 23607 |
| Gene name | CD2 associated protein | |
| Gene Alias | CMS | |
| Cytomap | 6p12.3 | |
| Gene Type | protein-coding | GO ID | GO:0001816 | UniProtAcc | Q9Y5K6 |
Top |
Malignant transformation analysis |
| Identification of the aberrant gene expression in precancerous and cancerous lesions by comparing the gene expression of stem-like cells in diseased tissues with normal stem cells |
| Entrez ID | Symbol | Replicates | Species | Organ | Tissue | Adj P-value | Log2FC | Malignancy |
| 23607 | CD2AP | CA_HPV_1 | Human | Cervix | CC | 3.11e-05 | 1.96e-01 | 0.0264 |
| 23607 | CD2AP | CCI_1 | Human | Cervix | CC | 1.84e-05 | 1.04e+00 | 0.528 |
| 23607 | CD2AP | CCI_2 | Human | Cervix | CC | 6.18e-07 | 9.41e-01 | 0.5249 |
| 23607 | CD2AP | CCI_3 | Human | Cervix | CC | 6.70e-08 | 9.45e-01 | 0.516 |
| 23607 | CD2AP | H2 | Human | Cervix | HSIL_HPV | 2.51e-07 | 3.38e-01 | 0.0632 |
| 23607 | CD2AP | HTA11_3410_2000001011 | Human | Colorectum | AD | 7.13e-38 | -8.97e-01 | 0.0155 |
| 23607 | CD2AP | HTA11_2951_2000001011 | Human | Colorectum | AD | 4.42e-05 | -9.02e-01 | 0.0216 |
| 23607 | CD2AP | HTA11_3361_2000001011 | Human | Colorectum | AD | 5.56e-11 | -6.59e-01 | -0.1207 |
| 23607 | CD2AP | HTA11_696_2000001011 | Human | Colorectum | AD | 4.06e-14 | -4.06e-01 | -0.1464 |
| 23607 | CD2AP | HTA11_2992_2000001011 | Human | Colorectum | SER | 1.82e-04 | -5.02e-01 | -0.1706 |
| 23607 | CD2AP | HTA11_5212_2000001011 | Human | Colorectum | AD | 1.25e-05 | -5.39e-01 | -0.2061 |
| 23607 | CD2AP | HTA11_7862_2000001011 | Human | Colorectum | AD | 3.06e-03 | -4.84e-01 | -0.0179 |
| 23607 | CD2AP | HTA11_866_3004761011 | Human | Colorectum | AD | 3.36e-22 | -7.44e-01 | 0.096 |
| 23607 | CD2AP | HTA11_9408_2000001011 | Human | Colorectum | AD | 1.30e-02 | -8.20e-01 | 0.0451 |
| 23607 | CD2AP | HTA11_8622_2000001021 | Human | Colorectum | SER | 1.02e-07 | -8.78e-01 | 0.0528 |
| 23607 | CD2AP | HTA11_10711_2000001011 | Human | Colorectum | AD | 7.31e-16 | -7.45e-01 | 0.0338 |
| 23607 | CD2AP | HTA11_7696_3000711011 | Human | Colorectum | AD | 1.88e-27 | -6.77e-01 | 0.0674 |
| 23607 | CD2AP | HTA11_11156_2000001011 | Human | Colorectum | AD | 1.29e-02 | -8.95e-01 | 0.0397 |
| 23607 | CD2AP | HTA11_6818_2000001021 | Human | Colorectum | AD | 3.67e-13 | -6.85e-01 | 0.0588 |
| 23607 | CD2AP | HTA11_99999970781_79442 | Human | Colorectum | MSS | 5.78e-25 | -6.01e-01 | 0.294 |
| Page: 1 2 3 4 5 6 7 8 9 10 11 12 |
| Tissue | Expression Dynamics | Abbreviation |
| Cervix | 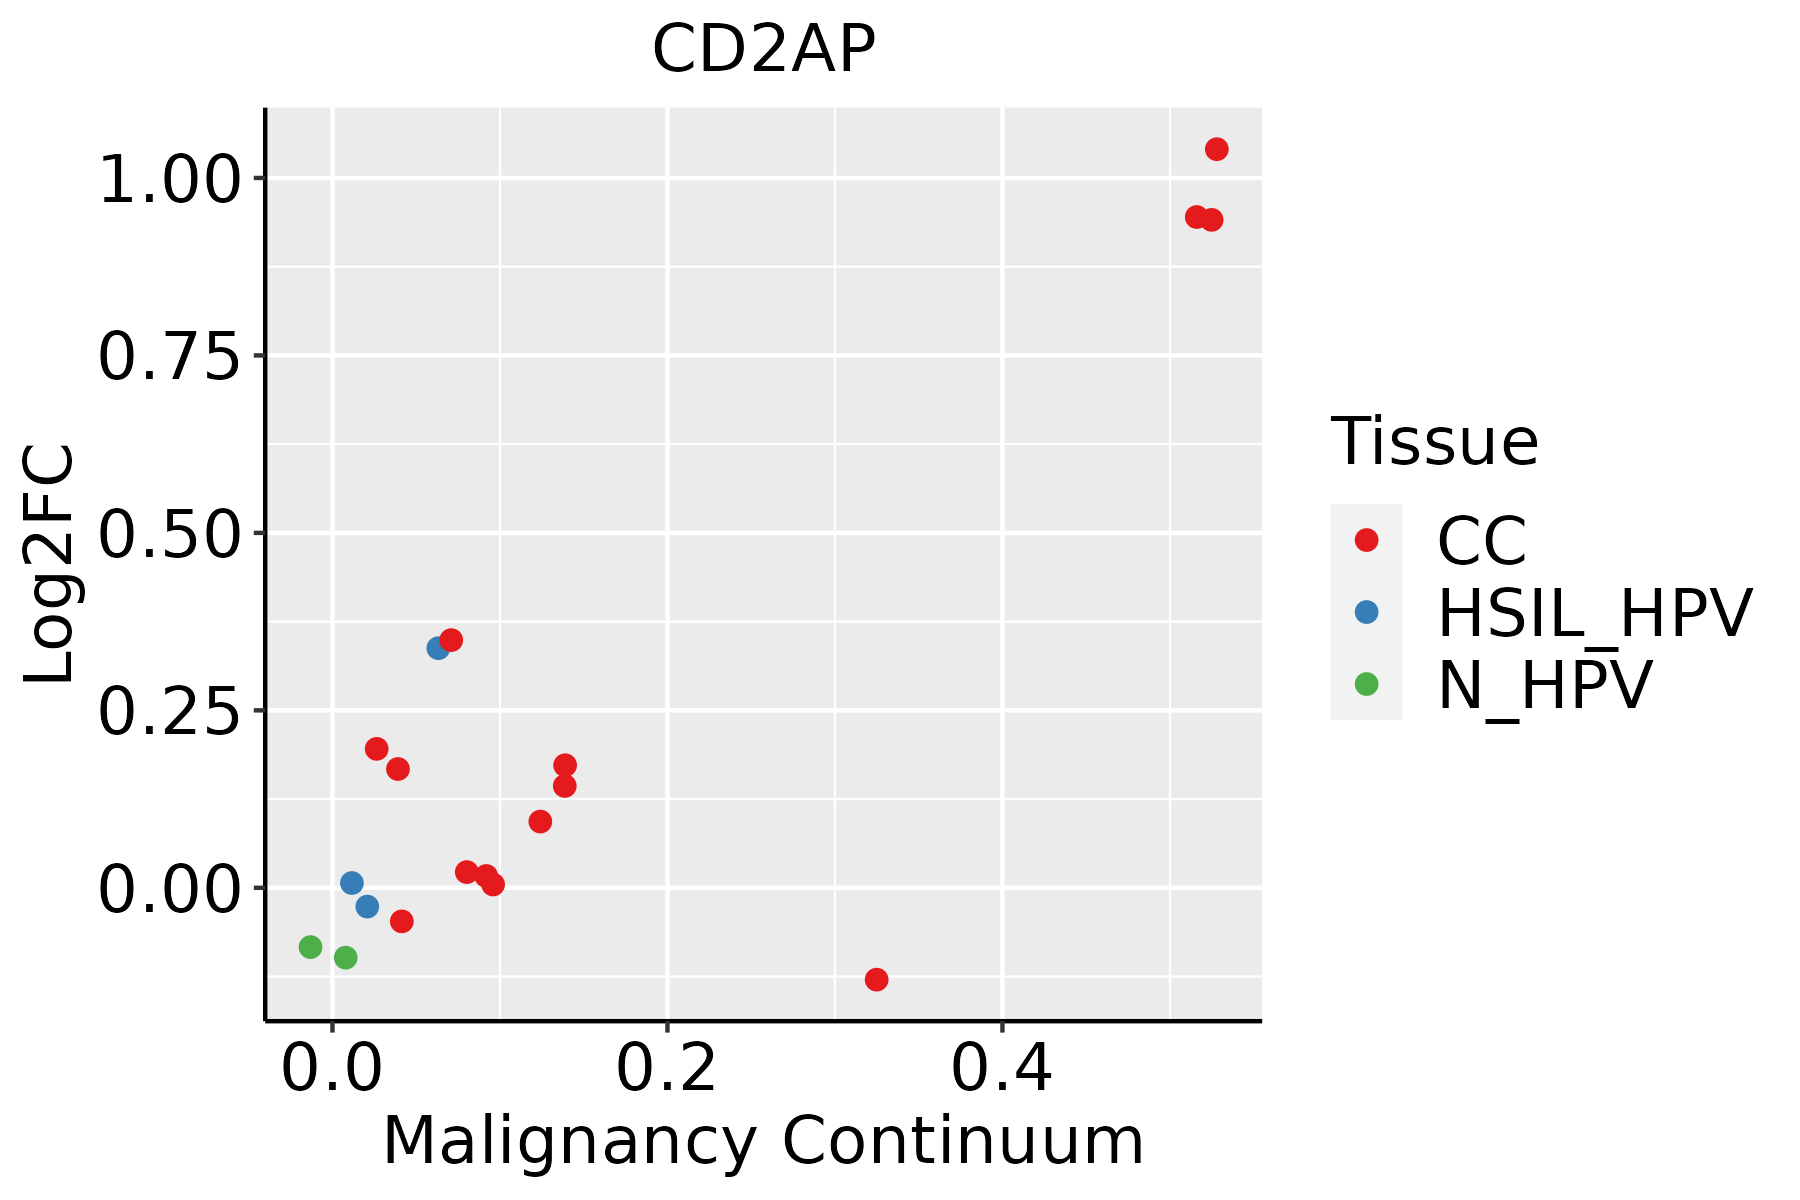 | CC: Cervix cancer |
| HSIL_HPV: HPV-infected high-grade squamous intraepithelial lesions | ||
| N_HPV: HPV-infected normal cervix | ||
| Colorectum (GSE201348) | 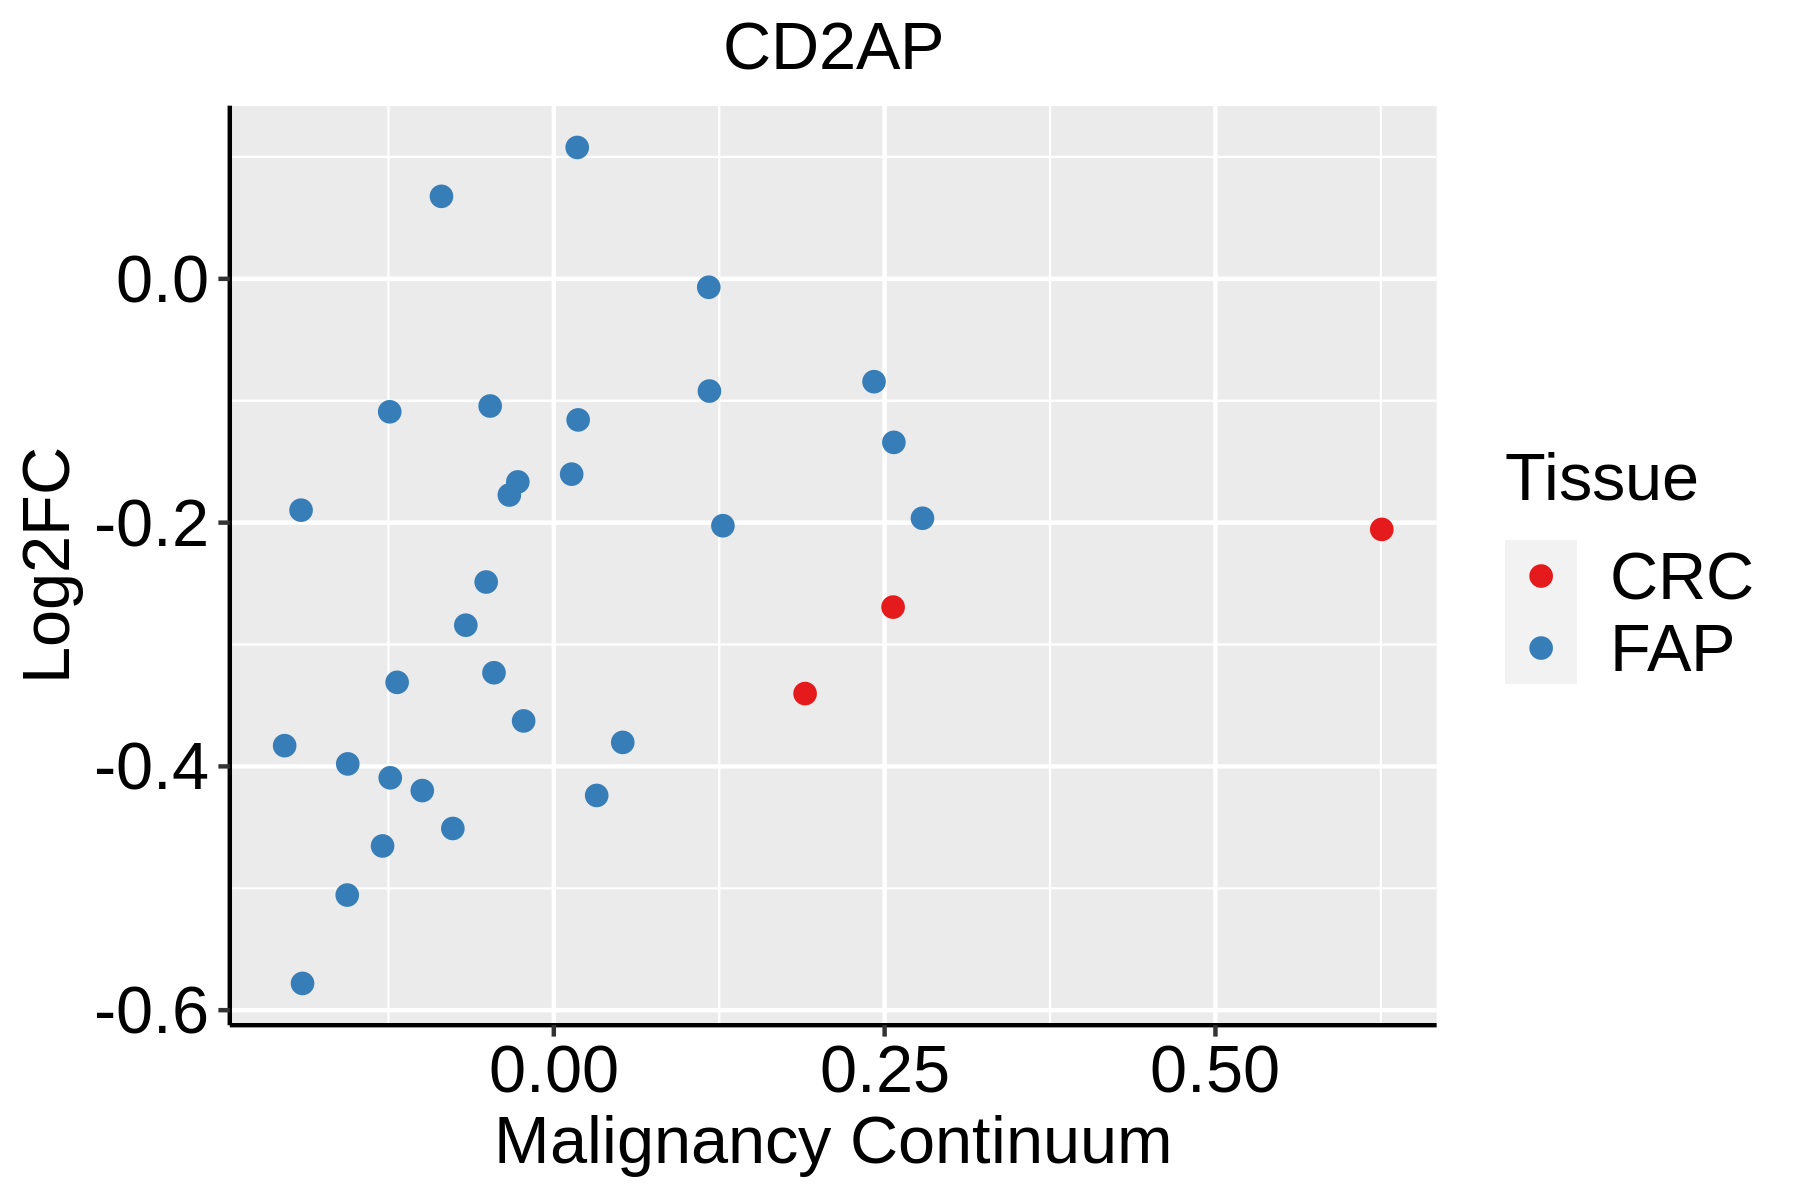 | FAP: Familial adenomatous polyposis |
| CRC: Colorectal cancer | ||
| Colorectum (HTA11) |  | AD: Adenomas |
| SER: Sessile serrated lesions | ||
| MSI-H: Microsatellite-high colorectal cancer | ||
| MSS: Microsatellite stable colorectal cancer | ||
| Endometrium | 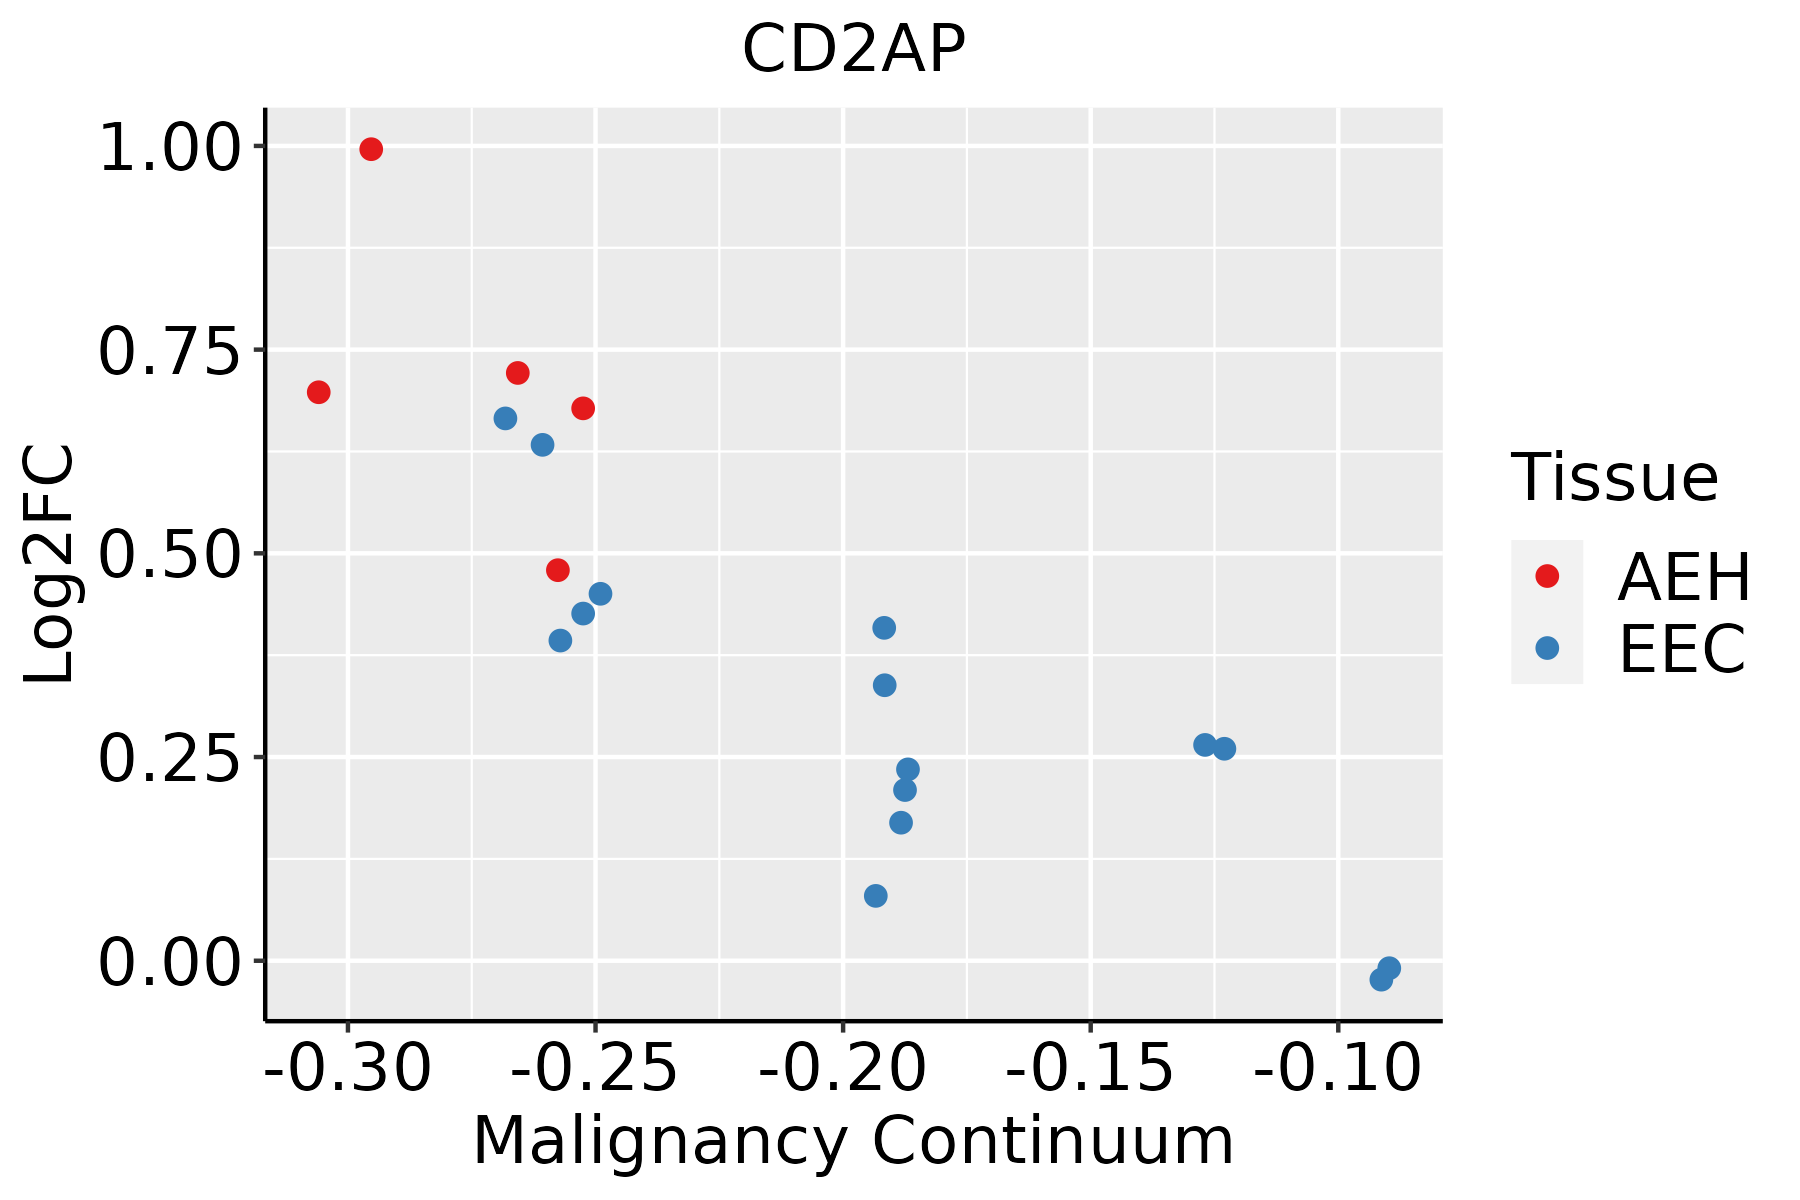 | AEH: Atypical endometrial hyperplasia |
| EEC: Endometrioid Cancer | ||
| Esophagus | 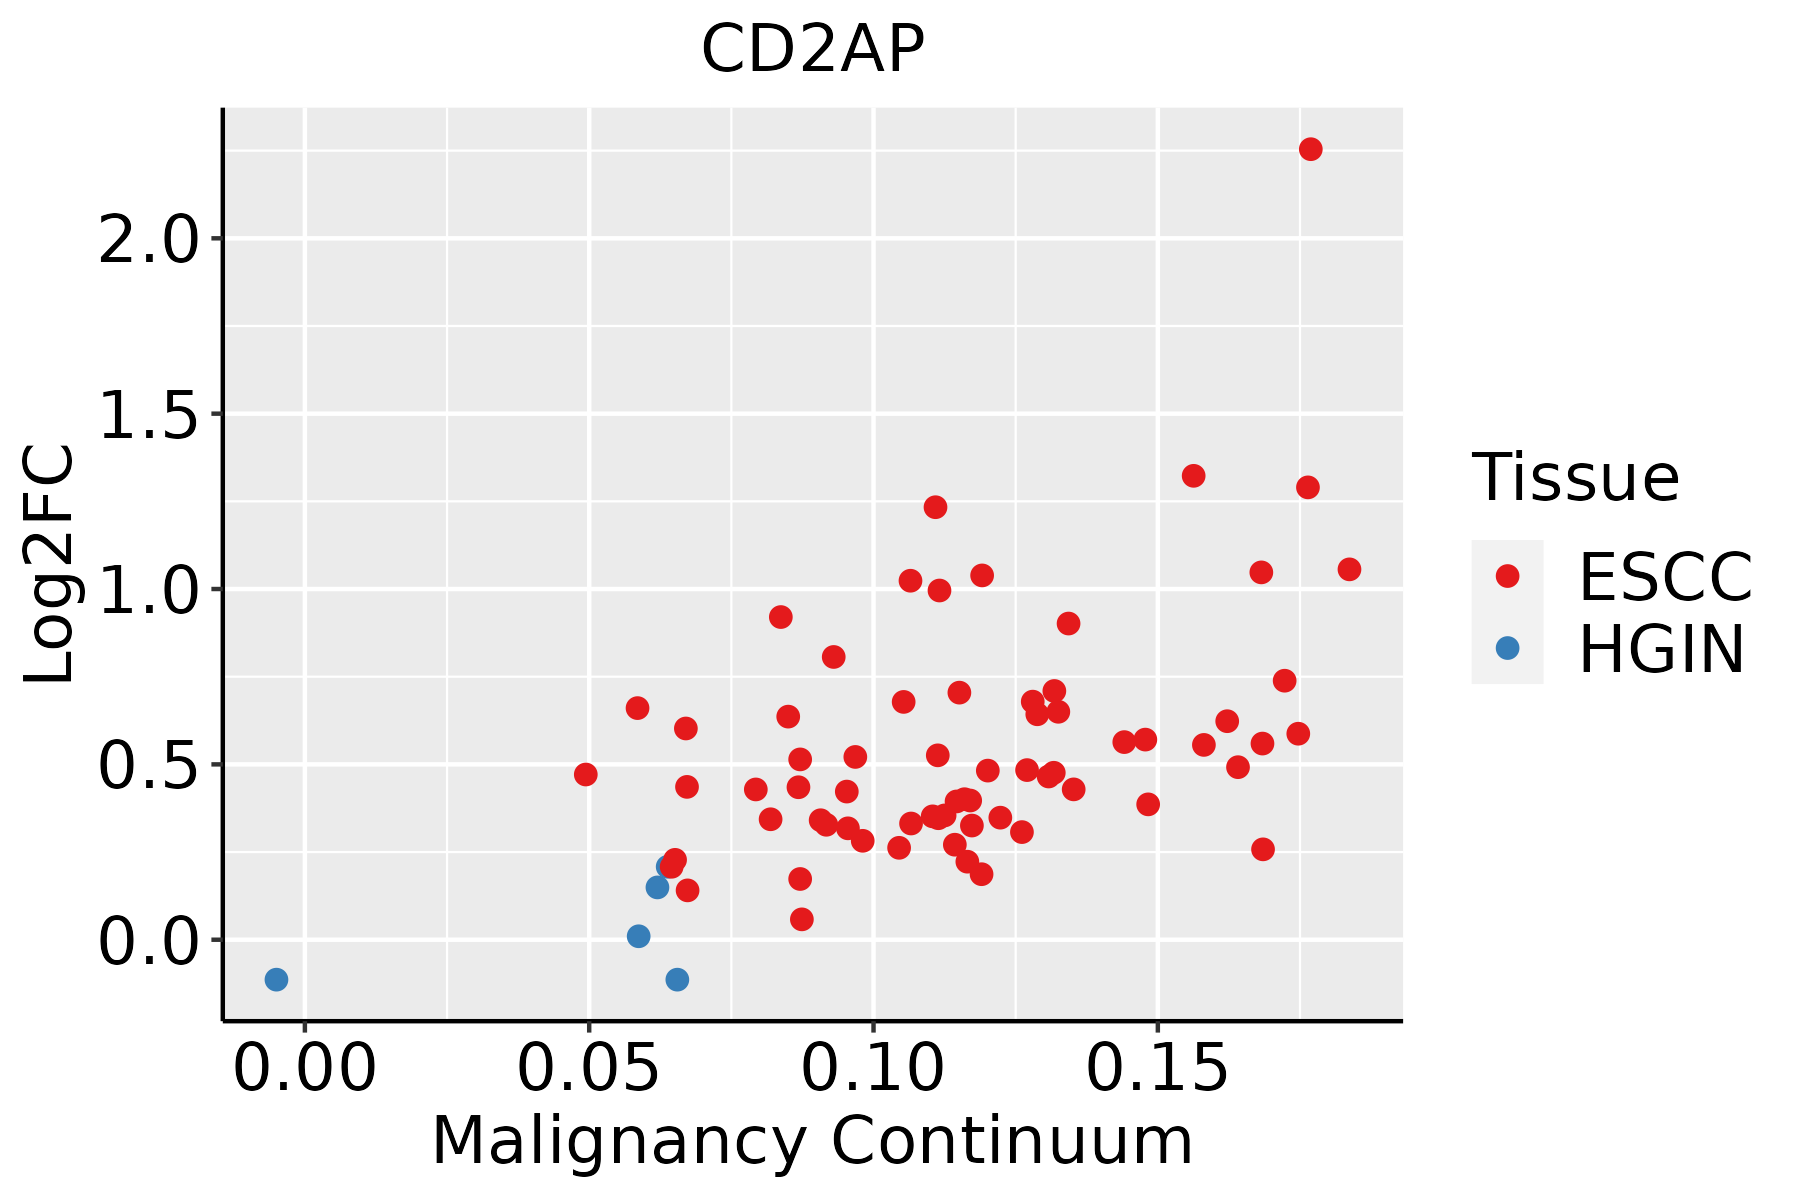 | ESCC: Esophageal squamous cell carcinoma |
| HGIN: High-grade intraepithelial neoplasias | ||
| LGIN: Low-grade intraepithelial neoplasias | ||
| GC | 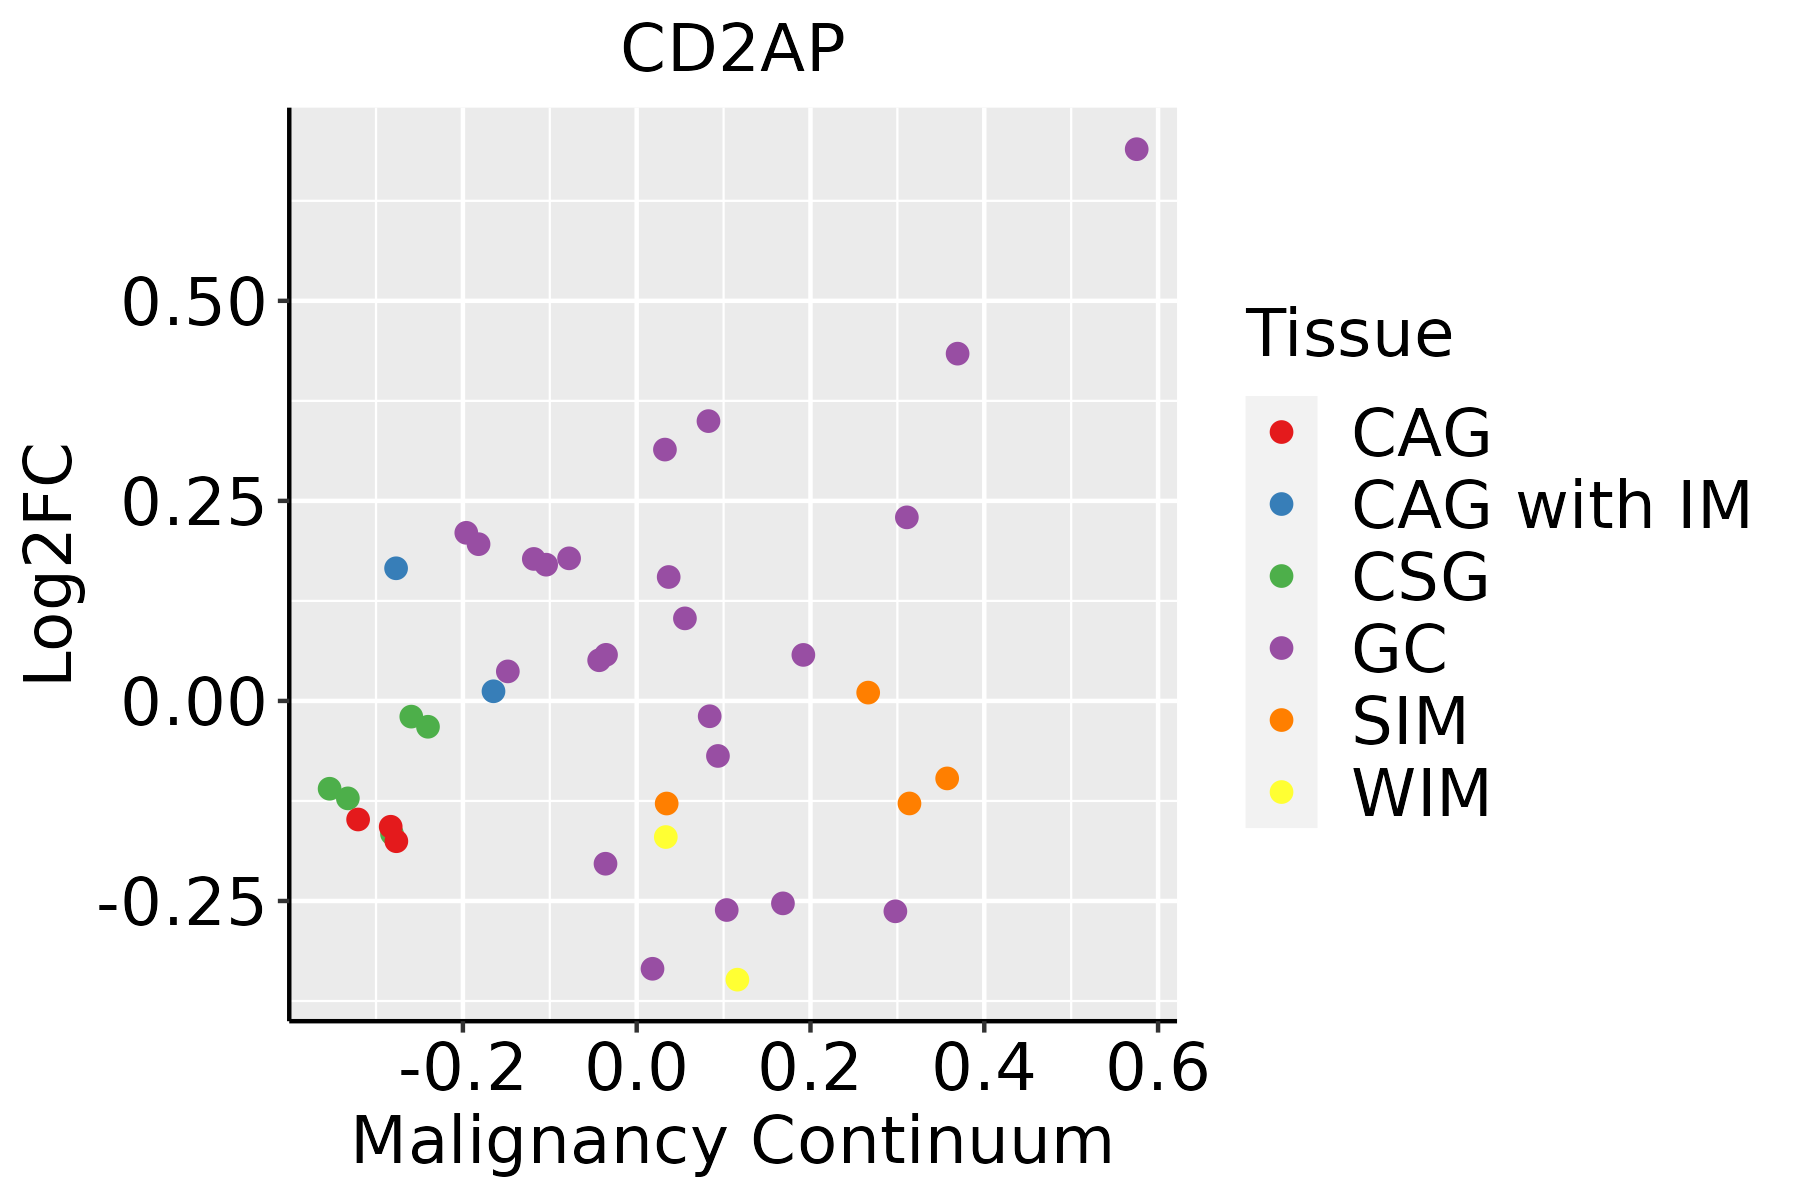 | CAG: Chronic atrophic gastritis |
| CAG with IM: Chronic atrophic gastritis with intestinal metaplasia | ||
| CSG: Chronic superficial gastritis | ||
| GC: Gastric cancer | ||
| SIM: Severe intestinal metaplasia | ||
| WIM: Wild intestinal metaplasia | ||
| Liver | 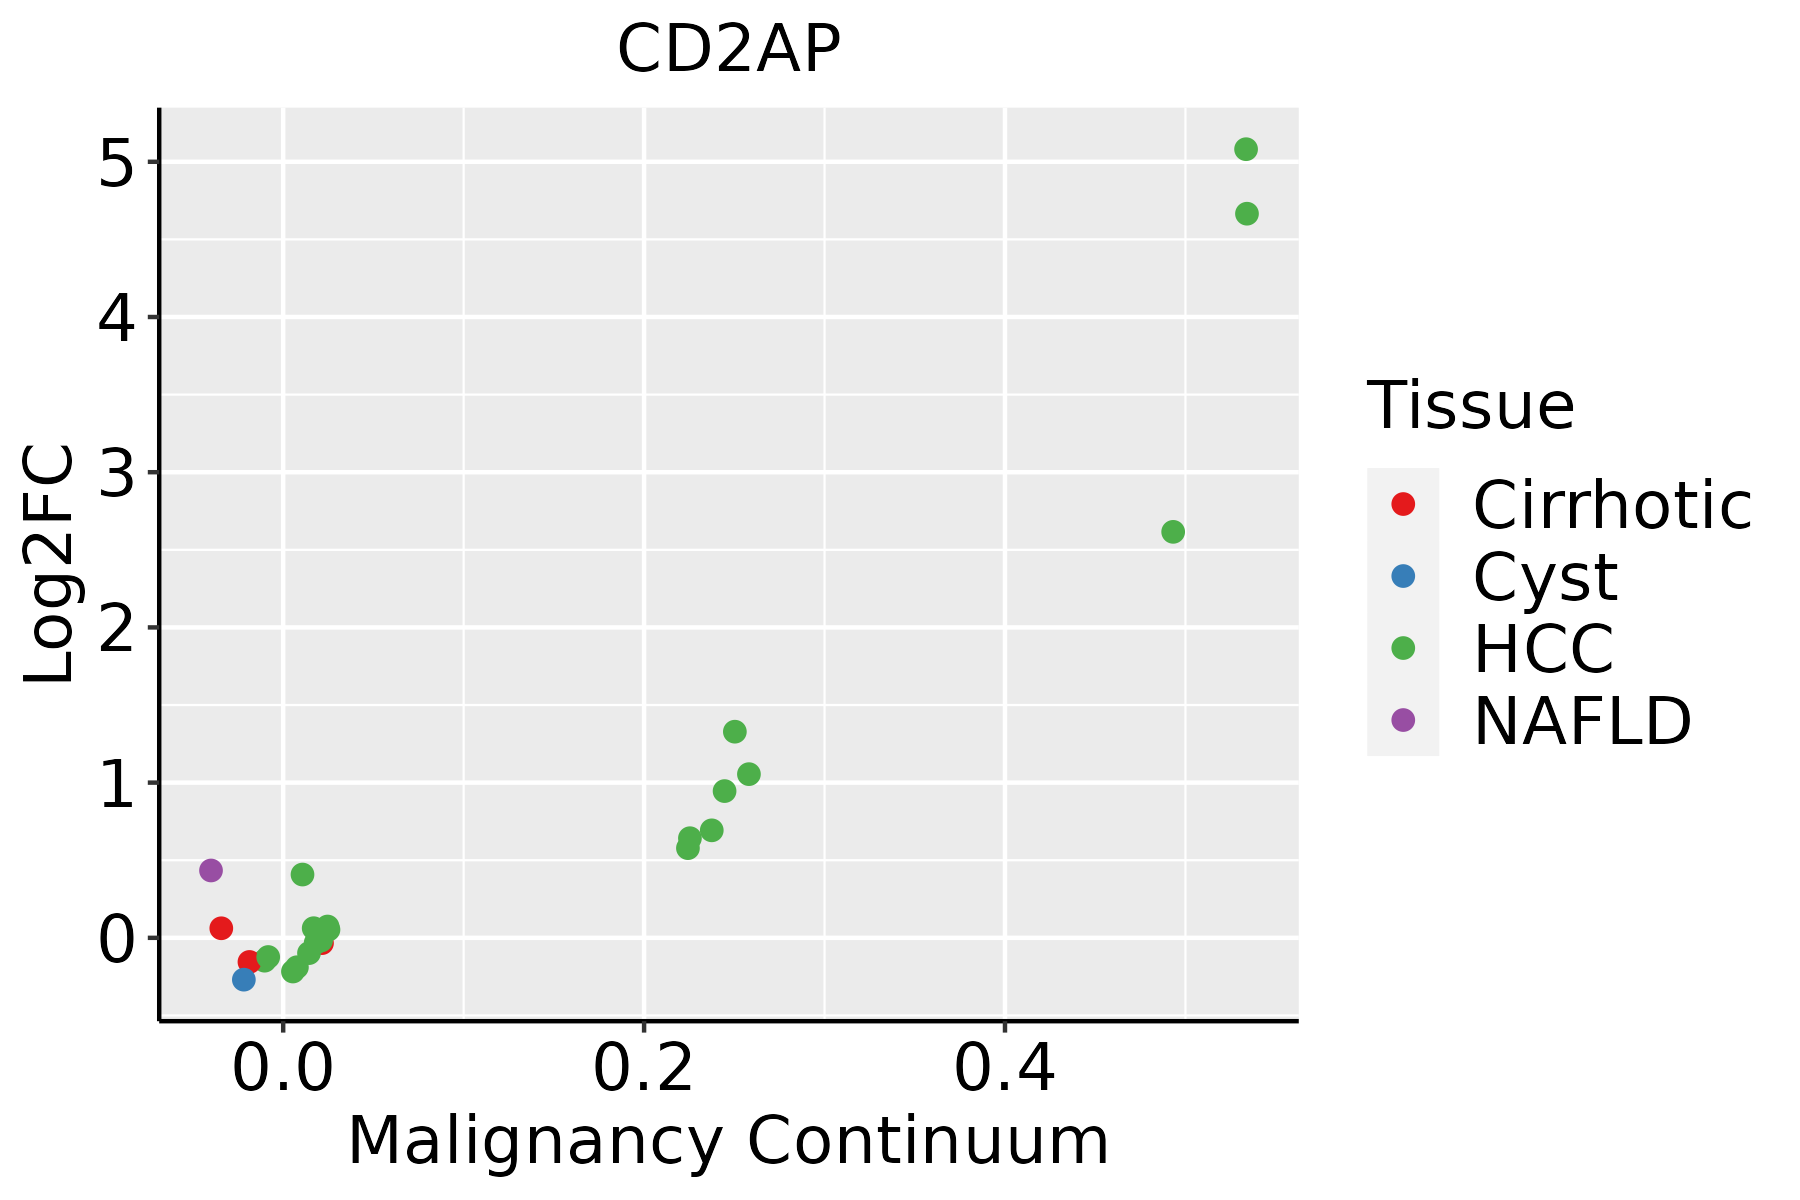 | HCC: Hepatocellular carcinoma |
| NAFLD: Non-alcoholic fatty liver disease | ||
| Lung | 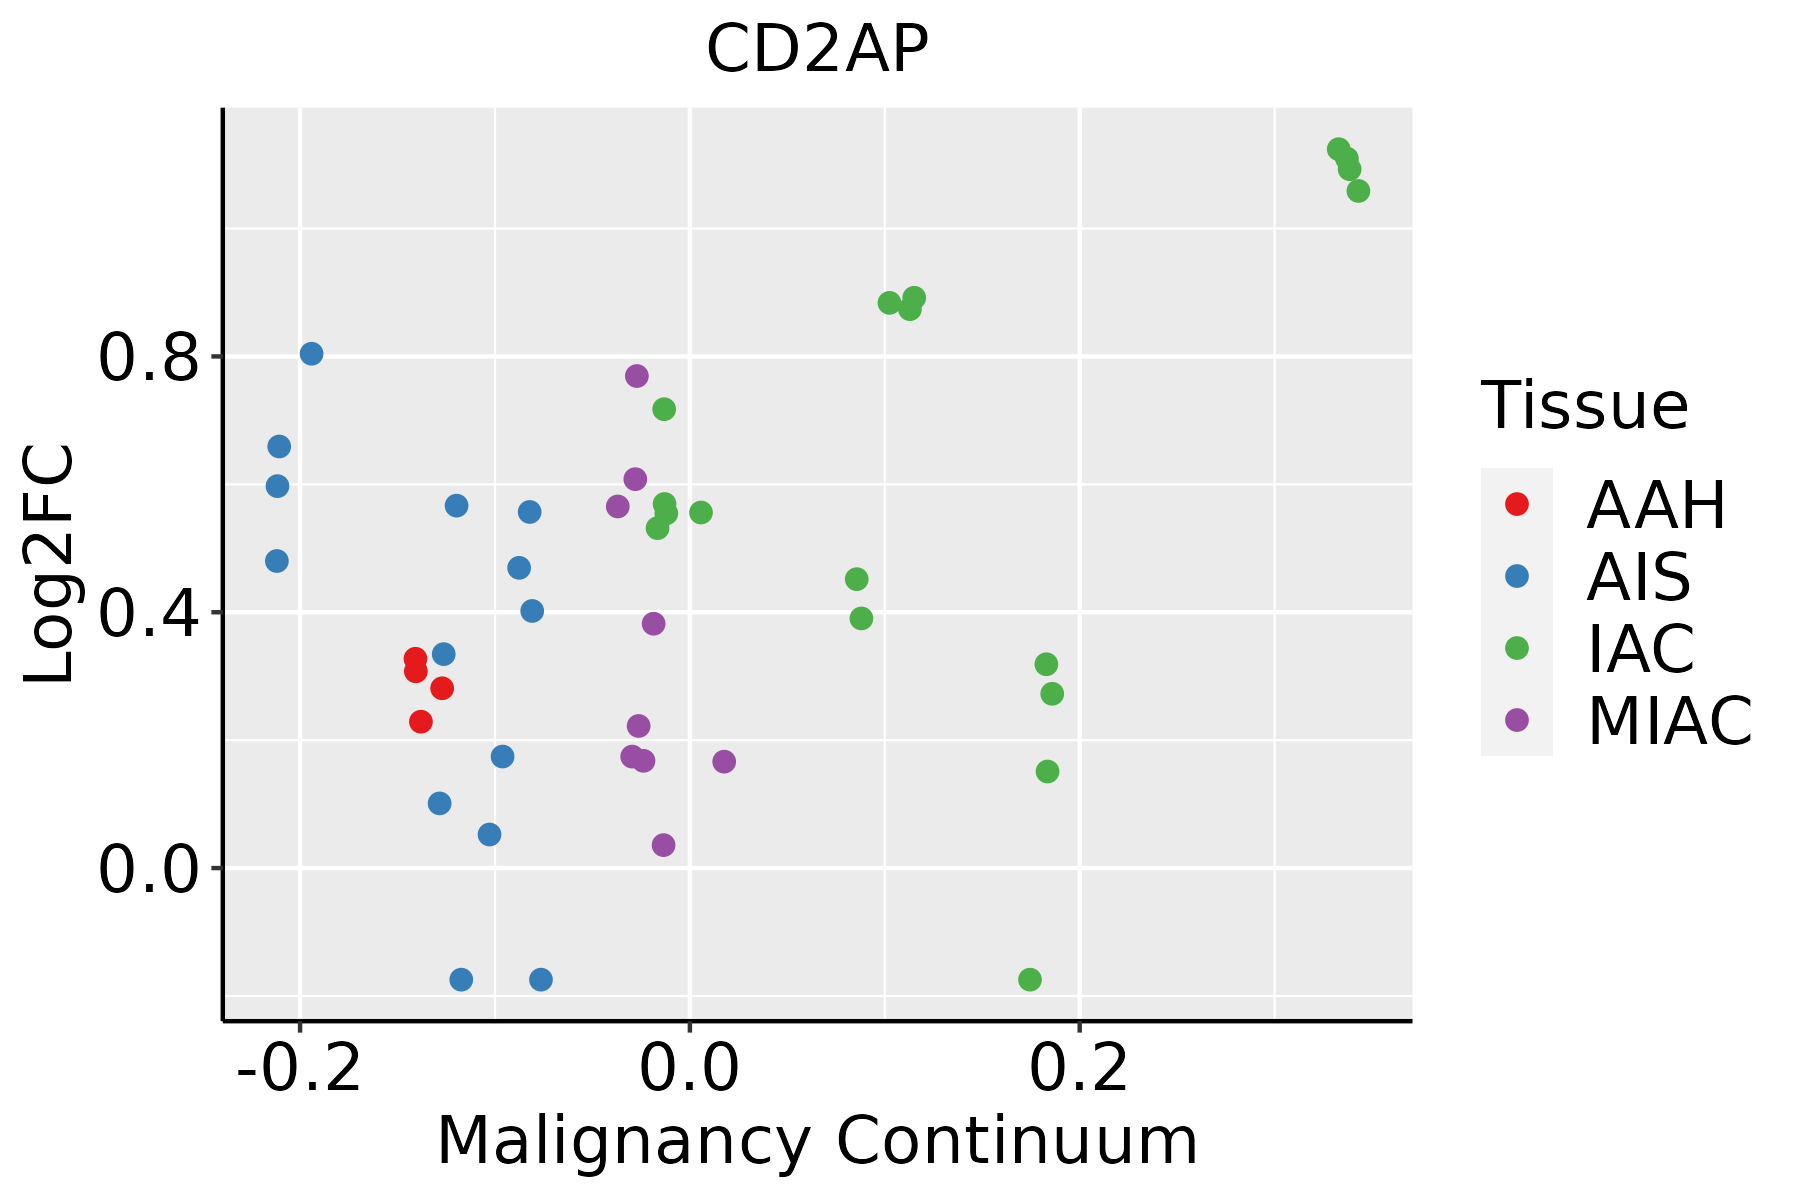 | AAH: Atypical adenomatous hyperplasia |
| AIS: Adenocarcinoma in situ | ||
| IAC: Invasive lung adenocarcinoma | ||
| MIA: Minimally invasive adenocarcinoma | ||
| Oral Cavity | 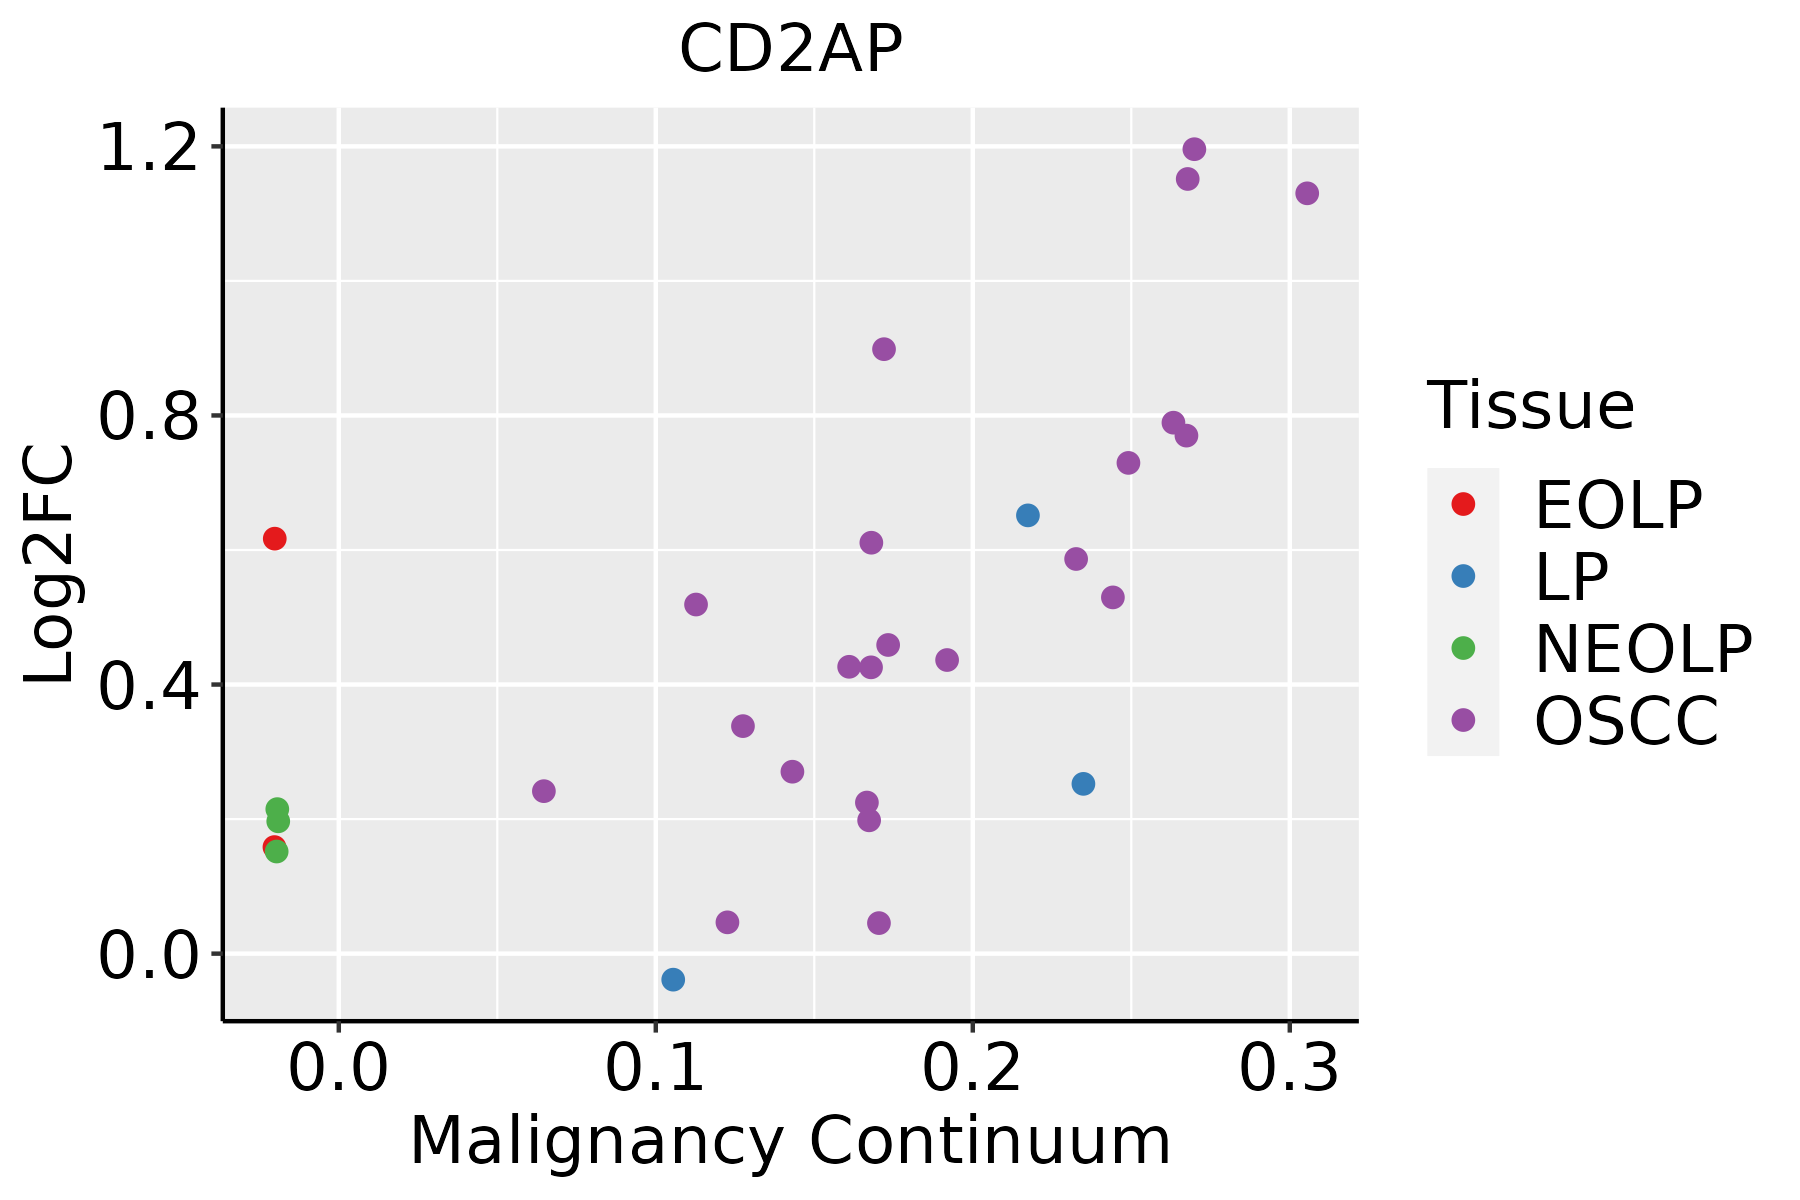 | EOLP: Erosive Oral lichen planus |
| LP: leukoplakia | ||
| NEOLP: Non-erosive oral lichen planus | ||
| OSCC: Oral squamous cell carcinoma | ||
| Prostate |  | BPH: Benign Prostatic Hyperplasia |
| Skin | 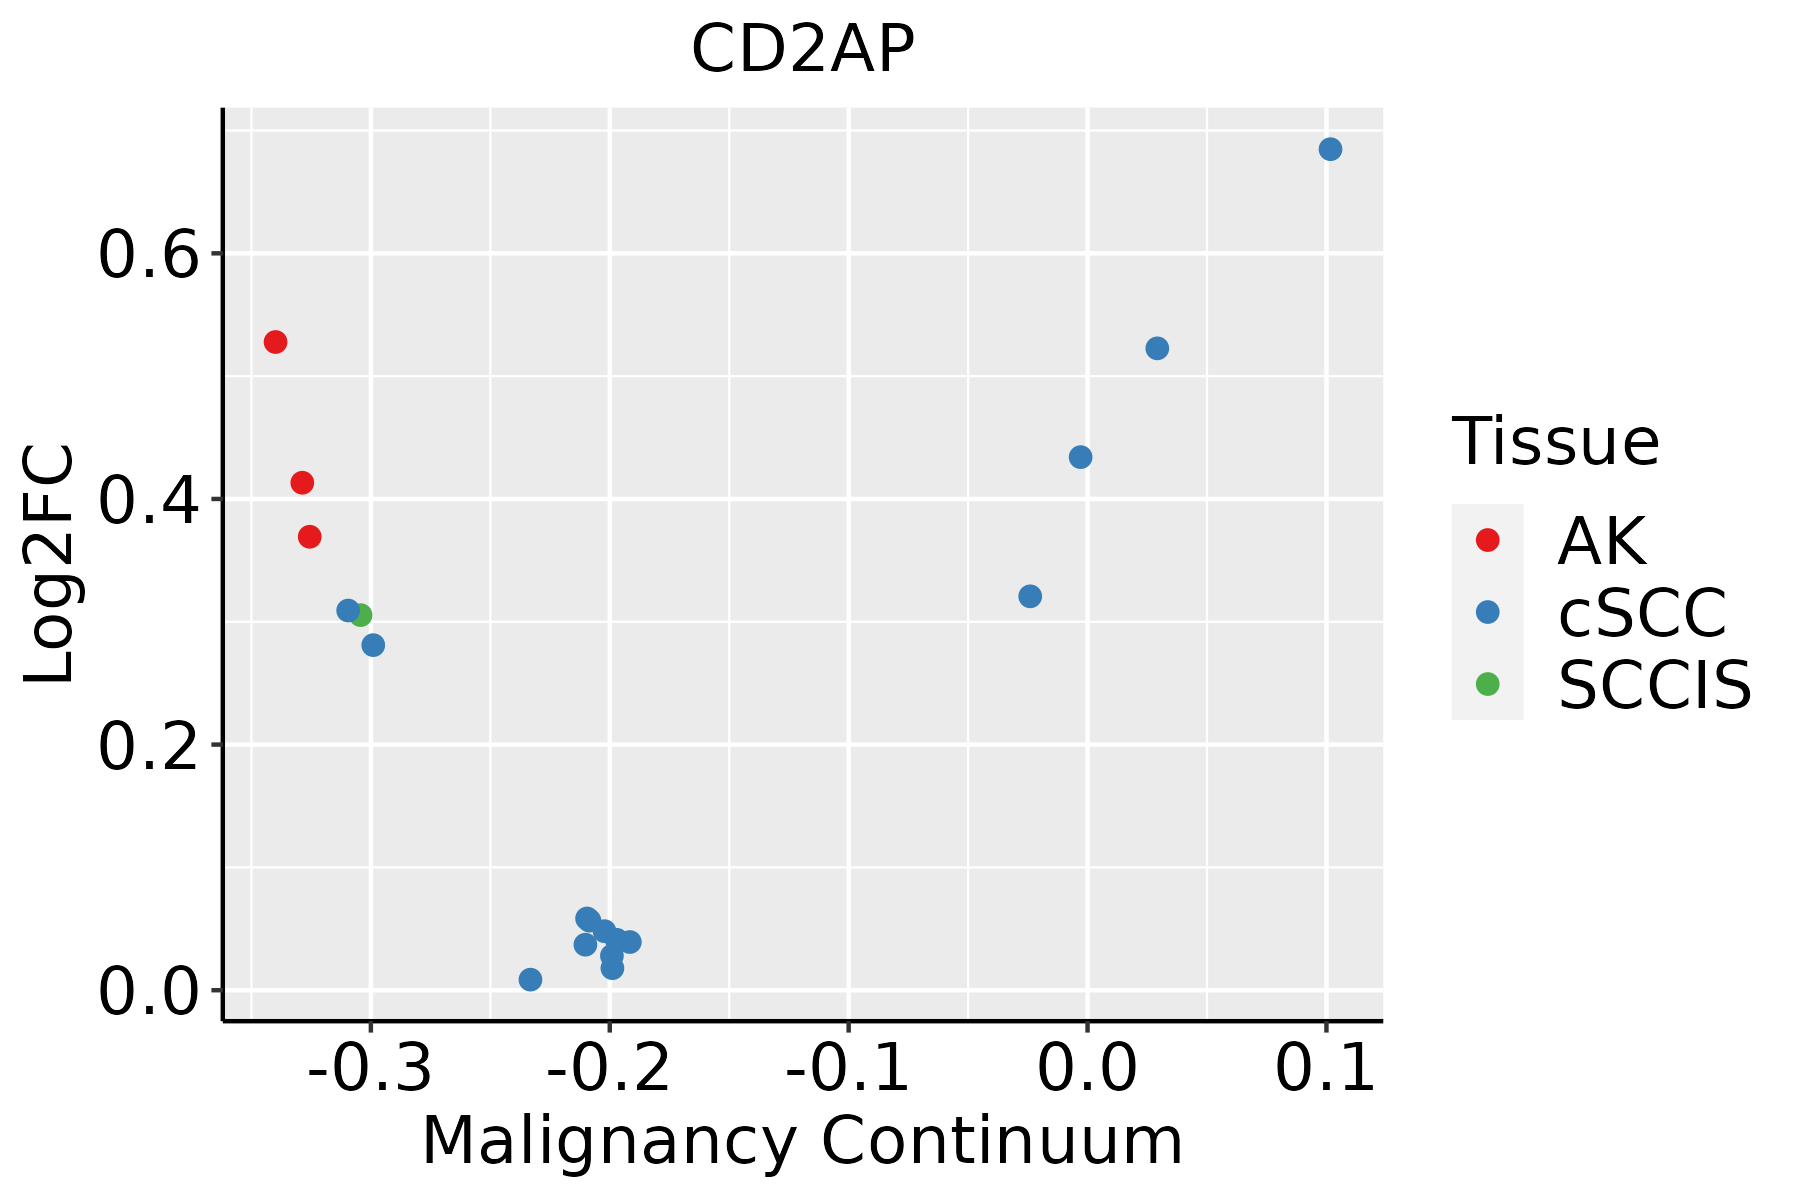 | AK: Actinic keratosis |
| cSCC: Cutaneous squamous cell carcinoma | ||
| SCCIS:squamous cell carcinoma in situ | ||
| Thyroid | 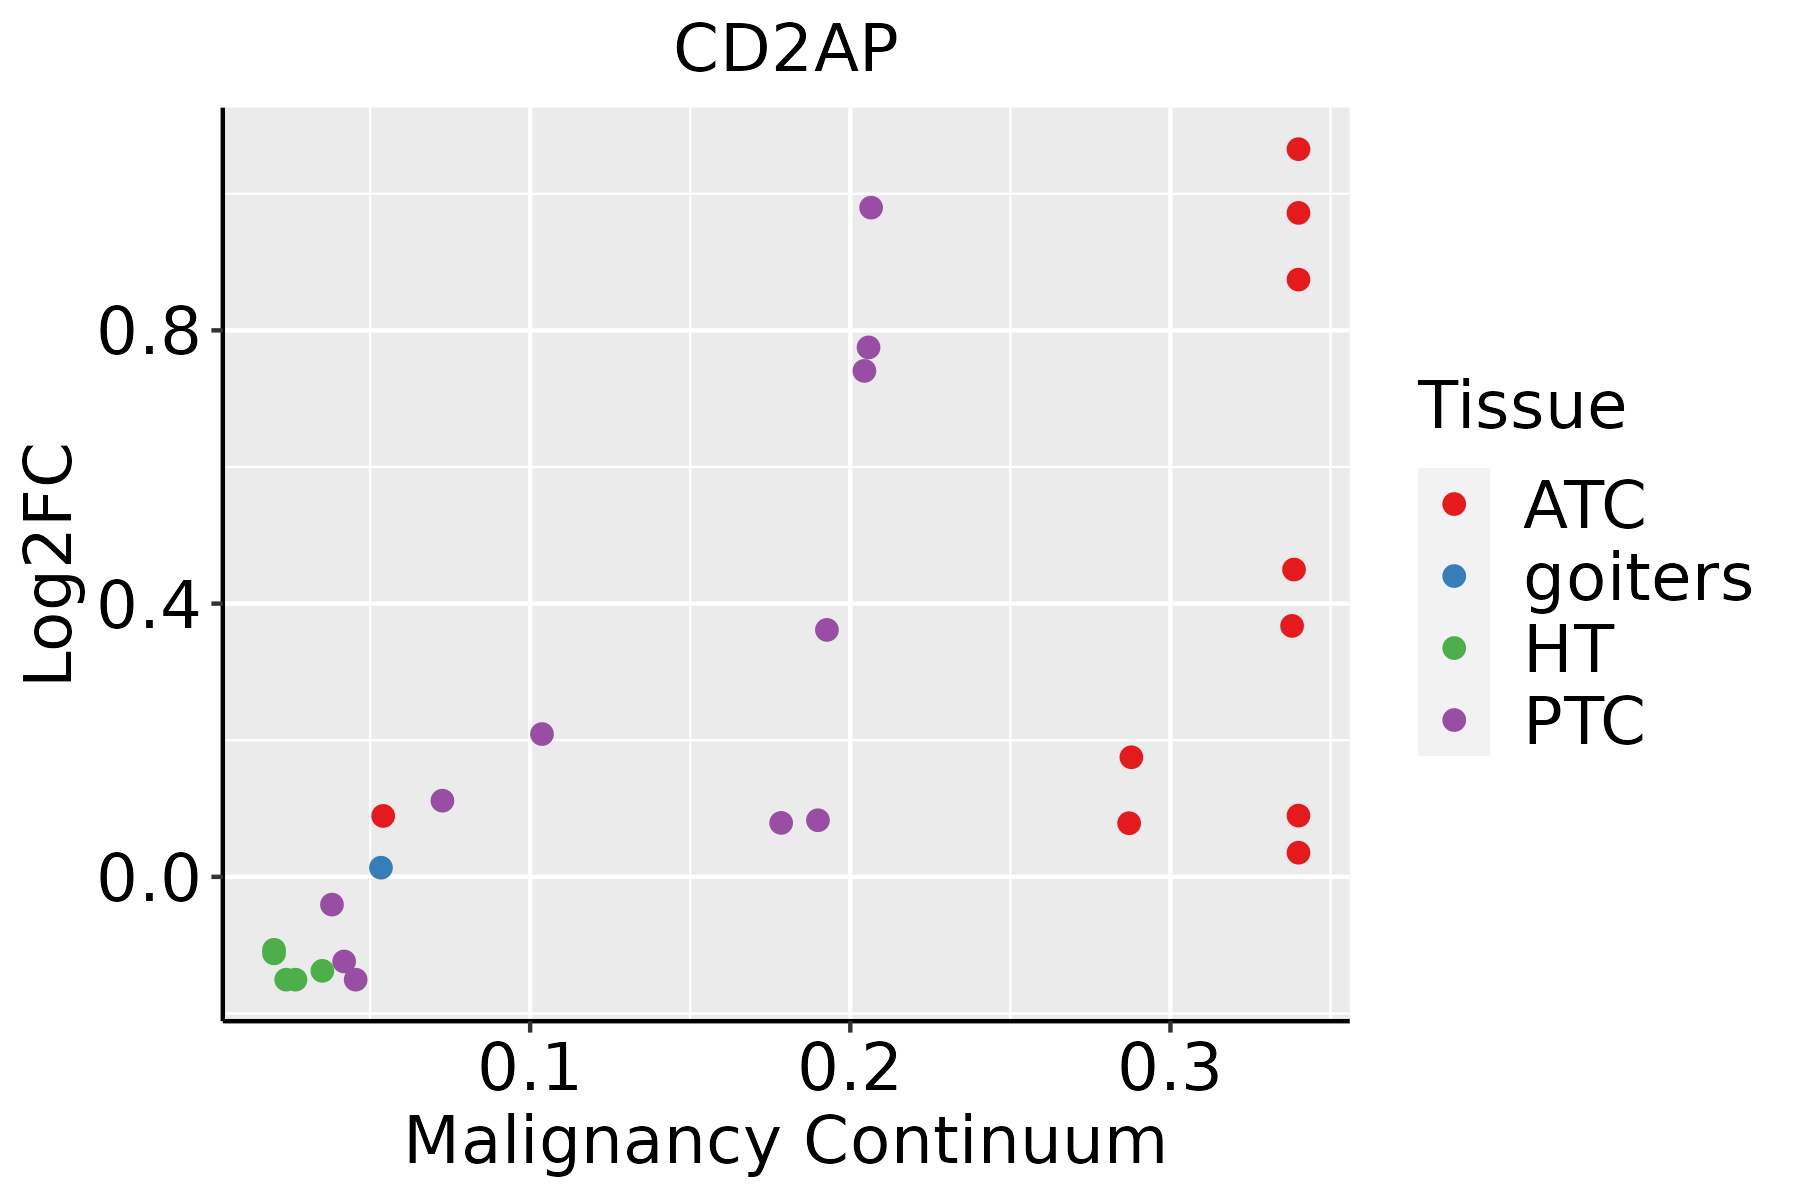 | ATC: Anaplastic thyroid cancer |
| HT: Hashimoto's thyroiditis | ||
| PTC: Papillary thyroid cancer |
| ∗log2FC in expression of this searched gene in stem-like cells from each diseased tissue sample relative to stem-like cells in normal samples in each tissue plotted against the malignancy continuum. Samples are colored based on if they are from different disease stage. |
Top |
Malignant transformation related pathway analysis |
| Find out the enriched GO biological processes and KEGG pathways involved in transition from healthy to precancer to cancer |
| Tissue | Disease Stage | Enriched GO biological Processes |
| Oral cavity | OSCC |  |
| Oral cavity | LP |  |
| Oral cavity | EOLP |  |
| Oral cavity | NEOLP |  |
| Esophagus | HGIN |  |
| ∗Top 15 enriched GO BP terms are showed in the bar plot of each disease state in each tissue. Each row represents a significant GO biological process which is colored according to the -log10(p.adjust). |
| Page: 1 2 3 4 5 6 7 8 9 |
| GO ID | Tissue | Disease Stage | Description | Gene Ratio | Bg Ratio | pvalue | p.adjust | Count |
| GO:000701510 | Cervix | CC | actin filament organization | 109/2311 | 442/18723 | 4.92e-13 | 2.45e-10 | 109 |
| GO:003297010 | Cervix | CC | regulation of actin filament-based process | 96/2311 | 397/18723 | 4.00e-11 | 8.54e-09 | 96 |
| GO:001049810 | Cervix | CC | proteasomal protein catabolic process | 111/2311 | 490/18723 | 8.98e-11 | 1.58e-08 | 111 |
| GO:190382910 | Cervix | CC | positive regulation of cellular protein localization | 72/2311 | 276/18723 | 3.20e-10 | 4.46e-08 | 72 |
| GO:003295610 | Cervix | CC | regulation of actin cytoskeleton organization | 86/2311 | 358/18723 | 5.90e-10 | 7.51e-08 | 86 |
| GO:00510566 | Cervix | CC | regulation of small GTPase mediated signal transduction | 75/2311 | 302/18723 | 1.54e-09 | 1.74e-07 | 75 |
| GO:004316110 | Cervix | CC | proteasome-mediated ubiquitin-dependent protein catabolic process | 91/2311 | 412/18723 | 1.65e-08 | 1.25e-06 | 91 |
| GO:005122210 | Cervix | CC | positive regulation of protein transport | 72/2311 | 303/18723 | 2.36e-08 | 1.70e-06 | 72 |
| GO:190495110 | Cervix | CC | positive regulation of establishment of protein localization | 73/2311 | 319/18723 | 9.69e-08 | 5.25e-06 | 73 |
| GO:00345048 | Cervix | CC | protein localization to nucleus | 68/2311 | 290/18723 | 9.91e-08 | 5.25e-06 | 68 |
| GO:00315328 | Cervix | CC | actin cytoskeleton reorganization | 31/2311 | 107/18723 | 3.34e-06 | 8.99e-05 | 31 |
| GO:00068987 | Cervix | CC | receptor-mediated endocytosis | 53/2311 | 244/18723 | 2.52e-05 | 4.29e-04 | 53 |
| GO:00301008 | Cervix | CC | regulation of endocytosis | 47/2311 | 211/18723 | 3.65e-05 | 5.82e-04 | 47 |
| GO:20002493 | Cervix | CC | regulation of actin cytoskeleton reorganization | 14/2311 | 39/18723 | 1.36e-04 | 1.66e-03 | 14 |
| GO:00716344 | Cervix | CC | regulation of transforming growth factor beta production | 14/2311 | 41/18723 | 2.49e-04 | 2.77e-03 | 14 |
| GO:00716043 | Cervix | CC | transforming growth factor beta production | 14/2311 | 43/18723 | 4.37e-04 | 4.38e-03 | 14 |
| GO:19001808 | Cervix | CC | regulation of protein localization to nucleus | 31/2311 | 136/18723 | 4.76e-04 | 4.69e-03 | 31 |
| GO:19001827 | Cervix | CC | positive regulation of protein localization to nucleus | 22/2311 | 87/18723 | 7.03e-04 | 6.40e-03 | 22 |
| GO:00069292 | Cervix | CC | substrate-dependent cell migration | 9/2311 | 23/18723 | 1.05e-03 | 8.76e-03 | 9 |
| GO:00507148 | Cervix | CC | positive regulation of protein secretion | 29/2311 | 137/18723 | 2.40e-03 | 1.70e-02 | 29 |
| Page: 1 2 3 4 5 6 7 8 9 10 11 12 13 14 15 16 17 18 19 20 21 22 23 24 25 26 27 28 29 |
| Pathway ID | Tissue | Disease Stage | Description | Gene Ratio | Bg Ratio | pvalue | p.adjust | qvalue | Count |
| hsa0510020 | Cervix | CC | Bacterial invasion of epithelial cells | 23/1267 | 77/8465 | 6.25e-04 | 2.93e-03 | 1.73e-03 | 23 |
| hsa05100110 | Cervix | CC | Bacterial invasion of epithelial cells | 23/1267 | 77/8465 | 6.25e-04 | 2.93e-03 | 1.73e-03 | 23 |
| hsa05100 | Colorectum | AD | Bacterial invasion of epithelial cells | 44/2092 | 77/8465 | 1.13e-09 | 2.22e-08 | 1.42e-08 | 44 |
| hsa051001 | Colorectum | AD | Bacterial invasion of epithelial cells | 44/2092 | 77/8465 | 1.13e-09 | 2.22e-08 | 1.42e-08 | 44 |
| hsa051002 | Colorectum | SER | Bacterial invasion of epithelial cells | 36/1580 | 77/8465 | 1.56e-08 | 3.45e-07 | 2.50e-07 | 36 |
| hsa051003 | Colorectum | SER | Bacterial invasion of epithelial cells | 36/1580 | 77/8465 | 1.56e-08 | 3.45e-07 | 2.50e-07 | 36 |
| hsa051004 | Colorectum | MSS | Bacterial invasion of epithelial cells | 36/1875 | 77/8465 | 1.41e-06 | 1.82e-05 | 1.11e-05 | 36 |
| hsa051005 | Colorectum | MSS | Bacterial invasion of epithelial cells | 36/1875 | 77/8465 | 1.41e-06 | 1.82e-05 | 1.11e-05 | 36 |
| hsa051008 | Colorectum | FAP | Bacterial invasion of epithelial cells | 33/1404 | 77/8465 | 4.33e-08 | 1.11e-06 | 6.77e-07 | 33 |
| hsa051009 | Colorectum | FAP | Bacterial invasion of epithelial cells | 33/1404 | 77/8465 | 4.33e-08 | 1.11e-06 | 6.77e-07 | 33 |
| hsa0510010 | Colorectum | CRC | Bacterial invasion of epithelial cells | 26/1091 | 77/8465 | 1.80e-06 | 6.69e-05 | 4.53e-05 | 26 |
| hsa0510011 | Colorectum | CRC | Bacterial invasion of epithelial cells | 26/1091 | 77/8465 | 1.80e-06 | 6.69e-05 | 4.53e-05 | 26 |
| hsa0510026 | Endometrium | AEH | Bacterial invasion of epithelial cells | 32/1197 | 77/8465 | 3.28e-09 | 5.91e-08 | 4.33e-08 | 32 |
| hsa05100111 | Endometrium | AEH | Bacterial invasion of epithelial cells | 32/1197 | 77/8465 | 3.28e-09 | 5.91e-08 | 4.33e-08 | 32 |
| hsa0510027 | Endometrium | EEC | Bacterial invasion of epithelial cells | 30/1237 | 77/8465 | 1.26e-07 | 1.88e-06 | 1.40e-06 | 30 |
| hsa0510036 | Endometrium | EEC | Bacterial invasion of epithelial cells | 30/1237 | 77/8465 | 1.26e-07 | 1.88e-06 | 1.40e-06 | 30 |
| hsa05100211 | Esophagus | ESCC | Bacterial invasion of epithelial cells | 59/4205 | 77/8465 | 1.05e-06 | 6.76e-06 | 3.46e-06 | 59 |
| hsa05100310 | Esophagus | ESCC | Bacterial invasion of epithelial cells | 59/4205 | 77/8465 | 1.05e-06 | 6.76e-06 | 3.46e-06 | 59 |
| hsa0510014 | Liver | Cirrhotic | Bacterial invasion of epithelial cells | 40/2530 | 77/8465 | 3.92e-05 | 2.84e-04 | 1.75e-04 | 40 |
| hsa0510015 | Liver | Cirrhotic | Bacterial invasion of epithelial cells | 40/2530 | 77/8465 | 3.92e-05 | 2.84e-04 | 1.75e-04 | 40 |
| Page: 1 2 |
Top |
Cell-cell communication analysis |
| Identification of potential cell-cell interactions between two cell types and their ligand-receptor pairs for different disease states |
| Ligand | Receptor | LRpair | Pathway | Tissue | Disease Stage |
| Page: 1 |
Top |
Single-cell gene regulatory network inference analysis |
| Find out the significant the regulons (TFs) and the target genes of each regulon across cell types for different disease states |
| TF | Cell Type | Tissue | Disease Stage | Target Gene | RSS | Regulon Activity |
| ∗The dot plots of a searched regulon are shown for all cell subpopulations in each disease state of each tissue based on the regulon specific score inferred using pySCENIC and by calculating the average expression. |
| Page: 1 |
Top |
Somatic mutation of malignant transformation related genes |
| Annotation of somatic variants for genes involved in malignant transformation |
| Hugo Symbol | Variant Class | Variant Classification | dbSNP RS | HGVSc | HGVSp | HGVSp Short | SWISSPROT | BIOTYPE | SIFT | PolyPhen | Tumor Sample Barcode | Tissue | Histology | Sex | Age | Stage | Therapy Types | Drugs | Outcome |
| CD2AP | SNV | Missense_Mutation | novel | c.1448C>T | p.Ser483Leu | p.S483L | Q9Y5K6 | protein_coding | deleterious(0) | probably_damaging(0.948) | TCGA-AC-A2FO-01 | Breast | breast invasive carcinoma | Female | >=65 | I/II | Chemotherapy | chemo | CR |
| CD2AP | SNV | Missense_Mutation | rs147188917 | c.934G>A | p.Glu312Lys | p.E312K | Q9Y5K6 | protein_coding | deleterious(0) | probably_damaging(0.982) | TCGA-AN-A046-01 | Breast | breast invasive carcinoma | Female | >=65 | I/II | Unknown | Unknown | SD |
| CD2AP | SNV | Missense_Mutation | c.671N>G | p.Ser224Cys | p.S224C | Q9Y5K6 | protein_coding | deleterious(0.02) | probably_damaging(0.99) | TCGA-C8-A1HM-01 | Breast | breast invasive carcinoma | Female | >=65 | I/II | Chemotherapy | doxorubicin | CR | |
| CD2AP | insertion | Frame_Shift_Ins | novel | c.720dupA | p.Pro241ThrfsTer27 | p.P241Tfs*27 | Q9Y5K6 | protein_coding | TCGA-A2-A4RY-01 | Breast | breast invasive carcinoma | Female | <65 | III/IV | Chemotherapy | taxotere | CR | ||
| CD2AP | SNV | Missense_Mutation | novel | c.1704A>C | p.Glu568Asp | p.E568D | Q9Y5K6 | protein_coding | tolerated(0.42) | benign(0.012) | TCGA-2W-A8YY-01 | Cervix | cervical & endocervical cancer | Female | <65 | I/II | Chemotherapy | cisplatin | CR |
| CD2AP | SNV | Missense_Mutation | c.1810C>G | p.His604Asp | p.H604D | Q9Y5K6 | protein_coding | deleterious(0.04) | possibly_damaging(0.786) | TCGA-IR-A3LA-01 | Cervix | cervical & endocervical cancer | Female | <65 | I/II | Chemotherapy | cisplatin | CR | |
| CD2AP | SNV | Missense_Mutation | rs757930895 | c.1639N>C | p.Val547Leu | p.V547L | Q9Y5K6 | protein_coding | tolerated(0.71) | benign(0) | TCGA-A6-A565-01 | Colorectum | colon adenocarcinoma | Female | <65 | III/IV | Unspecific | 5FU | PD |
| CD2AP | SNV | Missense_Mutation | c.1153N>G | p.Pro385Ala | p.P385A | Q9Y5K6 | protein_coding | deleterious(0.03) | probably_damaging(0.999) | TCGA-AA-3860-01 | Colorectum | colon adenocarcinoma | Female | <65 | III/IV | Chemotherapy | folinic | CR | |
| CD2AP | SNV | Missense_Mutation | rs371293071 | c.251N>A | p.Arg84Gln | p.R84Q | Q9Y5K6 | protein_coding | deleterious(0) | probably_damaging(0.974) | TCGA-AA-A010-01 | Colorectum | colon adenocarcinoma | Female | <65 | I/II | Chemotherapy | folinic | CR |
| CD2AP | SNV | Missense_Mutation | c.420N>T | p.Glu140Asp | p.E140D | Q9Y5K6 | protein_coding | deleterious(0) | probably_damaging(0.913) | TCGA-AA-A010-01 | Colorectum | colon adenocarcinoma | Female | <65 | I/II | Chemotherapy | folinic | CR |
| Page: 1 2 3 4 5 6 |
Top |
Related drugs of malignant transformation related genes |
| Identification of chemicals and drugs interact with genes involved in malignant transfromation |
| (DGIdb 4.0) |
| Entrez ID | Symbol | Category | Interaction Types | Drug Claim Name | Drug Name | PMIDs |
| Page: 1 |

Copyright 2023-Present -The University of Texas Health Science Center at Houston |