
|
|||||
|
 | |
| |
| |
| |
| |
| |
|
Gene: ANKRD9 |
Gene summary for ANKRD9 |
| Gene information | Species | Human | Gene symbol | ANKRD9 | Gene ID | 122416 |
| Gene name | ankyrin repeat domain 9 | |
| Gene Alias | ANKRD9 | |
| Cytomap | 14q32.31 | |
| Gene Type | protein-coding | GO ID | GO:0006464 | UniProtAcc | Q96BM1 |
Top |
Malignant transformation analysis |
| Identification of the aberrant gene expression in precancerous and cancerous lesions by comparing the gene expression of stem-like cells in diseased tissues with normal stem cells |
| Entrez ID | Symbol | Replicates | Species | Organ | Tissue | Adj P-value | Log2FC | Malignancy |
| 122416 | ANKRD9 | HTA11_3410_2000001011 | Human | Colorectum | AD | 1.38e-04 | 1.46e-01 | 0.0155 |
| 122416 | ANKRD9 | HTA11_2487_2000001011 | Human | Colorectum | SER | 9.77e-10 | 5.46e-01 | -0.1808 |
| 122416 | ANKRD9 | HTA11_78_2000001011 | Human | Colorectum | AD | 1.89e-07 | 4.76e-01 | -0.1088 |
| 122416 | ANKRD9 | HTA11_347_2000001011 | Human | Colorectum | AD | 2.42e-22 | 5.66e-01 | -0.1954 |
| 122416 | ANKRD9 | HTA11_2112_2000001011 | Human | Colorectum | SER | 1.73e-03 | 4.71e-01 | -0.2196 |
| 122416 | ANKRD9 | HTA11_3361_2000001011 | Human | Colorectum | AD | 9.41e-12 | 5.65e-01 | -0.1207 |
| 122416 | ANKRD9 | HTA11_83_2000001011 | Human | Colorectum | SER | 4.15e-04 | 2.93e-01 | -0.1526 |
| 122416 | ANKRD9 | HTA11_696_2000001011 | Human | Colorectum | AD | 7.27e-10 | 4.42e-01 | -0.1464 |
| 122416 | ANKRD9 | HTA11_1391_2000001011 | Human | Colorectum | AD | 1.56e-11 | 4.87e-01 | -0.059 |
| 122416 | ANKRD9 | HTA11_2992_2000001011 | Human | Colorectum | SER | 1.25e-05 | 7.49e-01 | -0.1706 |
| 122416 | ANKRD9 | HTA11_5212_2000001011 | Human | Colorectum | AD | 2.98e-03 | 4.53e-01 | -0.2061 |
| 122416 | ANKRD9 | HTA11_546_2000001011 | Human | Colorectum | AD | 2.52e-02 | 2.60e-01 | -0.0842 |
| 122416 | ANKRD9 | HTA11_866_3004761011 | Human | Colorectum | AD | 2.03e-03 | 1.57e-01 | 0.096 |
| 122416 | ANKRD9 | HTA11_10711_2000001011 | Human | Colorectum | AD | 9.31e-03 | 3.14e-01 | 0.0338 |
| 122416 | ANKRD9 | HTA11_7696_3000711011 | Human | Colorectum | AD | 1.05e-02 | 3.24e-01 | 0.0674 |
| 122416 | ANKRD9 | LZE20T | Human | Esophagus | ESCC | 2.82e-06 | 3.19e-01 | 0.0662 |
| 122416 | ANKRD9 | LZE24T | Human | Esophagus | ESCC | 6.23e-08 | 1.31e-01 | 0.0596 |
| 122416 | ANKRD9 | LZE21T | Human | Esophagus | ESCC | 5.61e-03 | 1.74e-01 | 0.0655 |
| 122416 | ANKRD9 | P1T-E | Human | Esophagus | ESCC | 1.10e-08 | 5.23e-01 | 0.0875 |
| 122416 | ANKRD9 | P2T-E | Human | Esophagus | ESCC | 1.13e-05 | 5.55e-02 | 0.1177 |
| Page: 1 2 3 4 5 6 |
| Tissue | Expression Dynamics | Abbreviation |
| Colorectum (GSE201348) |  | FAP: Familial adenomatous polyposis |
| CRC: Colorectal cancer | ||
| Colorectum (HTA11) |  | AD: Adenomas |
| SER: Sessile serrated lesions | ||
| MSI-H: Microsatellite-high colorectal cancer | ||
| MSS: Microsatellite stable colorectal cancer | ||
| Esophagus |  | ESCC: Esophageal squamous cell carcinoma |
| HGIN: High-grade intraepithelial neoplasias | ||
| LGIN: Low-grade intraepithelial neoplasias | ||
| Liver | 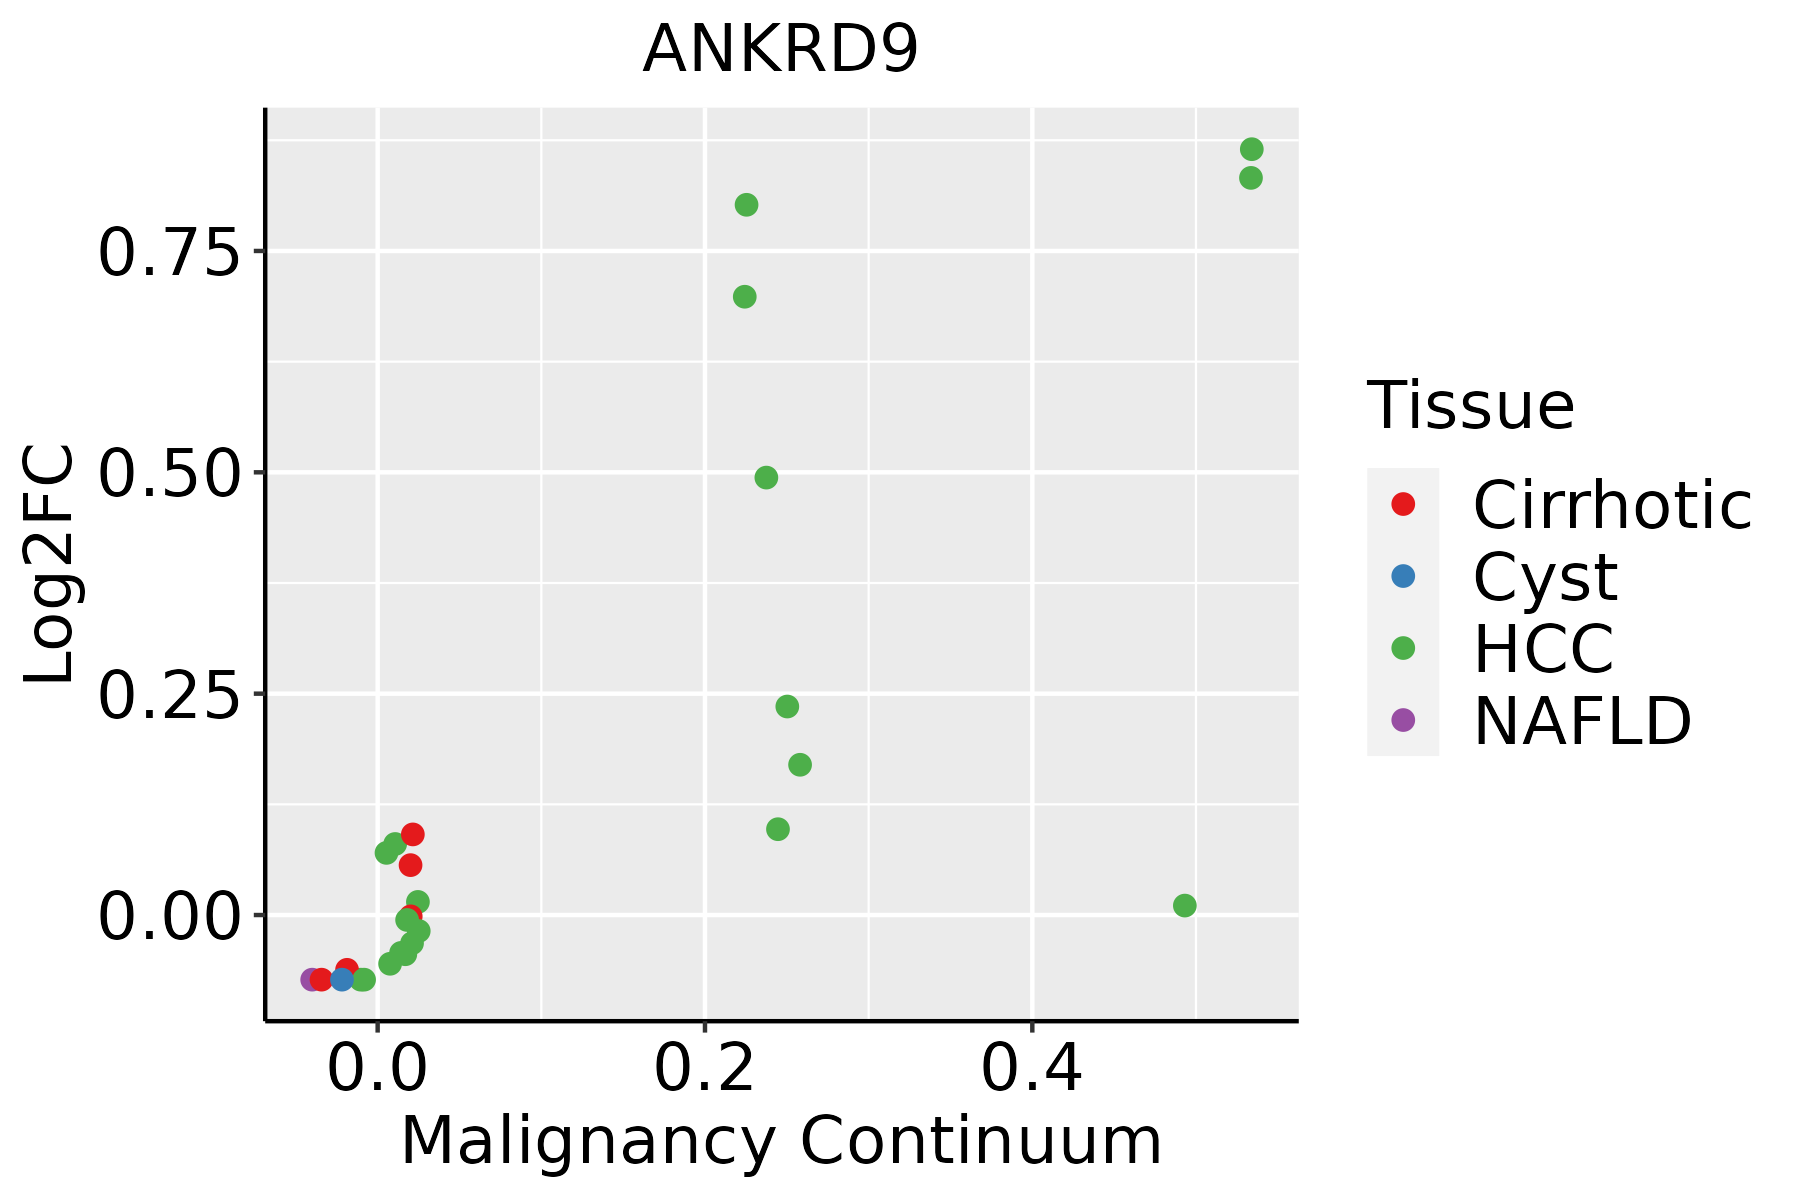 | HCC: Hepatocellular carcinoma |
| NAFLD: Non-alcoholic fatty liver disease | ||
| Oral Cavity | 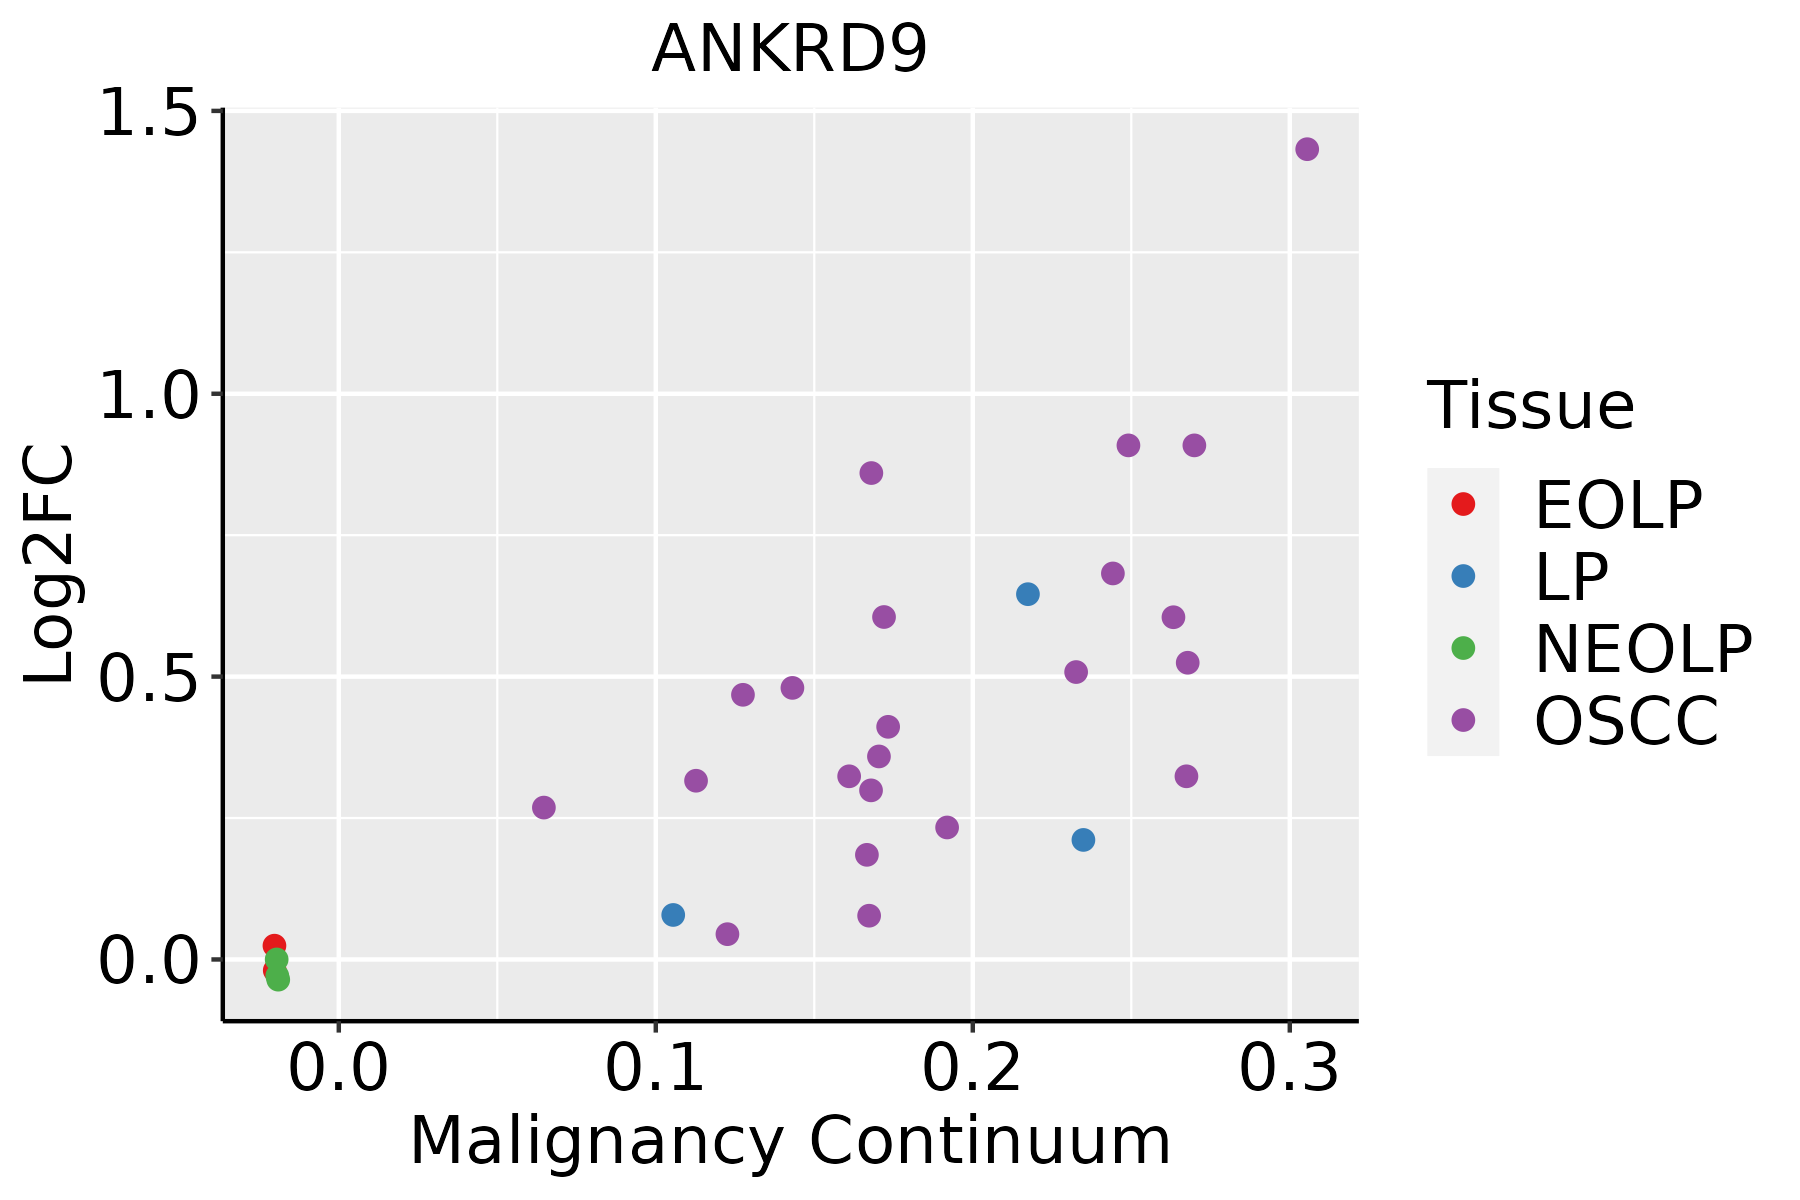 | EOLP: Erosive Oral lichen planus |
| LP: leukoplakia | ||
| NEOLP: Non-erosive oral lichen planus | ||
| OSCC: Oral squamous cell carcinoma | ||
| Skin | 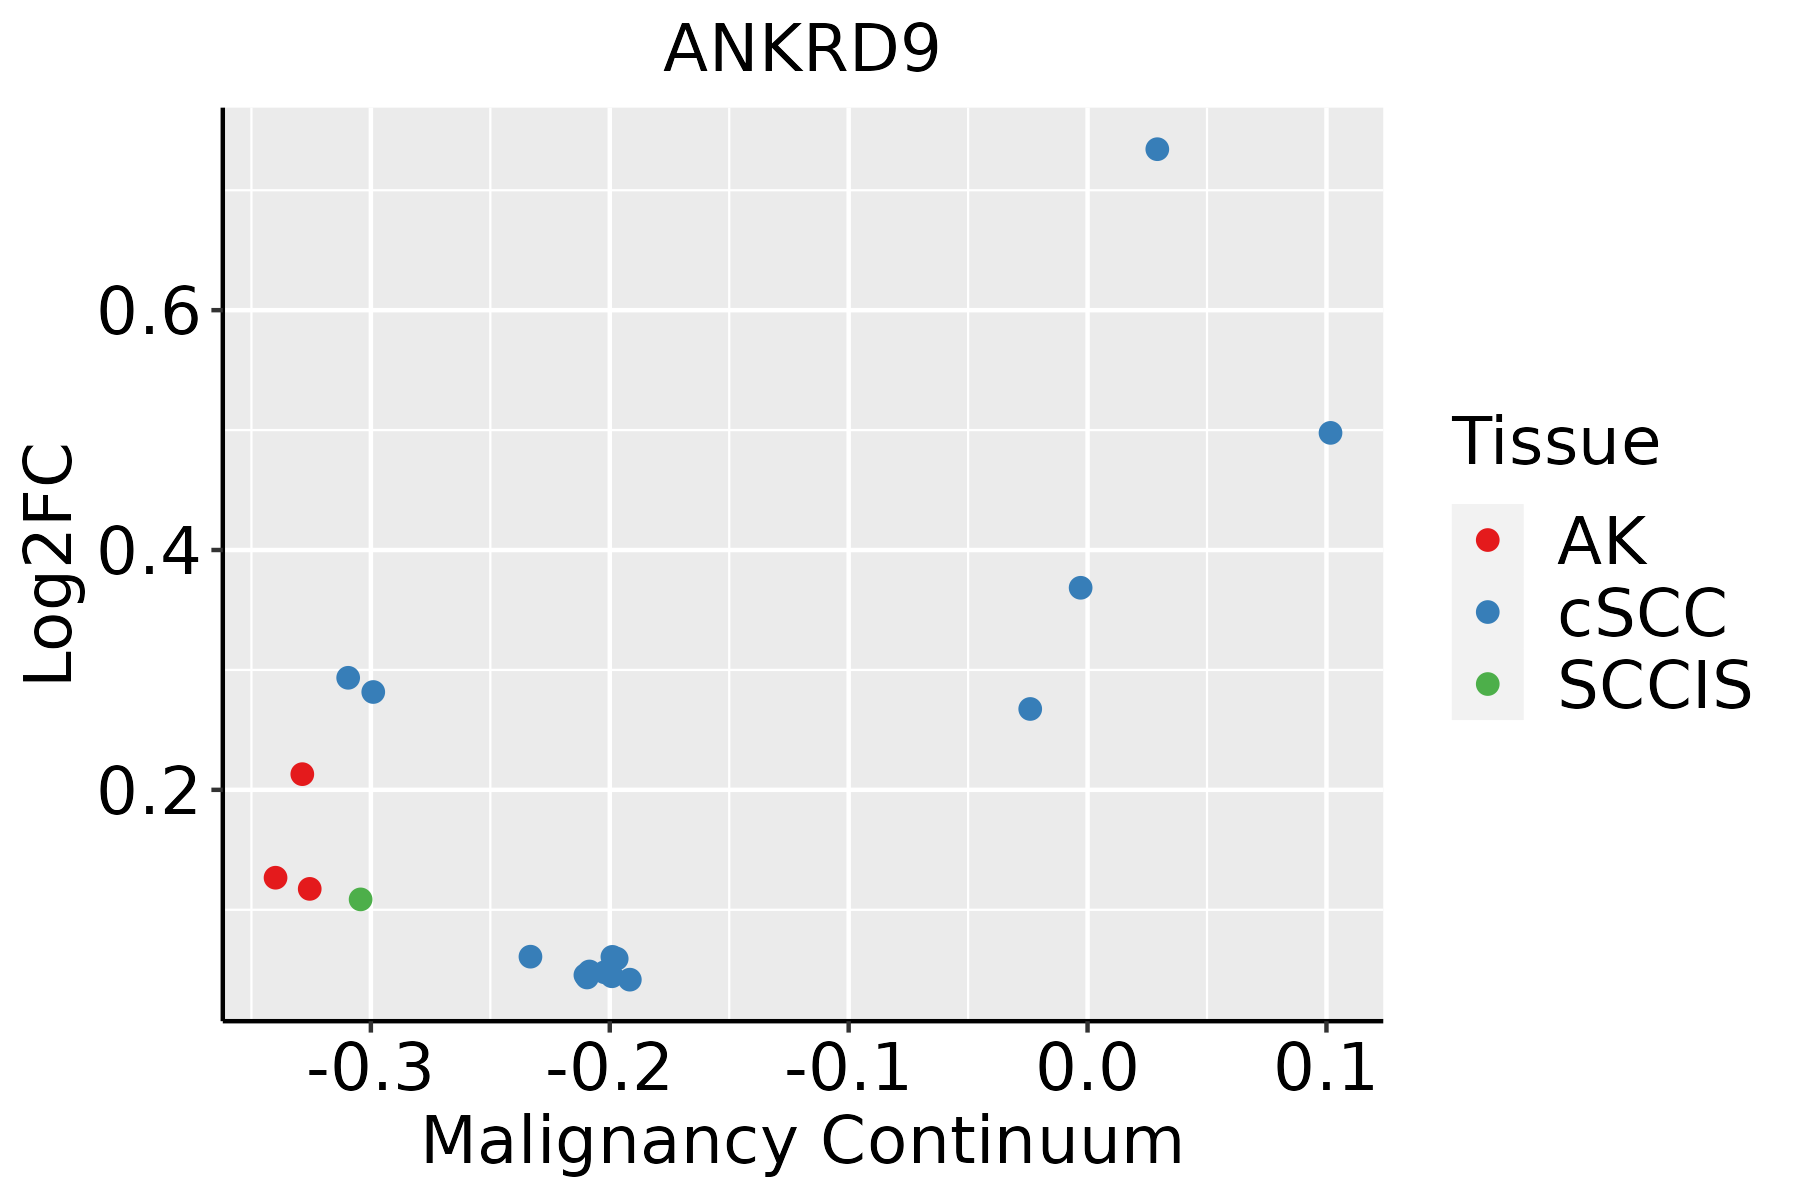 | AK: Actinic keratosis |
| cSCC: Cutaneous squamous cell carcinoma | ||
| SCCIS:squamous cell carcinoma in situ | ||
| Thyroid |  | ATC: Anaplastic thyroid cancer |
| HT: Hashimoto's thyroiditis | ||
| PTC: Papillary thyroid cancer |
| ∗log2FC in expression of this searched gene in stem-like cells from each diseased tissue sample relative to stem-like cells in normal samples in each tissue plotted against the malignancy continuum. Samples are colored based on if they are from different disease stage. |
Top |
Malignant transformation related pathway analysis |
| Find out the enriched GO biological processes and KEGG pathways involved in transition from healthy to precancer to cancer |
| Tissue | Disease Stage | Enriched GO biological Processes |
| Oral cavity | OSCC |  |
| Oral cavity | LP |  |
| Oral cavity | EOLP |  |
| Oral cavity | NEOLP |  |
| Esophagus | HGIN |  |
| ∗Top 15 enriched GO BP terms are showed in the bar plot of each disease state in each tissue. Each row represents a significant GO biological process which is colored according to the -log10(p.adjust). |
| Page: 1 2 3 4 5 6 7 8 9 |
| GO ID | Tissue | Disease Stage | Description | Gene Ratio | Bg Ratio | pvalue | p.adjust | Count |
| GO:0010498 | Colorectum | AD | proteasomal protein catabolic process | 174/3918 | 490/18723 | 3.18e-14 | 7.66e-12 | 174 |
| GO:0043161 | Colorectum | AD | proteasome-mediated ubiquitin-dependent protein catabolic process | 141/3918 | 412/18723 | 1.77e-10 | 1.68e-08 | 141 |
| GO:0055076 | Colorectum | AD | transition metal ion homeostasis | 53/3918 | 138/18723 | 1.89e-06 | 5.65e-05 | 53 |
| GO:0046916 | Colorectum | AD | cellular transition metal ion homeostasis | 43/3918 | 115/18723 | 3.62e-05 | 6.56e-04 | 43 |
| GO:00104981 | Colorectum | SER | proteasomal protein catabolic process | 132/2897 | 490/18723 | 3.08e-11 | 5.55e-09 | 132 |
| GO:00431611 | Colorectum | SER | proteasome-mediated ubiquitin-dependent protein catabolic process | 105/2897 | 412/18723 | 7.48e-08 | 4.70e-06 | 105 |
| GO:00550761 | Colorectum | SER | transition metal ion homeostasis | 41/2897 | 138/18723 | 1.66e-05 | 5.05e-04 | 41 |
| GO:00469161 | Colorectum | SER | cellular transition metal ion homeostasis | 33/2897 | 115/18723 | 2.20e-04 | 3.89e-03 | 33 |
| GO:0010498111 | Esophagus | ESCC | proteasomal protein catabolic process | 369/8552 | 490/18723 | 1.13e-41 | 1.80e-38 | 369 |
| GO:0043161111 | Esophagus | ESCC | proteasome-mediated ubiquitin-dependent protein catabolic process | 312/8552 | 412/18723 | 3.53e-36 | 4.48e-33 | 312 |
| GO:005507617 | Esophagus | ESCC | transition metal ion homeostasis | 87/8552 | 138/18723 | 2.85e-05 | 2.37e-04 | 87 |
| GO:00469169 | Esophagus | ESCC | cellular transition metal ion homeostasis | 70/8552 | 115/18723 | 7.28e-04 | 3.79e-03 | 70 |
| GO:00550703 | Esophagus | ESCC | copper ion homeostasis | 15/8552 | 18/18723 | 1.20e-03 | 5.88e-03 | 15 |
| GO:00068781 | Esophagus | ESCC | cellular copper ion homeostasis | 12/8552 | 15/18723 | 7.31e-03 | 2.63e-02 | 12 |
| GO:001049822 | Liver | HCC | proteasomal protein catabolic process | 351/7958 | 490/18723 | 6.92e-40 | 1.46e-36 | 351 |
| GO:004316122 | Liver | HCC | proteasome-mediated ubiquitin-dependent protein catabolic process | 299/7958 | 412/18723 | 7.82e-36 | 8.27e-33 | 299 |
| GO:005507612 | Liver | HCC | transition metal ion homeostasis | 81/7958 | 138/18723 | 8.87e-05 | 7.72e-04 | 81 |
| GO:004691611 | Liver | HCC | cellular transition metal ion homeostasis | 67/7958 | 115/18723 | 4.64e-04 | 3.08e-03 | 67 |
| GO:0055070 | Liver | HCC | copper ion homeostasis | 14/7958 | 18/18723 | 2.57e-03 | 1.23e-02 | 14 |
| GO:001049820 | Oral cavity | OSCC | proteasomal protein catabolic process | 336/7305 | 490/18723 | 5.45e-41 | 8.63e-38 | 336 |
| Page: 1 2 |
| Pathway ID | Tissue | Disease Stage | Description | Gene Ratio | Bg Ratio | pvalue | p.adjust | qvalue | Count |
| Page: 1 |
Top |
Cell-cell communication analysis |
| Identification of potential cell-cell interactions between two cell types and their ligand-receptor pairs for different disease states |
| Ligand | Receptor | LRpair | Pathway | Tissue | Disease Stage |
| Page: 1 |
Top |
Single-cell gene regulatory network inference analysis |
| Find out the significant the regulons (TFs) and the target genes of each regulon across cell types for different disease states |
| TF | Cell Type | Tissue | Disease Stage | Target Gene | RSS | Regulon Activity |
| ∗The dot plots of a searched regulon are shown for all cell subpopulations in each disease state of each tissue based on the regulon specific score inferred using pySCENIC and by calculating the average expression. |
| Page: 1 |
Top |
Somatic mutation of malignant transformation related genes |
| Annotation of somatic variants for genes involved in malignant transformation |
| Hugo Symbol | Variant Class | Variant Classification | dbSNP RS | HGVSc | HGVSp | HGVSp Short | SWISSPROT | BIOTYPE | SIFT | PolyPhen | Tumor Sample Barcode | Tissue | Histology | Sex | Age | Stage | Therapy Types | Drugs | Outcome |
| ANKRD9 | SNV | Missense_Mutation | c.769C>T | p.Arg257Cys | p.R257C | Q96BM1 | protein_coding | tolerated(0.2) | possibly_damaging(0.642) | TCGA-A6-6780-01 | Colorectum | colon adenocarcinoma | Male | >=65 | I/II | Unknown | Unknown | SD | |
| ANKRD9 | SNV | Missense_Mutation | rs750170448 | c.191N>A | p.Arg64His | p.R64H | Q96BM1 | protein_coding | tolerated(0.14) | benign(0.284) | TCGA-NH-A6GC-01 | Colorectum | colon adenocarcinoma | Female | >=65 | I/II | Chemotherapy | fluorouracil | SD |
| ANKRD9 | SNV | Missense_Mutation | novel | c.932N>C | p.Leu311Ser | p.L311S | Q96BM1 | protein_coding | deleterious(0) | probably_damaging(0.922) | TCGA-B5-A1MX-01 | Endometrium | uterine corpus endometrioid carcinoma | Female | <65 | I/II | Hormone Therapy | megace | SD |
| ANKRD9 | SNV | Missense_Mutation | novel | c.295N>T | p.Ala99Ser | p.A99S | Q96BM1 | protein_coding | deleterious(0.01) | probably_damaging(0.997) | TCGA-NC-A5HI-01 | Lung | lung squamous cell carcinoma | Female | >=65 | I/II | Chemotherapy | cisplatin | CR |
| ANKRD9 | SNV | Missense_Mutation | c.844G>A | p.Ala282Thr | p.A282T | Q96BM1 | protein_coding | deleterious(0) | possibly_damaging(0.578) | TCGA-BR-8680-01 | Stomach | stomach adenocarcinoma | Male | <65 | III/IV | Chemotherapy | oxaliplatin | CR |
| Page: 1 |
Top |
Related drugs of malignant transformation related genes |
| Identification of chemicals and drugs interact with genes involved in malignant transfromation |
| (DGIdb 4.0) |
| Entrez ID | Symbol | Category | Interaction Types | Drug Claim Name | Drug Name | PMIDs |
| Page: 1 |

Copyright 2023-Present -The University of Texas Health Science Center at Houston |