
|
|||||
|
 | |
| |
| |
| |
| |
| |
|
Gene: ADH1A |
Gene summary for ADH1A |
| Gene information | Species | Human | Gene symbol | ADH1A | Gene ID | 124 |
| Gene name | alcohol dehydrogenase 1A (class I), alpha polypeptide | |
| Gene Alias | ADH1 | |
| Cytomap | 4q23 | |
| Gene Type | protein-coding | GO ID | GO:0001523 | UniProtAcc | P07327 |
Top |
Malignant transformation analysis |
| Identification of the aberrant gene expression in precancerous and cancerous lesions by comparing the gene expression of stem-like cells in diseased tissues with normal stem cells |
| Entrez ID | Symbol | Replicates | Species | Organ | Tissue | Adj P-value | Log2FC | Malignancy |
| 124 | ADH1A | HCC1_Meng | Human | Liver | HCC | 5.84e-06 | -2.40e-01 | 0.0246 |
| 124 | ADH1A | HCC2_Meng | Human | Liver | HCC | 4.57e-04 | -2.64e-01 | 0.0107 |
| 124 | ADH1A | cirrhotic3 | Human | Liver | Cirrhotic | 3.04e-03 | -2.62e-01 | 0.0215 |
| 124 | ADH1A | HCC1 | Human | Liver | HCC | 3.36e-05 | 3.52e+00 | 0.5336 |
| 124 | ADH1A | HCC2 | Human | Liver | HCC | 6.08e-32 | 4.60e+00 | 0.5341 |
| 124 | ADH1A | Pt13.a | Human | Liver | HCC | 3.35e-05 | 1.62e-01 | 0.021 |
| 124 | ADH1A | Pt13.b | Human | Liver | HCC | 1.16e-21 | 1.15e-01 | 0.0251 |
| 124 | ADH1A | Pt14.b | Human | Liver | HCC | 2.30e-16 | 4.21e-01 | 0.018 |
| 124 | ADH1A | S014 | Human | Liver | HCC | 1.26e-07 | -1.37e-01 | 0.2254 |
| 124 | ADH1A | S015 | Human | Liver | HCC | 2.33e-03 | -1.83e-01 | 0.2375 |
| Page: 1 |
| Tissue | Expression Dynamics | Abbreviation |
| Liver | 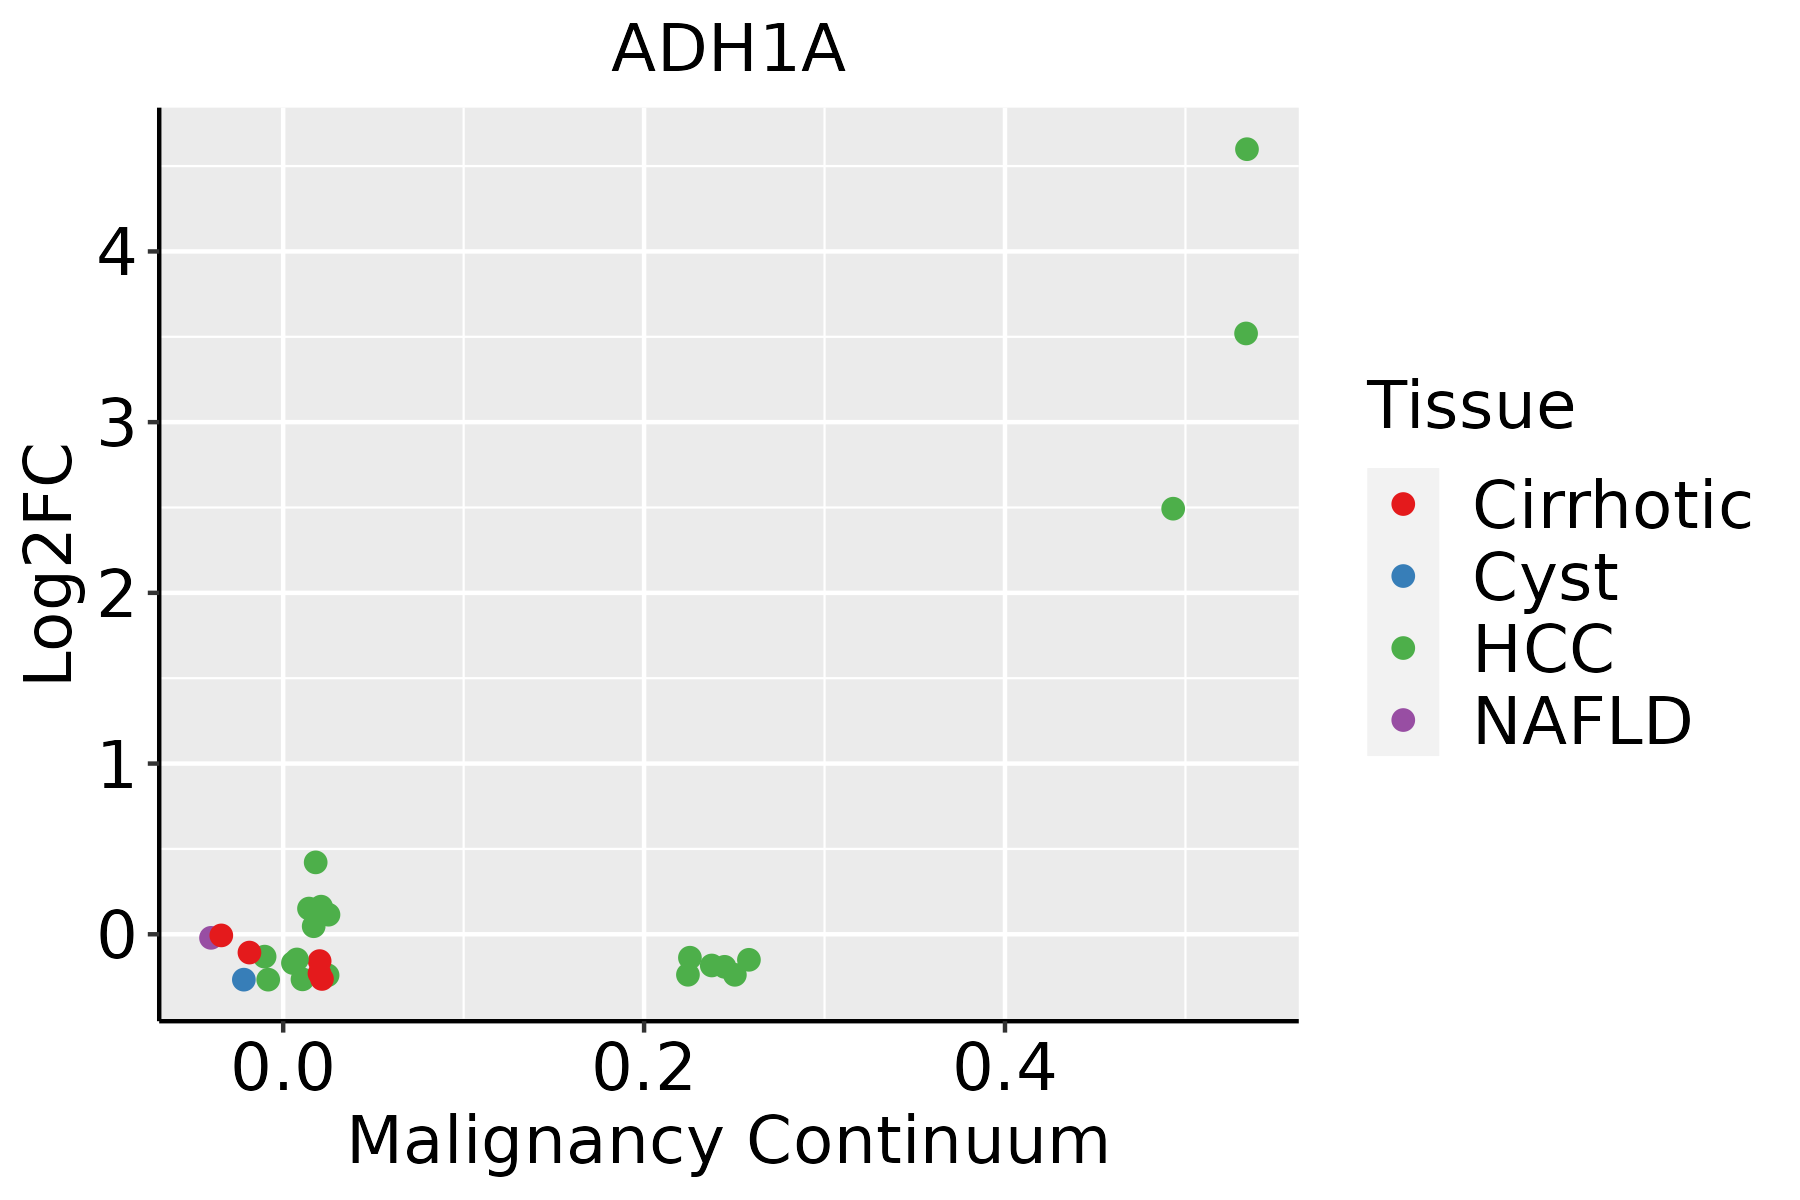 | HCC: Hepatocellular carcinoma |
| NAFLD: Non-alcoholic fatty liver disease |
| ∗log2FC in expression of this searched gene in stem-like cells from each diseased tissue sample relative to stem-like cells in normal samples in each tissue plotted against the malignancy continuum. Samples are colored based on if they are from different disease stage. |
Top |
Malignant transformation related pathway analysis |
| Find out the enriched GO biological processes and KEGG pathways involved in transition from healthy to precancer to cancer |
| Tissue | Disease Stage | Enriched GO biological Processes |
| Oral cavity | OSCC |  |
| Oral cavity | LP |  |
| Oral cavity | EOLP |  |
| Oral cavity | NEOLP |  |
| Esophagus | HGIN |  |
| ∗Top 15 enriched GO BP terms are showed in the bar plot of each disease state in each tissue. Each row represents a significant GO biological process which is colored according to the -log10(p.adjust). |
| Page: 1 2 3 4 5 6 7 8 9 |
| GO ID | Tissue | Disease Stage | Description | Gene Ratio | Bg Ratio | pvalue | p.adjust | Count |
| GO:000609112 | Liver | Cirrhotic | generation of precursor metabolites and energy | 238/4634 | 490/18723 | 6.85e-31 | 1.07e-27 | 238 |
| GO:000606612 | Liver | Cirrhotic | alcohol metabolic process | 141/4634 | 353/18723 | 1.57e-10 | 8.03e-09 | 141 |
| GO:00067202 | Liver | Cirrhotic | isoprenoid metabolic process | 46/4634 | 116/18723 | 2.71e-04 | 2.41e-03 | 46 |
| GO:00067212 | Liver | Cirrhotic | terpenoid metabolic process | 38/4634 | 97/18723 | 1.16e-03 | 7.89e-03 | 38 |
| GO:004244511 | Liver | Cirrhotic | hormone metabolic process | 73/4634 | 218/18723 | 2.22e-03 | 1.36e-02 | 73 |
| GO:00343085 | Liver | Cirrhotic | primary alcohol metabolic process | 37/4634 | 102/18723 | 6.17e-03 | 3.07e-02 | 37 |
| GO:012025411 | Liver | Cirrhotic | olefinic compound metabolic process | 51/4634 | 153/18723 | 1.03e-02 | 4.61e-02 | 51 |
| GO:000609122 | Liver | HCC | generation of precursor metabolites and energy | 340/7958 | 490/18723 | 4.04e-34 | 2.85e-31 | 340 |
| GO:000606621 | Liver | HCC | alcohol metabolic process | 208/7958 | 353/18723 | 2.80e-10 | 9.50e-09 | 208 |
| GO:000672011 | Liver | HCC | isoprenoid metabolic process | 65/7958 | 116/18723 | 2.23e-03 | 1.11e-02 | 65 |
| GO:003430812 | Liver | HCC | primary alcohol metabolic process | 55/7958 | 102/18723 | 1.30e-02 | 4.67e-02 | 55 |
| Page: 1 |
| Pathway ID | Tissue | Disease Stage | Description | Gene Ratio | Bg Ratio | pvalue | p.adjust | qvalue | Count |
| hsa04936 | Liver | Cirrhotic | Alcoholic liver disease | 60/2530 | 142/8465 | 1.07e-03 | 5.85e-03 | 3.61e-03 | 60 |
| hsa000109 | Liver | Cirrhotic | Glycolysis / Gluconeogenesis | 32/2530 | 67/8465 | 1.50e-03 | 7.80e-03 | 4.81e-03 | 32 |
| hsa049361 | Liver | Cirrhotic | Alcoholic liver disease | 60/2530 | 142/8465 | 1.07e-03 | 5.85e-03 | 3.61e-03 | 60 |
| hsa0001012 | Liver | Cirrhotic | Glycolysis / Gluconeogenesis | 32/2530 | 67/8465 | 1.50e-03 | 7.80e-03 | 4.81e-03 | 32 |
| hsa0062021 | Liver | HCC | Pyruvate metabolism | 37/4020 | 47/8465 | 1.10e-05 | 8.03e-05 | 4.46e-05 | 37 |
| hsa0007141 | Liver | HCC | Fatty acid degradation | 33/4020 | 43/8465 | 8.41e-05 | 4.27e-04 | 2.37e-04 | 33 |
| hsa049362 | Liver | HCC | Alcoholic liver disease | 89/4020 | 142/8465 | 1.73e-04 | 8.53e-04 | 4.75e-04 | 89 |
| hsa0001022 | Liver | HCC | Glycolysis / Gluconeogenesis | 43/4020 | 67/8465 | 4.26e-03 | 1.29e-02 | 7.15e-03 | 43 |
| hsa0062031 | Liver | HCC | Pyruvate metabolism | 37/4020 | 47/8465 | 1.10e-05 | 8.03e-05 | 4.46e-05 | 37 |
| hsa0007151 | Liver | HCC | Fatty acid degradation | 33/4020 | 43/8465 | 8.41e-05 | 4.27e-04 | 2.37e-04 | 33 |
| hsa049363 | Liver | HCC | Alcoholic liver disease | 89/4020 | 142/8465 | 1.73e-04 | 8.53e-04 | 4.75e-04 | 89 |
| hsa0001032 | Liver | HCC | Glycolysis / Gluconeogenesis | 43/4020 | 67/8465 | 4.26e-03 | 1.29e-02 | 7.15e-03 | 43 |
| Page: 1 |
Top |
Cell-cell communication analysis |
| Identification of potential cell-cell interactions between two cell types and their ligand-receptor pairs for different disease states |
| Ligand | Receptor | LRpair | Pathway | Tissue | Disease Stage |
| Page: 1 |
Top |
Single-cell gene regulatory network inference analysis |
| Find out the significant the regulons (TFs) and the target genes of each regulon across cell types for different disease states |
| TF | Cell Type | Tissue | Disease Stage | Target Gene | RSS | Regulon Activity |
| ∗The dot plots of a searched regulon are shown for all cell subpopulations in each disease state of each tissue based on the regulon specific score inferred using pySCENIC and by calculating the average expression. |
| Page: 1 |
Top |
Somatic mutation of malignant transformation related genes |
| Annotation of somatic variants for genes involved in malignant transformation |
| Hugo Symbol | Variant Class | Variant Classification | dbSNP RS | HGVSc | HGVSp | HGVSp Short | SWISSPROT | BIOTYPE | SIFT | PolyPhen | Tumor Sample Barcode | Tissue | Histology | Sex | Age | Stage | Therapy Types | Drugs | Outcome |
| ADH1A | SNV | Missense_Mutation | c.538N>C | p.Gly180Arg | p.G180R | P07327 | protein_coding | deleterious(0) | probably_damaging(1) | TCGA-AO-A0J8-01 | Breast | breast invasive carcinoma | Female | <65 | I/II | Chemotherapy | cyclophosphamide | SD | |
| ADH1A | SNV | Missense_Mutation | c.1081G>C | p.Asp361His | p.D361H | P07327 | protein_coding | tolerated(0.09) | possibly_damaging(0.897) | TCGA-BH-A0W7-01 | Breast | breast invasive carcinoma | Female | <65 | I/II | Chemotherapy | taxotere | CR | |
| ADH1A | insertion | Nonsense_Mutation | novel | c.618_619insCAAAAATTTTTTTATCAATAAAAGTTATTATAAAAGAGAAGT | p.Leu206_Ser207insGlnLysPhePheTyrGlnTerLysLeuLeuTerLysArgSer | p.L206_S207insQKFFYQ*KLL*KRS | P07327 | protein_coding | TCGA-AN-A04C-01 | Breast | breast invasive carcinoma | Female | <65 | I/II | Unknown | Unknown | SD | ||
| ADH1A | SNV | Missense_Mutation | novel | c.568N>A | p.Val190Ile | p.V190I | P07327 | protein_coding | deleterious(0.01) | probably_damaging(0.994) | TCGA-AA-3950-01 | Colorectum | colon adenocarcinoma | Female | >=65 | I/II | Unknown | Unknown | SD |
| ADH1A | SNV | Missense_Mutation | rs764209859 | c.937N>T | p.Arg313Cys | p.R313C | P07327 | protein_coding | deleterious(0.04) | probably_damaging(1) | TCGA-AZ-4614-01 | Colorectum | colon adenocarcinoma | Female | >=65 | I/II | Unknown | Unknown | PD |
| ADH1A | SNV | Missense_Mutation | c.157G>A | p.Val53Met | p.V53M | P07327 | protein_coding | tolerated(0.18) | benign(0.366) | TCGA-F4-6808-01 | Colorectum | colon adenocarcinoma | Female | <65 | I/II | Unknown | Unknown | SD | |
| ADH1A | SNV | Missense_Mutation | c.857C>T | p.Ala286Val | p.A286V | P07327 | protein_coding | deleterious(0) | benign(0.193) | TCGA-G4-6628-01 | Colorectum | colon adenocarcinoma | Male | >=65 | I/II | Unknown | Unknown | SD | |
| ADH1A | SNV | Missense_Mutation | novel | c.567N>T | p.Lys189Asn | p.K189N | P07327 | protein_coding | deleterious(0.01) | probably_damaging(0.999) | TCGA-NH-A5IV-01 | Colorectum | colon adenocarcinoma | Female | >=65 | I/II | Unknown | Unknown | SD |
| ADH1A | SNV | Missense_Mutation | c.119A>T | p.Lys40Met | p.K40M | P07327 | protein_coding | deleterious(0) | probably_damaging(1) | TCGA-AG-3878-01 | Colorectum | rectum adenocarcinoma | Male | <65 | I/II | Unknown | Unknown | SD | |
| ADH1A | SNV | Missense_Mutation | novel | c.768N>T | p.Lys256Asn | p.K256N | P07327 | protein_coding | tolerated(0.18) | benign(0.093) | TCGA-A5-A1OF-01 | Endometrium | uterine corpus endometrioid carcinoma | Female | <65 | I/II | Unknown | Unknown | SD |
| Page: 1 2 3 4 |
Top |
Related drugs of malignant transformation related genes |
| Identification of chemicals and drugs interact with genes involved in malignant transfromation |
| (DGIdb 4.0) |
| Entrez ID | Symbol | Category | Interaction Types | Drug Claim Name | Drug Name | PMIDs |
| 124 | ADH1A | DRUGGABLE GENOME | FOMEPIZOLE | FOMEPIZOLE | ||
| 124 | ADH1A | DRUGGABLE GENOME | abacavir | ABACAVIR | 24625462 | |
| 124 | ADH1A | DRUGGABLE GENOME | ethanol | ALCOHOL | ||
| 124 | ADH1A | DRUGGABLE GENOME | FOMEPIZOLE | FOMEPIZOLE | ||
| 124 | ADH1A | DRUGGABLE GENOME | acetaldehyde | ACETALDEHYDE | 31002879 | |
| 124 | ADH1A | DRUGGABLE GENOME | inhibitor | CHEMBL1308 | FOMEPIZOLE | |
| 124 | ADH1A | DRUGGABLE GENOME | Fomepizole | FOMEPIZOLE |
| Page: 1 |

Copyright 2023-Present -The University of Texas Health Science Center at Houston |